Abstract
The onset of breast cancer among young patients is a major issue in cancer etiology. Our previous study has shown that poor prognosis in young women with breast cancer is associated with lower expression of the microRNA miR‐1285‐5p. In this study, we showed that the expression of miR‐1285‐5p is lower in tumor tissues than in normal tissues. Accumulating evidence suggests that miR‐1285‐5p plays critical roles in various types of cancers. However, the functional role of miR‐1285‐5p in breast cancer remains to be elucidated. Here, we showed the tumor‐suppressive role of miR‐1285‐5p and detailed its mechanism of action in breast cancer. Overexpression of miR‐1285‐5p significantly inhibited cell proliferation in breast cancer cells regardless of the tumor subtype. Among the target genes of miR‐1285‐5p, we found that transmembrane protein 194A (TMEM194A) was directly regulated by miR‐1285‐5p. Notably, separation of centrosomes from the nuclear envelope was observed upon knockdown of TMEM194A or overexpression of miR‐1285‐5p. In conclusion, our findings show that miR‐1285‐5p is a tumor suppressor via TMEM194A inhibition in breast cancer.
Keywords: breast cancer, cell proliferation, miR‐1285‐5p, poor prognosis, TMEM194A
We showed the tumor‐suppressive role of miR‐1285‐5p and detailed its mechanism of action in breast cancer. Overexpression of miR‐1285‐5p significantly inhibited cell proliferation in breast cancer cells regardless of the tumor subtype. We found that transmembrane protein 194A (TMEM194A) was directly regulated by miR‐1285‐5p. Our findings show that separation of centrosomes from the nuclear envelope was observed upon knockdown of TMEM194A or overexpression of miR‐1285‐5p and reveal the tumor suppressive role of miR‐1285‐5p via TMEM194A inhibition in breast cancer.
1. INTRODUCTION
Breast cancer is the most common cancer in women, with an estimated 2.1 million cases diagnosed in 2018. Unfortunately, this number is increasing given the recent dramatic changes in women's lifestyle.1 Breast cancer is a heterogeneous disease with different subtypes.2, 3 Breast cancer is usually categorized into three major subtypes, which show distinct characteristics and reflect patient prognosis: hormone receptor (HR)‐positive type (estrogen receptor [ER]+/human epidermal growth factor receptor 2 [HER2]−), HER2‐positive type (ER−/HER2+) and triple‐negative type (ER−/HER2−).4, 5 ER and HER2 status is clinically significant for their possible use in targeted therapies and treatment strategies based on subtyping have yielded favorable outcomes.5 However, recurrence remains a problem and is a major cause of breast cancer‐related death. Recurrence that occurs within 5 years from the curative treatment is defined as early recurrence. Early recurrence is frequently observed in triple‐negative and HER2‐positive breast cancer, while late recurrence frequently occurs in the HR‐positive type.5 Regardless of tumor biology or subtype, higher recurrence is observed in young women compared with the elderdly.6
The onset of breast cancer among young patients is a major clinical issue.6, 7, 8, 9 Recurrence in young women has both a personal and social impact, and results in a substantial economic burden for patients.9, 10 Because of the higher probability of recurrence, clinicians tend to favor aggressive therapeutic treatment for young women, increasing the burden on the patients.9 Thus, there is an urgent need for the discovery of novel biomarkers that would allow physicians to determine when to escalate or de–escalate breast cancer treatment, especially in young women.5
MicroRNA (miRNA) are small non–coding RNA that bind to complementary sequences on target mRNA, resulting in their silencing. They have been associated with initiation, development and metastasis in various types of cancers.11, 12 With respect to breast cancer, it has been shown that miR‐21 and miR‐155 are oncogenic miRNA,13, 14 while miRNA of the miR‐200 family and miR‐205 function as tumor suppressors.15 The use of miRNA for liquid biopsy for diagnosis of breast cancer and early detection of recurrence is clinically relevant.16, 17 Previously, we reported that the miRNA profile correlates with prognosis in young women with breast cancer.18 We showed that early recurrence is correlated with lower expression of miR‐1285‐5p and higher expression levels of miR‐183‐5p and miR‐194‐5p. However, the genetic relationship between breast cancer recurrence and these miRNA remains to be elucidated. miR‐1285 has been linked to cancer since its discovery by sequencing of human embryonic stem cells.19 miR‐1285 has been reported to inhibit p53 by binding to its 3′‐UTR.20 Upregulation of miR‐1285 is induced by ionizing radiation.21 With regard to miR‐1285‐5p, high expression levels of this miRNA have been associated with infiltrative growth of the follicular variant of papillary thyroid carcinoma.22 Generally, miRNA have a tissue‐specific function and play tumor‐suppressive and oncogenic roles in a context‐dependent manner.13, 14, 15 While miR‐1285‐5p has been identified as a tumor promoter in the development of non–small‐cell lung carcinoma,23 it has been suggested that miR‐1285‐5p plays a tumor‐suppressive role in renal cell carcinoma.24 However, the role of miR‐1285‐5p in breast cancer has not yet been clarified.
Our aim was to confirm whether miR‐1285‐5p plays a role in breast cancer progression. In this study, miR‐1285‐5p was found to be involved in cell growth via the inhibition of the transmembrane protein 194A (TMEM194A). We analyzed the correlation between miR‐1285‐5p and TMEM194A. As miR‐1285‐5p and TMEM194A levels were associated with breast cancer survival, our investigation of the role of the miR‐1285‐5p/TMEM194A axis provides novel insight into the tumorigenesis of breast cancer.
2. MATERIALS AND METHODS
2.1. Ethics committee approval
This study was approved by the internal ethical review board of the National Cancer Center (NCC), Tokyo, Japan (No. 2014‐386).
2.2. Clinical samples
Clinical samples were confirmed as primary breast cancer at the NCC Hospital, Japan. This study used remaining samples from our previous study.18 Briefly, matched tumor and non–tumor breast epithelial tissues were obtained from formalin‐fixed paraffin‐embedded (FFPE) tissues by laser‐capture microdissection for RNA extraction.
2.3. Cell lines and transfection
Four human breast cancer cell lines (MCF‐7, MDA‐MB‐231, HCC1937 and HCC1954) and HEK293 cells were used in this study. Breast cancer cell lines and HEK293 cells were cultured in Gibco RPMI‐1640 medium (Thermo Fisher Scientific) supplemented with 10% FBS and 1% penicillin/streptomycin. For miRNA functional studies, miRNA mimics (miR‐1285‐5p and negative control [NC]) were purchased from Ambion (Thermo Fisher Scientific) and miRNA inhibitors (miR‐1285‐5p and NC) from Qiagen. The recombinant plasmid DNA (TMEM194A and control) was purchased from OriGene Technologies. The transfection of either siRNA or miRNA (mimic/inhibitor) was accomplished using DharmaFECT1 Transfection Reagent (Horizon), according to the manufacturer's instructions. Co–transfection of plasmid DNA and miRNA mimics was performed using Lipofectamine 2000 (Thermo Fisher Scientific), according to the manufacturer's instructions.
2.4. RNA isolation and qPCR assay
Total RNA from cultured cells were purified using the miRNeasy Kit (Qiagen), and total RNA from FFPE tissues by using the miRNeasy FFPE Kit (Qiagen), respectively. RNA quality was evaluated with Agilent 2100 Bioanalyzer (Agilent Technologies) and a NanoDrop 1000 spectrophotometer (Thermo Fisher Scientific). The expression of miRNA and mRNA were determined by TaqMan‐based qPCR methods, according to the manufacturer's instructions. All gene‐specific and miRNA‐specific primers were purchased from Applied Biosystems (Thermo Fisher Scientific). All qPCR reactions were performed in triplicate. Expression values of miRNA were normalized to miR‐16 for clinical samples, and RNU6B for cultured cells, while expression values of mRNA were normalized by GAPDH.
2.5. Microarray analysis
Gene expression for mRNA was analyzed using Agilent Array platform (8 × 60 K, Agilent Technologies), according to the manufacturer's protocols. The Gene Expression Omnibus accession number is GSE125824.
2.6. Cell proliferation assay
A CCK‐8 assay (Dojindo Molecular Technologies) was performed according to manufacturer's instructions. Briefly, 6000 cells/well were seeded in 96‐well plates. One day after seeding, transfection was performed in octuplet. After the CCK‐8 solution was added and incubated for 1 hour, the absorbance was measured with a microplate reader. The same experiments were repeated after a defined incubation period.
2.7. Colony formation assay
Transfected cells were replaced at a density of 10 000 cells/well in 6‐well plates. The colonies containing at least 10 cells were scored. The colonies resulting from the surviving cells were counted as each defined point.
2.8. Immunoblots
Cells were washed with PBS and scraped into M‐PER Mammalian Protein Extraction Reagent (Thermo scientific), according to the manufacturer's instructions. The lysates were transferred to a micro centrifuge tube and centrifuged for 10 minutes at 14 000 g at 4°C. The protein concentration of the supernatant was determined by Qubit assay (Thermo Fisher Scientific). Protein extracts (20‐30 µg) were boiled in Sample Buffer Solution with 3‐mercapto‐1,2‐propandiol (×4) (FUJIFILM Wako Pure Chemical) at 100°C for 5 minutes then resolved on 7% Mini‐PROTEAN TGX Precast Gels (Bio‐Rad Laboratories) before transfer onto a polyvinylidene fluoride membrane. Membranes were blocked in Blocking One (nacalai tesque). The membranes were incubated for 60 minutes with each primary antibody at room temperature with gentle agitation. The membranes were incubated for 60 minutes with an HRP‐labeled secondary antibodies at room temperature. All membrane were detected using the Western Lightning Plus‐ECL (PerkinElmer) and luminescent images were analyzed using a LuminoImager, LAS‐3000 (Fujifilm). The relative band and the molecular mass relative to standard molecular mass markers were assessed. The following antibodies were used for immunoblots: rabbit anti–SLC30A9 (1:250, Sigma‐Aldrich), rabbit anti–TMEM194A (1:125, Sigma‐Aldrich) and mouse anti–actin (1:2500, Santa Cruz Biotechnology) were used as primary antibodies, and anti–mouse and anti‐rabbit antibodies were used as secondary antibodies (1:2500; affinity purified sheep anti–mouse IgG and 1:1250; affinity purified donkey anti–rabbit IgG, GE Healthcare).
2.9. Luciferase reporter assay
The recombinant vector was constructed by inserting the sequence of target genes 3′‐UTR into the pEZX‐MT06 vector encoding a luciferase reporter (GeneCopoeia). For luciferase assay, HEK293T cells were co–transfected with either miR‐1285‐5p or NC mimic and the luciferase vector containing wild‐type or mutated 3′‐UTR of the target genes. One day after co–transfection, cells were lysed and measured using a dual luciferase kit (Promega) for firefly and Renilla luciferase activity. Relative light units were determined and the data was expressed as the ratio of firefly : Renilla luciferase activity.
2.10. Immunofluorescence
Cells were washed in PBS and fixed with 4% paraformaldehyde for 10 minutes, and blocked with 2.5% Normal Horse Serum and 0.003% Triton X‐100 in PBS for 60 minutes. The primary antibodies used were rabbit anti–gamma tubulin (1:500, Abcam) and mouse anti–pericentrin (1:100, Abcam). The primary antibodies were mixed with 0.1% BSA and 0.003% Triton X‐100 in PBS and applied on to the cells overnight at 4°C. After washing with PBS, the secondary antibodies Alexa Flour 488 goat with either anti–rabbit or anti–mouse IgG (Molecular Probes) of dilution ratio 1:2000 and Hochest33258 (Dojindo Molecular Technologies) of dilution ratio 1:200 were applied for 2 hours. Fluorescence was viewed with confocal Microscopy (Olympus), with Water Immersion Objective 1.2 NA 60× lens. Digital images were captured with FLUOVIEW FV10i ver. 2.1 software in a 1024 × 1024 pixel format. For measurement of the distance between centrosomes and the nuclear envelope, at least 200 cells were measured.
2.11. Statistical analyses
Statistical differences were determined by unpaired two‐tailed Student's t‐test and Dunnett's test using JMP 10 software (SAS Institute). All values are presented as mean ± standard error (SE). The experimental data were considered statistically significant at P < 0.05. For gene set enrichment analysis, a modified form of the Kolmogorov‐Smirnov test was used for calculating the enrichment score.25
3. RESULTS
3.1. miR‐1285‐5p expression levels are lower in breast tumor tissues compared with normal tissues
In our previous study, we compared the expression levels of miRNA in tumor tissues from patients with breast cancer and with or without early recurrence, to identify novel prognostic biomarkers. We found that lower expression of miR‐1285‐5p in tumor tissues was correlated with poor prognosis.18 In this study, we first compared the levels of miR‐1285‐5p in tumor tissues and adjacent normal tissues. For this purpose, we used paired samples obtained in a previous study on young women with operable breast cancer (Table S1).18 By quantitative PCR (qPCR) analysis, we found that, in all cases, the levels of miR‐1285‐5p were significantly lower in the tumor tissues compared with their normal counterparts (Figure 1A).
Figure 1.
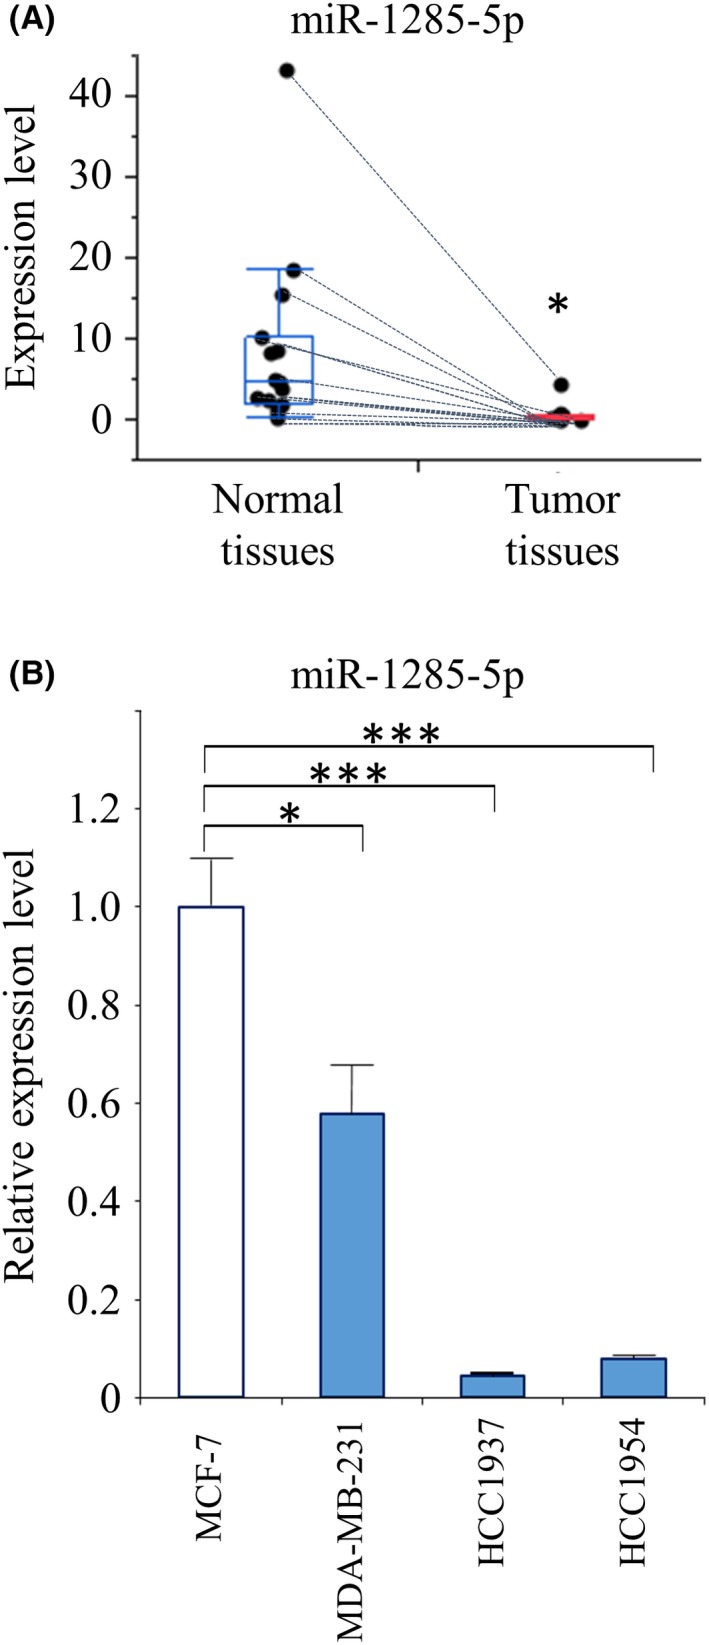
Decreased expression of miR‐1285‐5p in breast cancer. A, miR‐1285‐5p expression levels analyzed using the qPCR analysis in tumor tissues compared with those in the normal tissues (n = 15). The data are presented as the median value with an interquartile range. The expression of miR‐1285‐5p was normalized to that of miR‐16. B, miR‐1285‐5p expression levels among breast cancer cell lines determined using the qPCR analysis. The expression of miR‐1285‐5p was normalized to that of RNU6B. Representative data are mean ± SE of at least three independent experiments. *P < 0.05, ***P < 0.001
To investigate the levels of miR‐1285‐5p in different breast cancer types, we used breast cancer cell lines representative of the three most common breast cancer subtypes. Specifically, we used HR‐positive (MCF‐7), HER2‐positive (HCC1954) and triple‐negative (MDA‐MB‐231) cell lines. We also used triple‐negative HCC1937 cells, derived from primary breast tumor of a young women aged 22. MDA‐MB‐231, HCC1937 and HCC1954 showed significantly lower expression of miR‐1285‐5p than MCF‐7 (Figure 1B). These results suggested that the decreased expression of miR‐1285‐5p was related to tumor progression and that miR‐1285‐5p inhibition might be correlated with tumor aggressiveness.
3.2. miR‐1285‐5p inhibits breast cancer cell growth
To examine the role of miR‐1285‐5p in breast cancer progression, we investigated the effect of miR‐1285‐5p overexpression on cell proliferation. Cell proliferation assays showed that the overexpression of miR‐1285‐5p significantly suppressed cell proliferation (Figure 2A). The cell proliferation inhibition rates were as follows: MCF‐7, 55.4% (P = 0.023); MDA‐MB‐231, 46.6% (P = 0.004); HCC1937, 36.1% (P = 0.015); and HCC1954, 36.6% (P = 0.038). Furthermore, colony formation assays showed that overexpression of miR‐1285‐5p was significantly correlated with a decrease in the number of colonies formed using the four breast cancer cell lines (Figure 2B and C). However, the inhibition of miR‐1285‐5p did not alter breast cancer cell line proliferation (Figure S1). This might be a consequence of altered expression of miR‐1285‐5p, which already showed extremely low levels in the breast cancer cell lines used in the study.
Figure 2.
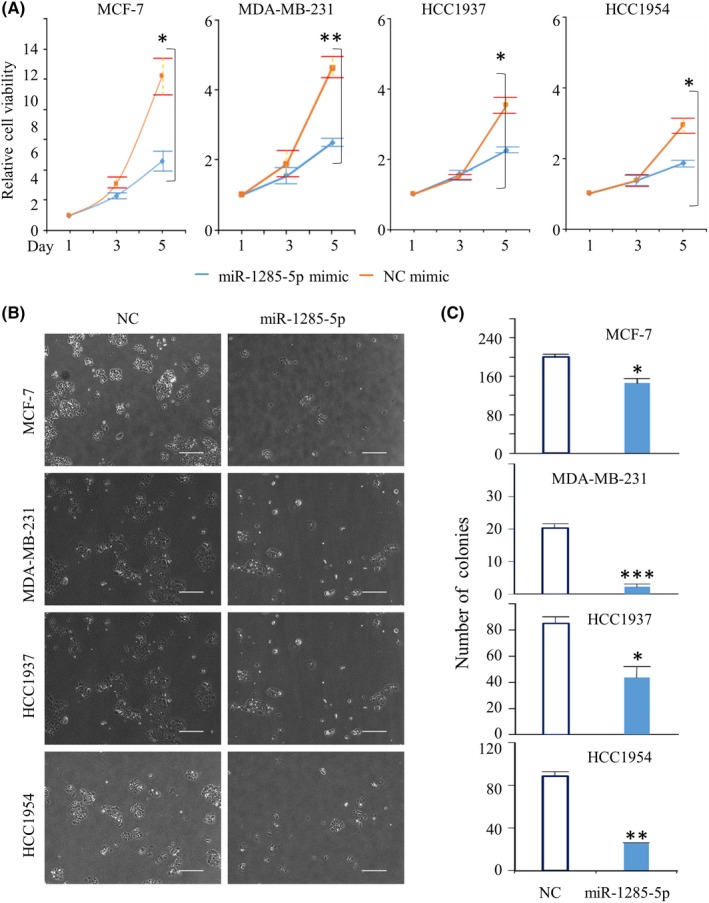
Inhibition of cell growth by miR‐1285‐5p. Assessment of miR‐1285 mimic effect on cell growth. A, The results of CCK‐8 assay are shown. The colored lines represent each miRNA mimic‐transfected cells as follows: blue for miR‐1285‐5p and orange for negative control (NC), respectively. B and C, The results of the colony formation assay are shown. Left panels: representative images. Right panels: graphs showing colony numbers. Scale bar, 500 µm. The data are presented as the mean ± SE of three independent experiments. *P < 0.05, **P < 0.01, ***P < 0.001. (Relative abs, Relative absorbance)
3.3. TMEM194A and SLC30A9, potential targets of miR‐1285‐5p, are associated with poor prognosis
Next, we performed microarray analysis in MCF‐7, MDA‐MB‐231, HCC1937 and HCC1954 cells to identify miR‐1285‐5p targets. Hierarchical clustering analysis revealed a segregation of cancer cells with or without miR‐1285‐5p overexpression regardless of the subtype (Figure 3A). The gene set enrichment analysis (GSEA) indicated that various pathways were affected by the overexpression of miR‐1285‐5p (nominal P‐value < 0.05; Table 1). For instance, the Myc, E2 Factor (E2F) and DNA repair pathways were downregulated upon overexpression of miR‐1285‐5p (Figure 3B). Both Myc and E2F are involved in growth‐promoting signal transduction pathways.26, 27 Therefore, our findings indicated that cancer‐related pathways were inhibited upon overexpression of miR‐1285‐5p, supporting our hypothesis that miR‐1285‐5p may act as a tumor suppressor.
Figure 3.
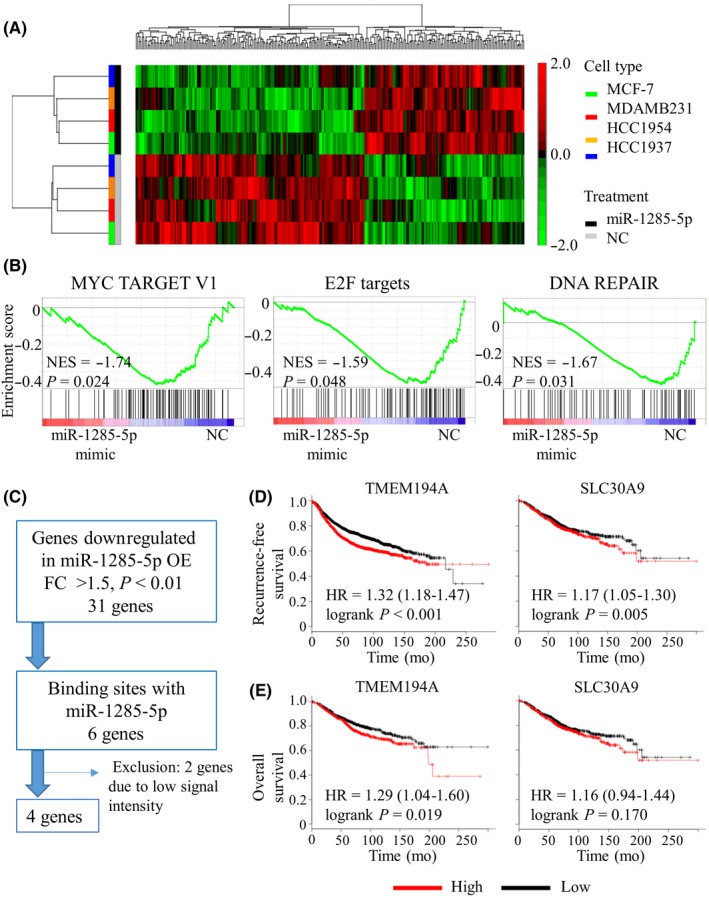
In silico analysis of miR‐1285‐5p targets. A, Heat map diagram with two‐way hierarchical clustering using 260 genes whose expression levels differed by >1.5‐fold (P > 0.05) with overexpression of miR‐1285‐5p vs negative control (NC). Each row represents a gene and each column represents breast cancer cell samples transfected with either miR‐1285‐5p mimic (black) or NC mimic (grey). The cancer cell lines are colored as follows: green for MCF‐7, red for MDA‐MB‐231, orange for HCC1937, and blue for HCC1954. The color scale on the right illustrates the relative expression level of each gene across all samples: red and green are expression levels above and below the mean level, respectively. B, Significantly enriched gene sets using the GSEA of four cancer cell lines transfected with mimic (miR‐1285‐5p/NC). NES, normalized enrichment score. C, Flow diagram showing the selection of target genes of miR‐1285‐5p. D, Kaplan‐Meier plots of recurrence‐free survival according to gene expression level (high/low) that were split by the median value (TMEM194A; P < 0.001 and SLC30A9; P = 0.005). E, Kaplan‐Meier plots of overall survival according to gene expression (high/low) that were split by the median value (TMEM194A; P = 0.019 and SLC30A9; P = 0.170). HR, hazard ratio
Table 1.
Gene set enrichment analysis (GSEA) after miR‐1285‐5p overexpression: (A) downregulated gene sets due to the overexpression of miR‐1285‐5p and (B) upregulated gene sets due to the overexpression of miR‐1285‐5p
| (A) | ||||
|---|---|---|---|---|
| Name | Size | NES | NOM p value | FDR q value |
| MYC Targets V1 | 91 | −1.74 | 0.024 | 0.049 |
| DNA repair | 70 | −1.67 | 0.031 | 0.097 |
| Adipogenesis | 82 | −1.30 | 0.032 | 0.445 |
| Fatty acid metabolism | 67 | −1.39 | 0.045 | 0.308 |
| E2F targets | 95 | −1.59 | 0.048 | 0.139 |
| (B) | ||||
|---|---|---|---|---|
| Name | Size | NES | NOM p value | FDR q value |
| Myogenesis | 91 | 1.24 | 0.040 | 1.000 |
FDR, false discovery rat; NES, normalized enrichment score; NOM, Nominal.
The microarray analysis showed that 23 and 31 genes were upregulated and downregulated, respectively, upon overexpression of miR‐1285‐5p (fold change >1.5 relative to NC, P < 0.01; Table S2). We narrowed down the putative targets of miR‐1285‐5p (Figure 3C). We used a computational algorithm (TargetScan) to identify putative miR‐1285‐5p binding sites28 and found four possible targets: ubiquitin protein ligase E3C (UBE3C), TMEM194A, eukaryotic translation initiation factor 1A X‐linked (EIF1AX) and solute carrier family 30 member 9 (SLC30A9).
To evaluate the interaction between these mRNA and miR‐1285‐5p, we assessed their clinical relevance in breast cancer using a public database. Recurrence‐free survival (RFS) and overall survival were determined using the Kaplan‐Meier plotter.29 Survival curves were analyzed according to the gene expression levels (high/low) of the candidate genes (UBE3C, TMEM194A, EIF1AX and SLC30A9). We found that high expression of SLC30A9 and TMEM194A was significantly associated with poor prognosis (Figure 3D). While there was no correlation between SLC30A9 expression and overall survival, higher expression of TMEM194A was significantly associated with poor overall survival (Figure 3E). These results suggested that two potential targets of miR‐1285‐5p (TMEM194A and SLC30A9) might be related to breast cancer development and recurrence.
3.4. miR‐1285‐5p negatively regulates TMEM194A expression
Next, we examined whether TMEM194A and SLC30A9 were directly regulated by miR‐1285‐5p. Whereas overexpression of miR‐1285‐5p decreased the mRNA levels of TMEM194A and SLC30A9 in all cancer cell lines (MCF‐7, MDA‐MB‐231, HCC1937 and HCC1954) (Figure 4A), immunoblots showed that overexpression of miR‐1285‐5p only inhibited TMEM194A protein levels (Figure 4B). We evaluated whether miR‐1285‐5p regulated TMEM194A or SLC30A by binding to their 3′‐UTR using luciferase reporter assays. miR‐1285‐5p has one and two putative biding sites in the 3′‐UTR of TMEM194A and SLC30A9, respectively (Figure 4C). Luciferase reporter assays showed that miR‐1285‐5p significantly decreased the luciferase activity of the wild‐type TMEM194A‐3′‐UTR and SLC30A‐3′‐UTR plasmids (Figure 4D), while mutation of the predicted binding sites within the 3′‐UTR of both TMEM194A and SLC30A9 abolished the inhibitory effect of miR‐1285‐5p on the luciferase activity (Figure 4D). These data indicate that, by binding to the 3′‐UTR of TMEM194A and SLC30A9, miR‐1285‐5p regulates their expression.
Figure 4.
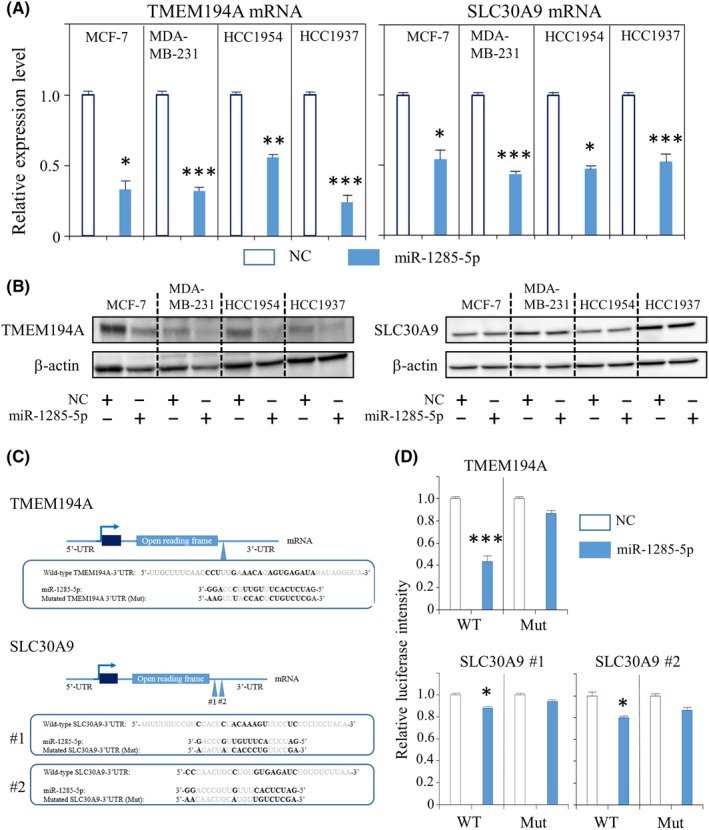
Experimental validation for the interaction between miR‐1285‐5p and TMEM194A. A, The qPCR analysis of TMEM194A and SLC30A9 upon overexpression of miR‐1285‐5p. Expression of mRNA was normalized to that of GAPDH. The data are mean ± SE of three independent experiments. B, Representative immunoblots for TMEM194A and SLC30A9 upon overexpression of miR‐1285‐5p. C, Wild‐type and mutated type of putative miR‐1285‐5p target sequences of 3′‐UTR of TMEM194A and SLC30A9. Bold font indicates putative miR‐1285‐5p‐binding sequences. D, The luciferase reporter assay in HEK293T cells co–transfected with miRNA mimics (miR‐1285‐5p/NC) and either wild‐type or mutated type luciferase reporter plasmid. The data are mean ± SE of three measurements. Mut, mutated type; WT, Wild‐type. *P < 0.05, **P < 0.01, ***P < 0.001
We investigated whether inhibition of TMEM194A and SLC30A9 could mimic the growth inhibitory effect of miR‐1285‐5p in breast cancer cells. For this purpose, we analyzed cell proliferation after knockdown of TMEM194A and SLC30A9 using siRNA. qPCR analysis showed that the expression of both TMEM194A and SLC30A9 was downregulated using two different siRNA for each gene (Figure 5A and B). Remarkably, TMEM194A knockdown significantly inhibited cell growth (Figure 5C). The cell proliferation inhibition rates of each siRNA were as follows: MCF‐7, 73.8% and 80.4% (P < 0.001 and <.001); MDA‐MB‐231, 80.7% and 64.7% (P < 0.001 and <.001); HCC1937, 87.0% and 71.0% (P < 0.001 and <.001); and HCC1954, 79.1% and 77.1% (P = 0.001 and <.001). Conversely, SLC30A9 inhibition had no effect (Figure 5D).
Figure 5.
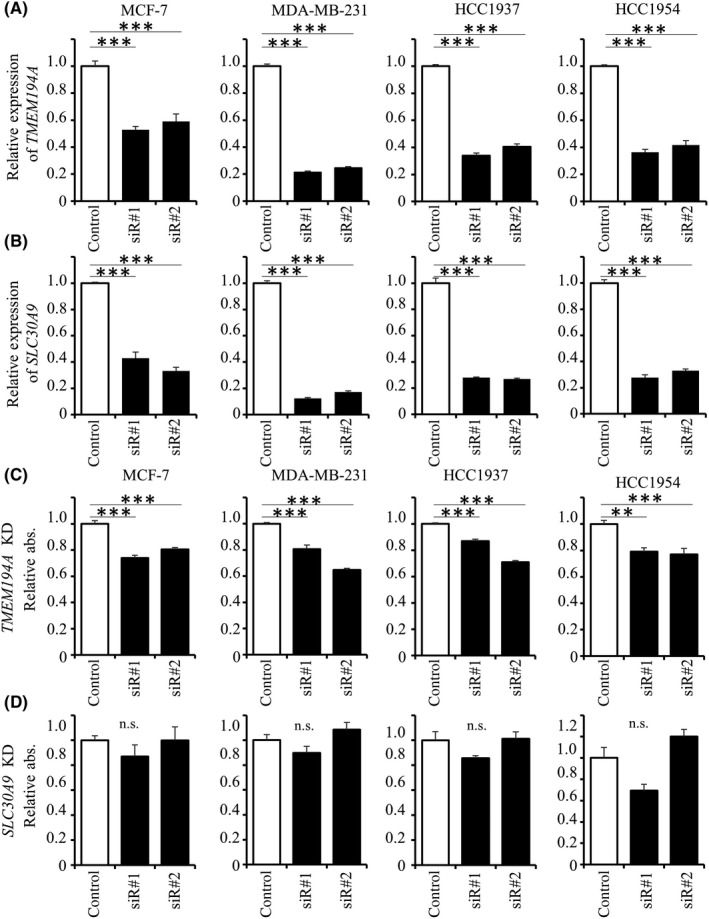
Inhibition of cell growth by silencing of TMEM194A. A and B, Knockdown efficacy of two different siRNA for TMEM194A and SLC30A9 analyzed by qPCR analysis. Expression of mRNA was normalized to that of GAPDH. The data are mean ± SE of three independent experiments. C and D, Effects of TMEM194A or SLC30A9 knockdown on cell proliferation. The data are mean ± SE of three independent experiments. Relative abs, Relative absorbance.*P < 0.05, **P < 0.01, ***P < 0.001
Liu et al (2019) reported that TMEM194A is responsible for tumorigenesis and is essential for tamoxifen resistance in breast cancer cells.30 Consequently, we attempted to confirm the oncogenic activity of TMEM194A by inducing its expression in MCF‐7 cells. We observed that TMEM194A overexpression was associated with considerable augmentation of cell proliferation (Figure 6), which strongly supported the oncogenic role of this gene, at least in breast cancer cells.
Figure 6.
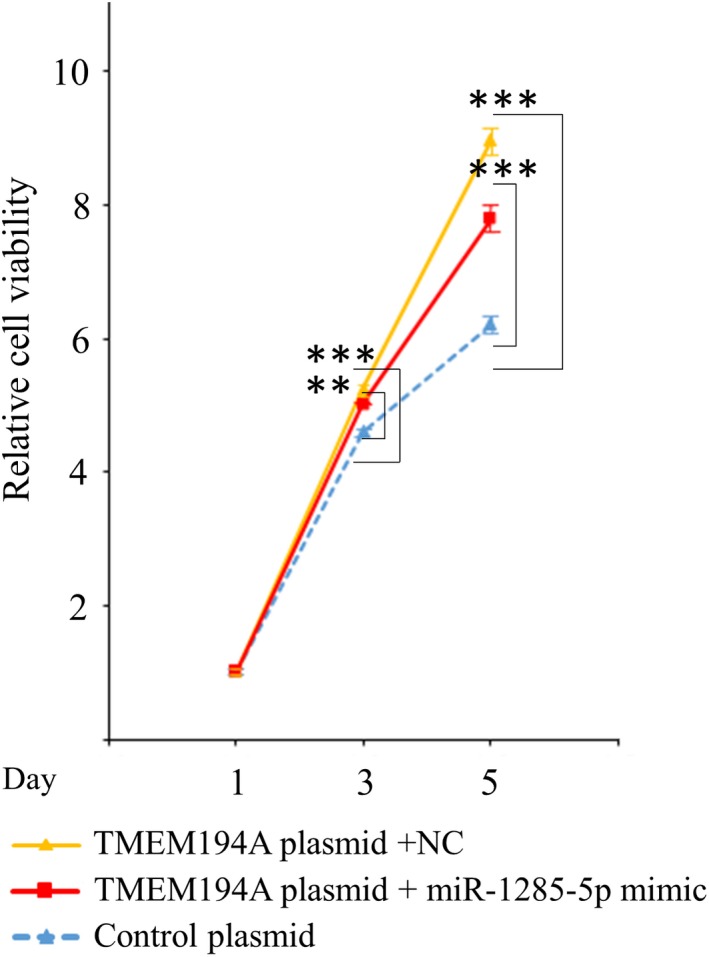
Promotion of cell growth by the overexpression of TMEM194A. Assessment of miR‐1285 mimic effect on cell growth. Colored lines represent each co–transfected MCF‐7 cells as follows: blue for Cont plasmid, red for TMEM194A plasmid + miR‐1285‐5p, and yellow for TMEM194A plasmid + NC, respectively. **P < 0.01, ***P < 0.001
Liu et al (2019) reported that TMEM194A is responsible for tumorigenesis and is essential for tamoxifen resistance in breast cancer cells.30 Consequently, we attempted to confirm the oncogenic activity of TMEM194A by inducing its expression in MCF‐7 cells. We observed that TMEM194A overexpression was associated with considerable augmentation of cell proliferation (Figure 6), which strongly supported the oncogenic role of this gene, at least in breast cancer cells.
3.5. TMEM194A functions in separation of centrosomes from the nuclear envelope
TMEM194A is a component of the nuclear envelope (NE). To examine whether there was a connection between TMEM194A and the cytoplasmic mechanical systems, we measured the distance between the NE and centrosomes after silencing of TMEM194A. Immunofluorescence analysis showed that knockdown of TMEM194A caused separation of the centrosomes from the NE (Figure 7A). This observation was consistent in all cancer cell lines (MCF‐7, MDA‐MB‐231, HCC1937 and HCC1954), which argued for a functional connection between TMEM194A and the cytoskeleton. Next, we tested whether this phenotypical change was observed upon overexpression of miR‐1285‐5p. Comparably, miR‐1285‐5p overexpression was associated with centrosome separation (Figure 7B). Finally, we performed immunostaining of pericentrin to confirm the implication of miR‐1285‐5p and TMEM194A in centrosome formation because pericentrin, one of the components of centrosomes, cooperates with dynein for centrosome assembly and mitotic spindle pole formation (Figure S2).
Figure 7.
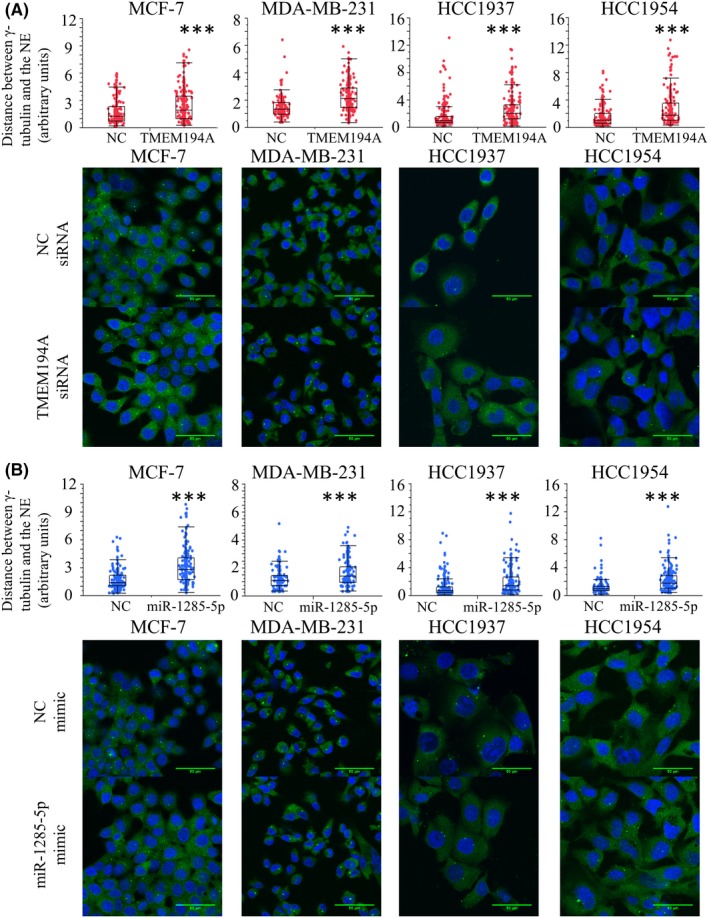
Separation of centrosomes from the nuclear envelope by TMEM194A inhibition. The distance between centrosomes and nuclear envelope (NE), confirmed using immunofluorescence (IF) of ɤ‐tubulin and Hochest33258. Measurement of the distance after either silencing TMEM194A expression (A) or overexpressing miR‐1285‐5p (B). The images were taken using the same scale. IF are indicated as follows: blue for Hochest33258 and green for ɤ‐tubulin. ***P < 0.001
4. DISCUSSION
In this study, we revealed a novel mechanism through which miR‐1285‐5p is involved in cell growth suppression by directly targeting TMEM194A in breast cancer. TMEM194A is expressed ubiquitously and is also called nuclear envelope integral membrane protein 1 (Nemp1). In the nucleus, many proteins in the lamina and its bound NE transmembrane proteins (NET) bind chromatin adjacent to the NE, and some of the NET are involved in the regulation of gene expression and genome stability.31 The NE is a protective barrier for the genome against toxic agents and can affect gene expression through regulation of nuclear pore complexes, which direct the nuclear/cytoplasmic trafficking of proteins.32 In addition, the NE contributes to proper positioning of the nucleus through cytoplasmic mechanical systems, which direct its movement during processes such as cell migration and invasion, essential for the dissemination of cancer cells.33, 34 As a component of the cytoplasmic mechanical systems, centrosomes also contribute to cell polarity and motility.35
However, few studies have investigated TMEM194A function in this regard. Mamada and colleagues have demonstrated the involvement of TMEM194A in the neural development of Xenopus laevis.36 The same group confirmed that TMEM194A localized at the nuclear periphery and reported TMEM194A as a new type of RanGTP‐binding protein.37 These studies demonstrated that TMEM194A regulates gene expression and support our data indicating that the inhibitory effect on proliferation upon overexpression of miR‐1285‐5p might be mediated by TMEM194A inhibition. Liu et al (2019) suggested involvement of TMEM194A for tamoxifen resistance in breast cancer.30 In line with their study, our data indicated oncogenic roles of TMEM194A in MCF‐7 cells (Figure 6). In addition, we speculate that TMEM194A may function as a component of the mechanical system that connects the nucleus with the cytoskeleton. Previously, Buch and colleagues performed similar experiments using a different NET, spindle‐associated membrane protein 1 (Samp1), and silencing of Samp1 expression caused the separation of centrosomes from the NE in HeLa cells.38 In addition, it has been reported that deficiency of either emerin or lamin A/C results in detachment of centrosomes from the NE.39, 40 Centrosomes have a critical function in cell division to separate chromosomes accurately.34, 35 Unusual positioning of centrosomes may cause aneuploidy in cancer cells. However, the consequence of the detachment of centrosomes in this study remains unclear. In addition, NE plays a role in cancer biology, and failure to dissemble the NE could result in increase of aneuploidy and lagging chromosome.31 Although the consequences of unusual positioning of centrosomes remain unclear, dysregulation of TMEM194A role in nuclear positioning may contribute to both tumorigenesis and tumor aggressiveness.
We showed the interaction between miR‐1285‐5p and TMEM194A using several breast cancer cell lines. However, we could not confirm the correlation between miR‐1285‐5p and TMEM194A expression in clinical samples due to the poor quality of the FFPE samples, which had been stored for a long time. In addition, we do not know whether the interaction is specific to young women. In this study, we showed higher expression of miR‐1285‐5p in normal tissues compared with tumor tissues (Figure 1A, P = 0.010). Analysis of a publicly available database (Oncomine Platform41) shows higher expression of TMEM194A in breast tumor tissues compared with normal tissues (Figure S3, P = 0.031). These data indicate the inverse correlation between miR‐1285‐5p and TMEM194A and, together with our findings, suggest that TMEM194A plays an oncogenic role, regardless of age. We also identified SLC30A9 as a candidate target of miR‐1285‐5p and demonstrated their direct interaction in luciferase reporter assays, although the inhibitory effect of miR‐1285‐5p on SLC30A9 expression was relatively low. Chandler and colleagues examined the expression of zinc transporters in several breast cancer cell lines by qPCR and immunoblotting, and showed that a change in the mRNA expression of zinc transporters is not always paralleled by a change in their protein levels.42 We believe that a similar phenomenon occurs in the case of SLC30A9. Furthermore, SLC30A9 is a nuclear receptor coactivator,43, 44, 45, 46 also known as human embryonic lung protein (HUEL) and GRIP1‐associates coactivator 63 (GAC63). The members of the SLC30A family are characterized by six trans‐membrane domains and are important in the export of zinc.47 However, it has not been elucidated whether SLC30A9 functions as a zinc transporter. Through a transfection experiment in HEK293 cells, Perez et al (2017) demonstrated that mutant SLC30A9 show lower zinc concentration compared with wild‐type SLC30A9, suggesting that SLC30A9 might act as a zinc transporter.48 Breast tumors accumulate abnormally high levels of zinc, which might result in cytotoxicity.49, 50 Thus, it may be interesting to elucidate the involvement of SLC30A9 in zinc homeostasis in breast cancer.
In summary, we showed that miR‐1285‐5p regulates TMEM194A expression by binding to its 3′‐UTR. miRNA offer great promise for developing new diagnostic markers. However, the elucidation of the functional roles of individual miRNA is necessary for the development of their clinical application. We believe that the findings of the present study deepen our understanding of breast cancer progression and facilitate the development of novel therapeutic strategies.
DISCLOSURE
The authors have no conflict of interest to declare.
Supporting information
ACKNOWLEDGMENTS
This study was financially supported by the Japan Agency for Medical Research and Development (AMED; P‐CREATE, 17cm0106217h0002). The authors thank Ayako Inoue for technical support.
Hironaka‐Mitsuhashi A, Otsuka K, Gailhouste L, et al. MiR‐1285‐5p/TMEM194A axis affects cell proliferation in breast cancer. Cancer Sci. 2020;111:395–405. 10.1111/cas.14287
REFERENCES
- 1. Bray F, Ferlay J, Soerjomataram I, et al. Global cancer statistics 2018: GLOBOCAN estimates of incidence and mortality worldwide for 36 cancers in 185 countries. CA Cancer J Clin. 2018;68:394‐424. [DOI] [PubMed] [Google Scholar]
- 2. Dvinge H, Git A, Graf S, et al. The shaping and functional consequences of the microRNA landscape in breast cancer. Nature. 2013;497:378‐382. [DOI] [PubMed] [Google Scholar]
- 3. Yates LR, Gerstung M, Knappskog S, et al. Subclonal diversification of primary breast cancer revealed by multiregion sequencing. Nat Med. 2015;21:751‐759. [DOI] [PMC free article] [PubMed] [Google Scholar]
- 4. Sørlie T, Perou CM, Tibshirani R, et al. Gene expression patterns of breast carcinomas distinguish tumor subclasses with clinical implications. Proc Natl Acad Sci USA. 2001;98:10869‐10874. [DOI] [PMC free article] [PubMed] [Google Scholar]
- 5. Curigliano G, Burstein HJ, Winer EP, et al. De‐escalating and escalating treatments for early‐stage breast cancer: the St. Gallen International Expert Consensus Conference on the Primary Therapy of Early Breast Cancer 2017. Ann Oncol. 2018;29:2153. [DOI] [PMC free article] [PubMed] [Google Scholar]
- 6. Anders CK, Hsu DS, Broadwater G, et al. Young age at diagnosis correlates with worse prognosis and defines a subset of breast cancers with shared patterns of gene expression. J Clin Oncol. 2008;26:3324‐3330. [DOI] [PubMed] [Google Scholar]
- 7. Hironaka‐Mitsuhashi A, Tsuda H, Yoshida M, et al. Invasive breast cancers in adolescent and young adult women show more aggressive immunohistochemical and clinical features than those in women aged 40–44 years. Breast Cancer. 2019;26:386‐396. [DOI] [PubMed] [Google Scholar]
- 8. Ruddy KJ, Gelber S, Tamimi RM, et al. Breast cancer presentation and diagnostic delays in young women. Cancer. 2014;120:20‐25. [DOI] [PubMed] [Google Scholar]
- 9. Ribnikar D, Ribeiro JM, Pinto D, et al. Breast cancer under age 40: a different approach. Curr Treat Options Oncol. 2015;16:16. [DOI] [PubMed] [Google Scholar]
- 10. Francis PA, Pagani O, Felming GF, et al. Tailoring adjuvant endocrine therapy for premenopausal breast cancer. N Engl J Med. 2018;379:122‐137. [DOI] [PMC free article] [PubMed] [Google Scholar]
- 11. Calin GA, Croce CM. MicroRNA signatures in human cancers. Nat Rev Cancer. 2006;6:857‐866. [DOI] [PubMed] [Google Scholar]
- 12. Guo H, Ingolia NT, Weissman JS, et al. Mammalian microRNAs predominantly act to decrease target mRNA levels. Nature. 2010;466:835‐840. [DOI] [PMC free article] [PubMed] [Google Scholar]
- 13. Si ML, Zhu S, Wu H, et al. miR‐21‐mediated tumor growth. Oncogene. 2007;26:2799‐2803. [DOI] [PubMed] [Google Scholar]
- 14. Jiang S, Zhang HW, Lu MH, et al. MicroRNA‐155 functions as an OncomiR in breast cancer by targeting the suppressor of cytokine signaling 1 gene. Cancer Res. 2010;70(8):3119‐3127. [DOI] [PubMed] [Google Scholar]
- 15. Gregory PA, Bert AG, Paterson EL, et al. The miR‐200 family and miR‐205 regulate epithelial to mesenchymal transition by targeting ZEB1 and SIP1. Nat Cell Biol. 2008;10:593‐601. [DOI] [PubMed] [Google Scholar]
- 16. Huo D, Clayton WM, Yoshimatsu TF, Chen J, Olopade OI. Identification of a circulating microRNA signature to distinguish recurrence in breast cancer patients. Oncotarget. 2016;7:55231‐55248. [DOI] [PMC free article] [PubMed] [Google Scholar]
- 17. Shimomura A, Shiino S, Kawauchi J, et al. Novel combination of serum microRNA for detecting breast cancer in the early stage. Cancer Sci. 2016;107:326‐334. [DOI] [PMC free article] [PubMed] [Google Scholar]
- 18. Hironaka‐Mitsuhashi A, Matsuzaki J, Takahashi RU, et al. A tissue microRNA signature that predicts the prognosis of breast cancer in young women. PLoS ONE. 2017;12:e0187638. [DOI] [PMC free article] [PubMed] [Google Scholar]
- 19. Morin RD, O'Connor MD, Griffith M, et al. Application of massively parallel sequencing to microRNA profiling and discovery in human embryonic stem cells. Genome Res. 2008;18:610‐621. [DOI] [PMC free article] [PubMed] [Google Scholar]
- 20. Tian S, Huang S, Wu S, et al. MicroRNA‐1285 inhibits the expression of p53 by directly targeting its 3' untranslated region. Biochem Biophys Res Commun. 2010;396:435‐439. [DOI] [PubMed] [Google Scholar]
- 21. Niemoeller OM, Niyazi M, Corradini S, et al. MicroRNA expression profiles in human cancer cells after ionizing radiation. Radiat Oncol. 2011;6:29. [DOI] [PMC free article] [PubMed] [Google Scholar]
- 22. Borrelli N, Denaro M, Ugolini C, et al. miRNA expression profiling of ‘noninvasive follicular thyroid neoplasms with papillary‐like nuclear features' compared with adenomas and infiltrative follicular variants of papillary thyroid carcinomas. Mod Pathol. 2017;30:39‐51. [DOI] [PubMed] [Google Scholar]
- 23. Zhou S, Zhang Z, Zheng P, et al. MicroRNA‐1285‐5p influences the proliferation and metastasis of non–small‐cell lung carcinoma cells via downregulating CDH1 and Smad4. Tumour Biol. 2017;39:1010428317705513. [DOI] [PubMed] [Google Scholar]
- 24. Hidaka H, Seki N, Yoshino H, et al. Tumor suppressive microRNA‐1285 regulates novel molecular targets: aberrant expression and functional significance in renal cell carcinoma. Oncotarget. 2012;3:44‐57. [DOI] [PMC free article] [PubMed] [Google Scholar]
- 25. Subramanian A, Tamayo P, Mootha VK, et al. Gene set enrichment analysis: a knowledge‐based approach for interpreting genome‐wide expression profiles. Proc Natl Acad Sci USA. 2005;102:15545‐15550. [DOI] [PMC free article] [PubMed] [Google Scholar]
- 26. Dang CV. MYC on the path to cancer. Cell. 2012;149:22‐35. [DOI] [PMC free article] [PubMed] [Google Scholar]
- 27. Polager S, Ginsberg D. E2F ‐ at the crossroads of life and death. Trends Cell Biol. 2008;18:528‐535. [DOI] [PubMed] [Google Scholar]
- 28. Lewis BP, Burge CB, Bartel DP. Conserved seed pairing, often flanked by adenosines, indicates that thousands of human genes are microRNA targets. Cell. 2005;120:15‐20. [DOI] [PubMed] [Google Scholar]
- 29. Lánczky A, Nagy Á, Bottai G, et al. miRpower: a web‐tool to validate survival‐associated miRNAs utilizing expression data from 2178 breast cancer patients. Breast Cancer Res Treat. 2016;160:439‐446. [DOI] [PubMed] [Google Scholar]
- 30. Liu Y, Tong C, Cao J, et al. NEMP1 promotes tamoxifen resistance in breast cancer cells. Biochem Genet. 2019;57:813‐826. [DOI] [PubMed] [Google Scholar]
- 31. de Las Heras JI, Batrakou DG, Schirmer EC. Cancer biology and the nuclear envelope: a convoluted relationship. Semin Cancer Biol. 2013;23:125‐137. [DOI] [PubMed] [Google Scholar]
- 32. Capelson M, Liang Y, Schulte R, et al. Chromatin‐bound nuclear pore components regulate gene expression in higher eukaryotes. Cell. 2010;140:372‐383. [DOI] [PMC free article] [PubMed] [Google Scholar]
- 33. Gundersen GG, Worman HJ. Nuclear positioning. Cell. 2013;152:1376‐1389. [DOI] [PMC free article] [PubMed] [Google Scholar]
- 34. Lele TP, Dickinson RB, Gundersen GG. Mechanical principles of nuclear shaping and positioning. J Cell Biol. 2018;217:3330‐3342. [DOI] [PMC free article] [PubMed] [Google Scholar]
- 35. Nano M, Basto R. The Janus soul of centrosomes: a paradoxical role in disease? Chromosome Res. 2016;24:127‐144. [DOI] [PubMed] [Google Scholar]
- 36. Mamada H, Takahashi N, Taira M. Involvement of an inner nuclear membrane protein, Nemp1, in Xenopus neural development through an interaction with the chromatin protein BAF. Dev Biol. 2009;327:497‐507. [DOI] [PubMed] [Google Scholar]
- 37. Shibano T, Mamada H, Hakuno F, et al. The inner nuclear membrane protein nemp1 is a new type of RanGTP‐binding protein in eukaryotes. PLoS ONE. 2015;10:e0127271. [DOI] [PMC free article] [PubMed] [Google Scholar]
- 38. Buch C, Lindberg R, Figueroa R, et al. An integral protein of the inner nuclear membrane localizes to the mitotic spindle in mammalian cells. J Cell Sci. 2009;122:2100‐2107. [DOI] [PubMed] [Google Scholar]
- 39. Salpingidou G, Smertenko A, Hausmanowa‐Petrucewicz I, et al. A novel role for the nuclear membrane protein emerin in association of the centrosome to the outer nuclear membrane. J Cell Biol. 2007;178:897‐904. [DOI] [PMC free article] [PubMed] [Google Scholar]
- 40. Lee JS, Hale CM, Panorchan P, et al. Nuclear lamin A/C deficiency induces defects in cell mechanics, polarization, and migration. Biophys J. 2007;93:2542‐2552. [DOI] [PMC free article] [PubMed] [Google Scholar]
- 41. Rhodes DR, Yu J, Shanker K, et al. ONCOMINE: a cancer microarray database and integrated data‐mining platform. Neoplasia. 2004;6:1‐6. [DOI] [PMC free article] [PubMed] [Google Scholar]
- 42. Chandler P, Kochupurakkal BS, Alam S, et al. Subtype‐specific accumulation of intracellular zinc pools is associated with the malignant phenotype in breast cancer. Mol Cancer. 2016;15:2. [DOI] [PMC free article] [PubMed] [Google Scholar]
- 43. Chen YH, Yang CK, Xia M, et al. Role of GAC63 in transcriptional activation mediated by beta‐catenin. Nucleic Acids Res. 2007;35:2084‐2092. [DOI] [PMC free article] [PubMed] [Google Scholar]
- 44. Chen YH, Beischlag TV, Kim JH, et al. Role of GAC63 in transcriptional activation mediated by the aryl hydrocarbon receptor. J Biol Chem. 2006;281:12242‐12247. [DOI] [PMC free article] [PubMed] [Google Scholar]
- 45. Chen YH, Kim JH, Stallcup MR. GAC63, a GRIP1‐dependent nuclear receptor coactivator. Mol Cell Biol. 2005;25:5965‐5972. [DOI] [PMC free article] [PubMed] [Google Scholar]
- 46. Sim DL, Yeo WM, Chow VT. The novel human HUEL (C4orf1) protein shares homology with the DNA‐binding domain of the XPA DNA repair protein and displays nuclear translocation in a cell cycle‐dependent manner. Int J Biochem Cell Biol. 2002;34:487‐504. [DOI] [PubMed] [Google Scholar]
- 47. Palmiter RD, Huang L. Efflux and compartmentalization of zinc by members of the SLC30 family of solute carriers. Pflugers Arch. 2004;447:744‐751. [DOI] [PubMed] [Google Scholar]
- 48. Perez Y, Shorer Z, Liani‐Leibson K, et al. SLC30A9 mutation affecting intracellular zinc homeostasis causes a novel cerebro‐renal syndrome. Brain. 2017;140:928‐939. [DOI] [PMC free article] [PubMed] [Google Scholar]
- 49. Margalioth EJ, Schenker JG, Chevion M. Copper and zinc levels in normal and malignant tissues. Cancer. 1983;52:868‐872. [DOI] [PubMed] [Google Scholar]
- 50. Cui Y, Vogt S, Olson N, et al. Levels of zinc, selenium, calcium, and iron in benign breast tissue and risk of subsequent breast cancer. Cancer Epidemiol Biomarkers Prev. 2007;16:1682‐1685. [DOI] [PubMed] [Google Scholar]
Associated Data
This section collects any data citations, data availability statements, or supplementary materials included in this article.
Supplementary Materials


