Abstract
Aberrant activation of NRF2 is as a critical prognostic factor that drives the malignant progression of various cancers. Cancer cells with persistent NRF2 activation heavily rely on NRF2 activity for therapeutic resistance and aggressive tumorigenic capacity. To clarify the metabolic features of NRF2‐activated lung cancers, we conducted targeted metabolomic (T‐Met) and global metabolomic (G‐Met) analyses of non–small‐cell lung cancer (NSCLC) cell lines in combination with exome and transcriptome analyses. Exome analysis of 88 cell lines (49 adenocarcinoma, 14 large cell carcinoma, 15 squamous cell carcinoma and 10 others) identified non–synonymous mutations in the KEAP1, NRF2 and CUL3 genes. Judging from the elevated expression of NRF2 target genes, these mutations are expected to result in the constitutive stabilization of NRF2. Out of the 88 cell lines, 52 NSCLC cell lines (29 adenocarcinoma, 10 large cell carcinoma, 9 squamous cell carcinoma and 4 others) were subjected to T‐Met analysis. Classification of the 52 cell lines into three groups according to the NRF2 target gene expression enabled us to draw typical metabolomic signatures induced by NRF2 activation. From the 52 cell lines, 18 NSCLC cell lines (14 adenocarcinoma, 2 large cell carcinoma, 1 squamous cell carcinoma and 1 others) were further chosen for G‐Met and detailed transcriptome analyses. G‐Met analysis of their culture supernatants revealed novel metabolites associated with NRF2 activity, which may be potential diagnostic biomarkers of NRF2 activation. This study also provides useful information for the exploration of new metabolic nodes for selective toxicity towards NRF2‐activated NSCLC.
Keywords: culture supernatant, metabolites, metabolome, non–small‐cell lung cancer, NRF2
This study examined impacts of NRF2 activation in NSCLC cell lines on their extracellular metabolites.
1. INTRODUCTION
Cancer cells have elevated nutrient demands and exploit an altered metabolism for aggressive proliferation and survival. The unique metabolic activities of cancer cells confer cell‐autonomous advantages, enabling efficient energy production and the incorporation of nutrients into the biomass and increasing antioxidant and detoxification capacities.1 In addition, recent studies have revealed that the altered metabolism in cancer cells modulates the tumor microenvironment.2, 3 Metabolic competition between cancer cells and T lymphocytes is one of the explanations for how cancer cells evade anti–tumor immunity.4 Metabolic instruction of tumor‐associated macrophages by cancer cells is another explanation for the immune evasion of cancer cells.5 Based on these points of view, nutrients and metabolites are regarded as signaling molecules for intercellular communications between cancer cells and their microenvironments.
The KEAP1‐NRF2 system is a major inducible defense mechanism against redox disturbance.6 NRF2 is a potent transcription activator regulating a battery of cytoprotective genes. KEAP1 is a negative regulator of NRF2, forming a ubiquitin E3 ligase with CUL3, and the KEAP1‐CUL3 complex ubiquitinates NRF2 for degradation under non–stressful conditions. Exposure to reactive oxygen species and/or electrophiles causes a direct modification to the KEAP1 cysteine residues, resulting in the decline in the ubiquitin E3 ligase activity of the KEAP1‐CUL3 complex and the stabilization of NRF2. Adequate activation of NRF2 is beneficial for human health by preventing and alleviating various pathological conditions. In contrast to the positive impacts of the NRF2 function, cancer cells often hijack the KEAP1‐NRF2 system. NRF2 is aberrantly activated in cancer cells due to various causes, including somatic mutations in the KEAP1 and NRF2 (NFE2L2) genes, and confers growth and survival advantages on cancer cells. Multiple lines of evidence suggest that aberrantly activated NRF2 in cancer cells drives their malignant progression and that the cancer cells consequently develop “NRF2 addiction.”7 NRF2‐mediated activation of cytoprotective genes explains the therapeutic resistance of NRF2‐addicted cancer cells. In addition, in proliferating cells, NRF2 redirects glucose and glutamine into anabolic pathways by activating metabolic genes, which further accelerates the proliferation of cancer cells.8
We recently found that, under the influence of the microenvironment, NRF2 strongly promotes tumorigenesis by inducing cytokines and prostaglandin‐metabolizing enzymes and possibly by helping cancer cells evade anti–tumor immunity.9 These results suggest the presence of some kind of communication between cancer cells and their microenvironments, which can be direct cell‐cell interactions, humoral factors, such as peptides, cytokines and chemokines, exosomes and other extracellular vesicles. In this study, we chose to analyze the nutrients and metabolites that act as signaling molecules for cancer cells to communicate with their microenvironments, characterizing the metabolic signatures of the inside and outside of NRF2‐addicted cancer cells in comparison with those of NRF2‐normal cancer cells.
We collected 88 cell lines of non–small‐cell lung cancers (NSCLC) (49 adenocarcinoma, 14 large cell carcinoma, 15 squamous cell carcinoma and 10 others) and conducted an exome analysis to clarify their mutation profiles. The transcriptome data obtained from a public database, Cancer Cell Line Encyclopedia, were used to evaluate the activation status of the NRF2 pathway in each cell line. Based on the comparison of mutation profiles and NRF2 activation status, the NSCLC cell lines were classified into three groups: NRF2‐high, NRF2‐middle and NRF2‐low cell lines. Targeted metabolomics (T‐Met) analysis was conducted for the cell lysates and culture supernatants of representative 52 cell lines (29 adenocarcinoma, 10 large cell carcinoma, 9 squamous cell carcinoma and 4 others) out of the 88 cell lines, and global metabolomic (G‐Met) analysis was conducted for the culture supernatants of 18 cell lines (14 adenocarcinoma, 2 large cell carcinoma, 1 squamous cell carcinoma and 1 other) out of the 52 cell lines used for the T‐Met analysis. The differentially produced metabolites detected in the G‐Met analysis were associated with the transcripts of metabolism‐related genes using our in‐house transcriptome data, which was obtained from the 18 cell lines, to obtain a clue to understanding the biological roles of the metabolites. The present study provides comprehensive and elaborate information on the metabolic features of NRF2‐activated NSCLC cells, some of which may be interpreted as biomarkers for evaluating the NRF2 activation status in normal tissues.
2. MATERIALS AND METHODS
2.1. Cell culture
Cell lines were obtained from the ATCC, the Japanese Collection of Research Bioresources (JCRB) Cell Bank, the European Collection of Cell Cultures (ECACC), the German Collection of Microorganisms and Cell Cultures (DSMZ) and RIKEN BioResource Research Center. Cell line information is listed in Table S1.
All NSCLC cell lines were cultured in RPMI 1640 medium supplemented with 10% FBS with penicillin/streptomycin under 5.0% CO2 at 37°C. For metabolome analysis, the same number of cells were seeded in six 6‐cm dishes. Three dishes were used for cell number count at 24, 48 and 72 hours after seeding, and the area under the curve (AUC) value of the cell numbers during the 72 hours of culture was calculated for each cell line and used for the normalization of metabolites in the culture supernatant. The remaining three dishes were used for sample preparation. Culture supernatants (500 µL) were collected in 2D barcode storage tubes (Thermo Fisher Scientific) and kept at −80°C until analysis. Cell lysates were prepared by methanol extraction. The cell number at 72 hours after observation was used for the normalization of metabolites in the cell lysate. DNA was purified using DNeasy Blood & Tissue (Cat. 69504, QIAGEN). RNA was purified using ISOGEN (Nippon Gene) following a standard protocol provided by the manufacturer.
2.2. Selection of representative NRF2 target genes for classification of non–small‐cell lung cancer cell lines
NRF2‐dependent transcriptome and NRF2‐dependent enhancers (ie NRF2‐dependent deposition of acetylated histone H3K27) were identified by RNA‐seq analysis and ChIP‐seq analysis using several KEAP1‐mutant NSCLC cell lines treated with or without NRF2 siRNA (to be published elsewhere). Among the genes that are commonly activated in an NRF2‐dependent manner in all the KEAP1‐mutant NSCLC cell lines, we selected those accompanied by NRF2‐dependent enhancers. The representative NRF2 target genes were further narrowed down to 15 genes based on their involvement in redox regulation, iron regulation, glutathione synthesis and pentose phosphate pathway, which are four major activities of NRF2 in NSCLC cells.
The 4 genes were selected out of the 15 genes based on the number of publications in combination with NRF2 using PubMed database. NQO1, GCLC, GCLM and SLC7A11 (a gene encoding a subunit of cystine transporter xCT) are the most well‐analyzed genes in combination with NRF2 function.
Whole‐exome sequencing of 88 NSCLC cell lines
RNA‐seq analysis of 18 NSCLC cell lines
T‐Met analysis of lysates and culture supernatants of 52 NSCLC cell lines by Capillary electrophoresis time‐of‐flight mass spectrometry (CE‐TOF/MS)
G‐Met analysis of culture supernatants of 18 NSCLC cell lines by Ultra‐high performance liquid chromatography‐quadrupole time‐of‐flight mass spectrometry (UHPLC‐QTOF/MS) and Liquid Chromatograph‐Fourier Transform type Mass Spectrometry (LC‐FTMS)
These are described in the Supporting Information.
2.3. Correlation analysis of metabolites and transcripts of 18 non–small‐cell lung cancer cell lines
Spearman correlations between all pairs between differentially detected metabolites in G‐Met analysis and transcripts related to genes assigned as the “Metabolism” category in REACTOME10 were calculated using the computing environment R (R Development Core Team 2008, version 3.4.2, packages: reshape2 and tidyr). Correlations with P‐value satisfying a Bonferroni adjustment (P < 1.90 E‐7) were illustrated as a network using Cytoscape v3.6.0.11
2.4. Correlation analysis among 18 non–small‐cell lung cancer cell lines based on transcriptomic and metabolomic signatures
Spearman correlation coefficients of 18 NSCLC cell lines were calculated based on their transcriptomic profiles (RNA‐seq data) or metabolomic profiles (T‐Met and G‐Met data), and correlation matrices were generated. Hierarchical clustering was conducted by ward (ward.D2) method with distance function by correlation method using the computing environment R (R Development Core Team 2008, version 3.4.2, packages: grid, RColorBrewer, dplyr, tidyr, corrr and pheatmap).
3. RESULTS
3.1. Mutation signatures of the non–small‐cell lung cancer cell lines with high NRF2 activity
To characterize a mutation profile leading to an elevated activity of the NRF2 signaling pathway in NSCLC, we conducted exome analysis of 88 NSCLC cell lines (Tables S2‐S4). These cell lines were categorized into three groups according to the NRF2 pathway activity, for which the expression levels of the NRF2 target genes were obtained from the Cancer Cell Line Encyclopedia (http://www.ncbi.nlm.nih.gov/geo/query/acc.cgi?acc=GSE36133 in the GEO database). We first selected 15 typical NRF2 target genes (NQO1, GCLC, GCLM, SLC7A11, BLVRB, FTH1, FTL, G6PD, GSR, IDH1, ME1, PGD, PRDX1, TXN and TXNRD1) and ranked the 88 cell lines by the expression level of each target gene. The 88 cell lines were sorted according to the rank summation (Figure 1A). Because the same analysis using 4 representative NRF2 target genes out of the 15 generated a mostly similar order of the cells (Figure 1A), we decided to use the expression levels of the 4 NRF2 target genes, NQO1, GCLC, GCLM and SLC7A11, for classifying the NSCLC cell lines (Figure 1B; cell groups colored in pink, grey and light green with high, middle and low activities of NRF2, respectively). The cells in the group colored in pink were designated as the NRF2‐high NSCLC cell lines. The cell order using the rank summation of the 4 genes mostly segregated high and low expressor cell lines for the remaining 11 target genes (Figure 1B).
Figure 1.
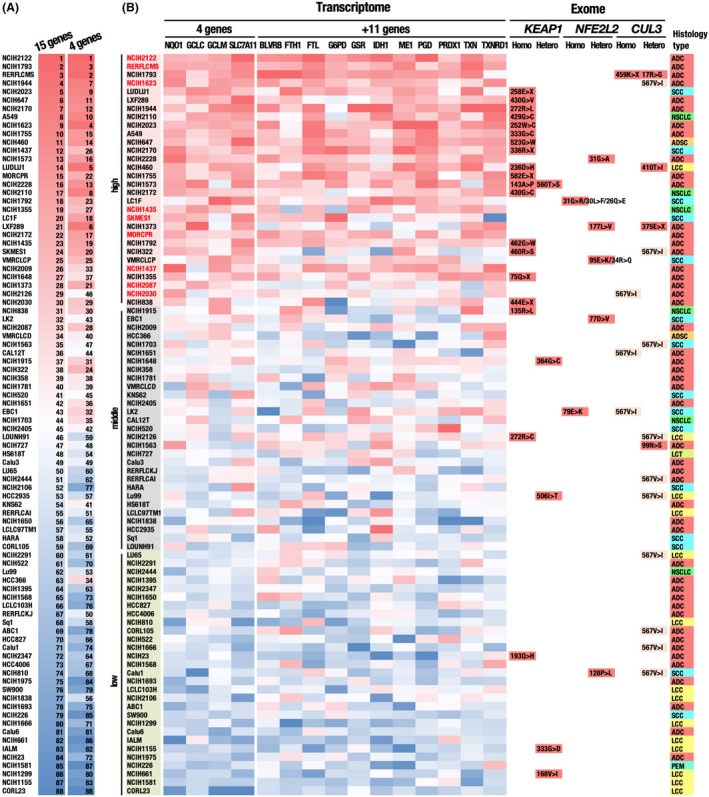
Classification of 88 NSCLC cell lines according to expression levels of representative NRF2 target genes. A, Comparison of cell rankings according to expression levels of 15 and 4 representative NRF2 target genes. The continuous red to blue color code represents the ranking, in which the higher ranking indicates the higher expression levels of NRF2 target genes. B, Classification of the cells according to the 4 representative NRF2 target genes, NQO1, GCLC, GCLM and SLC7A11. Cells indicated in pink, grey and light green are NRF2‐high, NRF2‐middle and NRF2‐low cell lines, respectively. Red highlight indicates cells that belong to NRF2‐high cells but do not possess non–synonymous mutations in the KEAP1, NRF2 or CUL3 genes. The continuous red to blue color codes represent a cell ranking according to the expression level of each NRF2 target gene, which are available in the CCLE database. Non–synonymous mutations in the KEAP1, NRF2 and CUL3 genes, which were identified in our exome analysis, are indicated. A CUL3 mutation, 567V>I, is indicated with a faint yellow color because judging from the high frequency, this mutation is likely to be a genetic polymorphism. The rightmost column indicates the histology type of a tumor, from which each cell line was derived. ADC, adenocarcinoma; ADSC, adenosquamous cell carcinoma; LCC, large cell carcinoma; NSCLC, non–small‐cell carcinoma without detailed information; SCC, squamous cell carcinoma
The histological type did not show any obvious correlations with NRF2 activity, but large cell carcinomas (LCC) appeared to be weakly enriched in the group with low NRF2 activity (Figure 1B). Many of the 30 NSCLC cell lines with high NRF2 activity possess non–synonymous mutations in either KEAP1, NRF2 (NFE2L2) or CUL3 (Figure 1B). These mutations were expected to disrupt the CUL3‐KEAP1‐mediated ubiquitination of NRF2, resulting in the persistent stabilization of NRF2. Non–synonymous NRF2 mutations were detected most frequently in squamous cell carcinoma, as previous study reported.12 Non–synonymous mutations found in a few cell lines with low NRF2 activity were interpreted as functionally silent mutations.
3.2. Mutation signatures of non–small‐cell lung cancer cell lines with high NRF2 activity but without non–synonymous mutations in the genes KEAP1, NRF2 or CUL3
We noticed that 9 NRF2‐high NSCLC cell lines (NCIH2122, RERF‐LC‐MS, NCIH1623, NCIH1435, SKMES1, MOR‐CPR, NCIH1437, NCIH2087 and NCIH2030; shown in red characters in Figure 1B) did not possess non–synonymous mutations in the coding regions of the genes KEAP1, NRF2 (NFE2L2) or CUL3. To further characterize the genetic alterations of the 9 cell lines, we first examined the KEAP1, NRF2 (NFE2L2) and CUL3 loci in more detail by collecting single nucleotide polymorphisms (SNP) in these loci that were detected in only NRF2‐high NSCLC cell lines (Figure 2A). Among them, we selected SNP localized in enhancer regions, which were defined by DNase‐seq of NCI‐H460 in the ENCODE database (ENCSR000FJH, SCREEN v4.10), and in extended promoter regions, which included 1000 bases upstream of the transcription start sites (TSS), as candidates for functional regulatory SNP (Figure 2B‐D). In the KEAP1 and NRF2 loci, 4 out of 4 and 4 out of 16 non–exonic SNP were detected, respectively (Figure 2B,C). No SNP that satisfied the criteria were detected in the CUL3 regulatory region (Figure 2D). These SNP might influence the mRNA levels of the KEAP1 and NRF2 genes, leading to increased NRF2 accumulation and activity.
Figure 2.
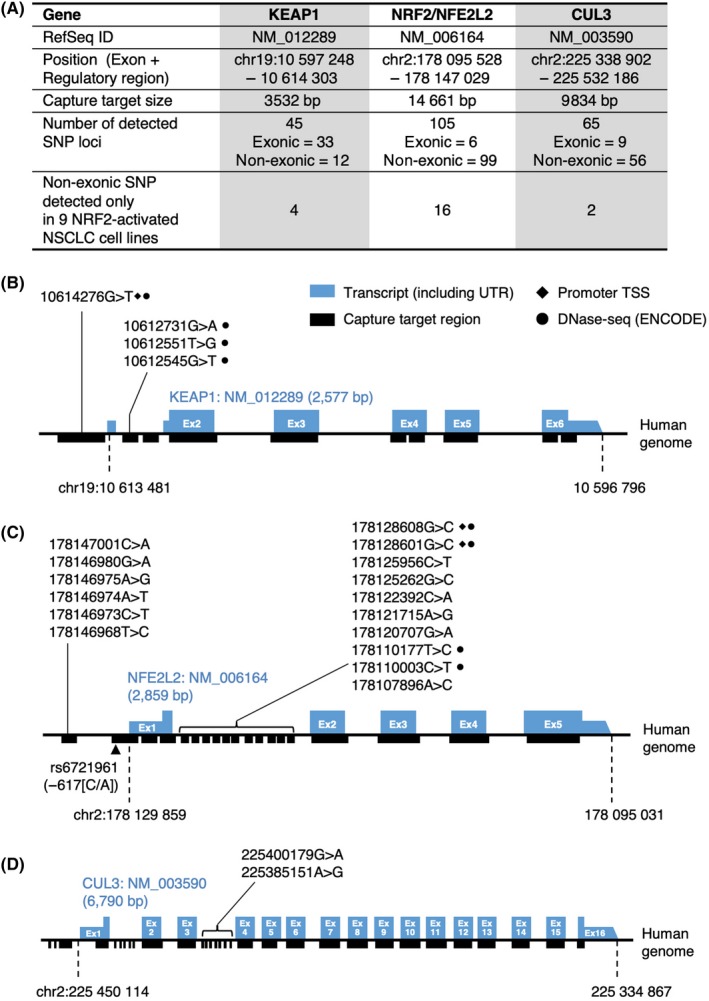
Genetic features of 9 NRF2‐high NSCLC cell lines without mutations in the CUL3‐KEAP1‐NRF2 pathway. A, Summary of SNP detected in the KEAP1, NRF2 (NFE2L2) and CUL3 genes. In Figure 1B, 9 cell lines were identified as NRF2‐high cell lines without non–synonymous mutations in the KEAP1, NRF2 (NFE2L2) and CUL3 genes: NCI‐H2122, RERF‐LC‐MS, NCI‐H1623, NCI‐H1435, SKM‐ES‐1, MOR‐CPR, NCI‐H1437, NCI‐H2087 and NCI‐H2030. Non–exonic SNPs detected in these 9 cell lines are summarized in the bottom row. B‐D, Non–exonic SNP detected in only the 9 NRF2‐high NSCLC cell lines in the KEAP1 (B), NRF2 (C) and CUL3 (D) loci. SNP localized in extended promoter regions, which included 1000 bases upstream of the TSS, were marked with filled diamonds (♦). SNP localized in cis‐regulatory regions, which were defined by DNase‐seq (Z score > 1.64) of the NCI‐H460 cell line in the ENCODE database, were marked with filled circles (●)
As for 1 of the 9 NRF2‐high NSCLC cell lines, RERF‐LC‐MS, a homozygous 3‐bp deletion in the BTB domain of KEAP1 (p.G119_M120>V, COSM2812645) has been registered in the Catalogue of Somatic Mutations in Cancer (COSMIC) database. We detected the same deletion in RERF‐LC‐MS cells, although with low calling accuracy (data not shown). This deletion may contribute to the increase in NRF2 activity via impairment of KEAP1 function in RERF‐LC‐MS.
We next explored non–synonymous mutations in other oncogenic pathways, which might explain the increased NRF2 activity in the absence of apparent non–synonymous mutations in the KEAP1, NRF2 and CUL3 genes (Figure 3). The most frequently mutated gene in the 88 NSCLC cell lines was TP53 (70/88, 79.5%). The ALK (46/88, 52.3%), ROS1 (46/88, 52.3%) and EGFR (44/88, 50.0%) genes were also highly mutated in our analysis, but these genes were mutated in approximately 21% (ALK), 13% (ROS1) and 13% (EGFR) of NSCLC samples in the COSMIC database (cell lines v87). In the 9 NSCLC cell lines without non–synonymous mutations in the KEAP1, NRF2 and CUL3 genes, TP53 (6 cell lines; shown in parentheses), ALK (6 cell lines), ROS1 (6 cell lines), and EGFR (5 cell lines) were also frequently mutated. RET (5 cell lines) and ATM (5 cell lines) were also relatively frequently mutated. However, mutations unique to the 9 NSCLC cell lines were not found in these oncogenic pathways.
Figure 3.
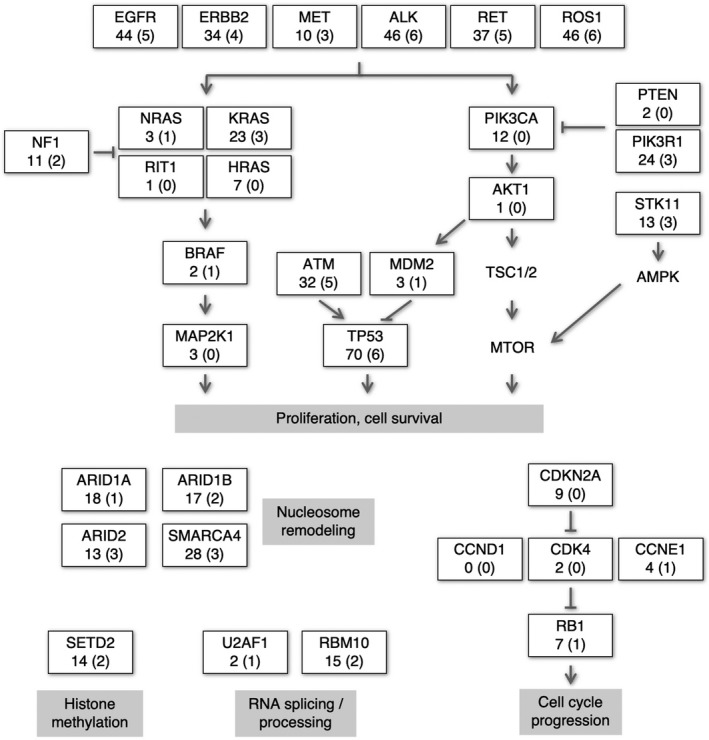
Alterations in the oncogenic pathways in 88 NSCLC cell lines other than the CUL3‐KEAP1‐NRF2 system. The numbers of cell lines with non–synonymous mutations in the respective genes are shown. The numbers not in parentheses indicate cell line numbers out of the 88 NSCLC cell lines. The numbers in parentheses indicate cell line numbers out of the 9 NRF2‐high NSCLC cell lines without mutations in the CUL3‐KEAP1‐NRF2 pathway
A previous study demonstrated that oncogenic mutations in KRAS and BRAF upregulate the transcription of NRF2.13 These mutations were detected in approximately one‐third of 88 cell lines irrespective of the NRF2 activation status, suggesting that KRAS and BRAF mutations do not explain the elevated NRF2 pathway activity in the absence of mutations in the KEAP1, NRF2 and CUL3 genes. Other mechanisms, such as the accumulation of the p62/SQSTM1 protein,14, 15, 16 fumarate17, 18 and iASPP19 and exon skipping of NRF2,20 might be present as causes for NRF2 pathway activation.
3.3. T‐Met analysis of cell lysates and the culture supernatants of the 52 non–small‐cell lung cancer cell lines
To justify the classification of NSCLC cell lines into three groups according to the expression levels of 4 representative NRF2 target genes, we conducted T‐Met analysis using 52 NSCLC cell lines: 20 NRF2‐high cells, 13 NRF2‐middle cells and 19 NRF2‐low cells (Figure 4A). Metabolites in cell extracts as well as culture supernatants of the 52 cell lines were quantified, and those whose concentration showed a positive or negative association with NRF2 activities were selected (Table S5). The metabolomic signatures were mostly consistent with those in our previous study.8 Glutathione and its precursor γ‐glutamylcysteine were elevated in NRF2‐high NSCLC cell lines, which is likely caused by enhanced glutathione synthesis by NRF2 (Figure 4B,C, upper left panels). Glutamate was low in the cell lysates, whereas glutamate was high in the culture supernatants of NRF2‐high NSCLC cell lines (Figure 4D, upper left panels). This is because NRF2 activates xCT, an antiporter of cystine and glutamate, resulting in the increased export of glutamate.
Figure 4.
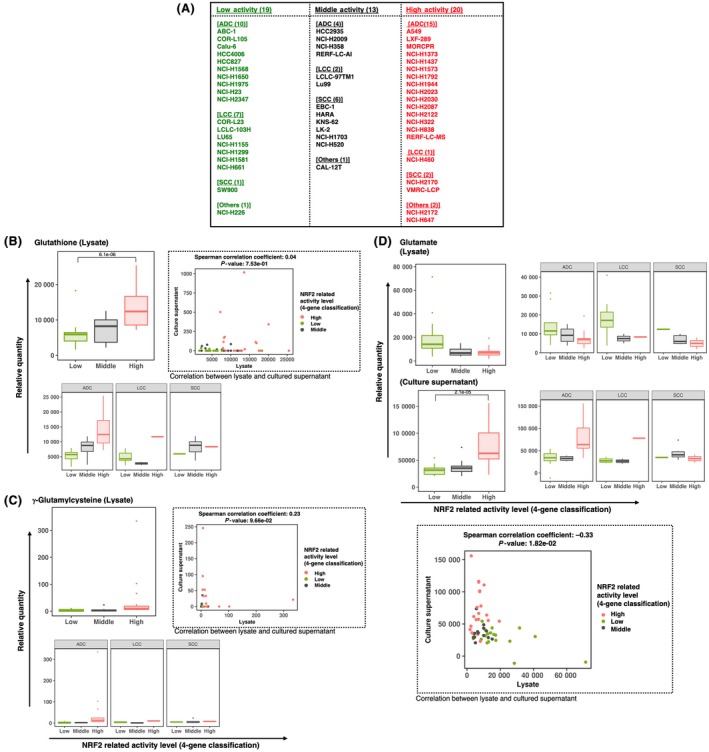
T‐Met analysis of 52 NSCLC cell lines using CE‐TOF/MS. A, Lists of 19, 13 and 20 cell lines selected from the 88 NSCLC cell lines with low, middle and high NRF2 activities, respectively, according to expression rankings of the 4 NRF2 target genes shown in Figure 1B. NSCLC cell lines in each category are further stratified by histology types; ADC, adenocarcinoma; LCC, large cell carcinoma; SCC, squamous cell carcinoma and others. B‐D, Metabolites that were significantly changed in cell lysates and culture supernatants according to the activity of NRF2. Three classes (low, middle and high) are made by using expression rankings of the 4 NRF2 target genes. Box plots indicate relative metabolite concentration in total 52 NSCLC cell lines and in those of each histology type. Boxes represent the interquartile range (IQR) between first quantile (Q1) and third quartiles (Q3). Lines inside the boxes represent the median, whiskers denote the lowest and highest values within 1.5 × IQR from the Q1 and Q3, respectively, and dots represent outliers beyond the whiskers. Scatter plots represent associations between metabolites in cell lysates and those in culture supernatants. The correlation coefficients were calculated using Spearman’s method
When the 52 cell lines were stratified according to the histological type of NSCLC, these tendencies were similarly observed for those derived from adenocarcinoma and large cell carcinoma but not very clear for those derived from squamous cell carcinoma (Figure 4B,C, lower left panels; Figure 4D, upper right panels), although cell lines derived from large cell carcinomas and squamous cell carcinomas were not sufficient in number for the precise statistical evaluation.
We also examined the association of these metabolites between cell lysates and culture supernatants (Figure 4B,C, upper right panels; Figure 4D, lower panel). Glutathione was mainly present in lysates, whereas γ‐glutamylcysteine did not show specific tendencies. Their concentrations in lysates and supernatants were not statistically significant. In contrast, glutamate concentrations in lysates and supernatants were negatively correlated, which was statistically significant; this is consistent with NRF2‐mediated activation of xCT, which exports glutamate.
3.4. G‐Met analysis of the culture supernatants of 18 non–small‐cell lung cancer cell lines
Our previous study suggested that the immune response is suppressed in tumors of NRF2‐activated cancer cells and implicated that NRF2 is likely to help cancer cells evade anti–tumor immunity.9 Among the various communications between cancer cells and their microenvironments, we were particularly interested in metabolites that were consumed from and excreted to their microenvironments by cancer cells. Cancer cells and non–cancer cells in their microenvironments compete for a specific metabolite, and, alternatively, cancer cells excrete a specific metabolite to instruct the cells in their microenvironment. Recent studies have revealed that metabolic competition and metabolic instruction are major strategies for cancer cells to modulate their microenvironments.3, 4, 5
To identify metabolites uniquely exported from NRF2‐activated cancers and those uniquely consumed by NRF2‐activated cancers, we conducted exploratory metabolomics (ie, G‐Met analysis) using culture supernatants of 18 NSCLC cell lines; 11 of NRF2‐high cells and 7 of NRF2‐low cells were selected from the 88 NSCLC cell lines (Figure 5 and Table S6). NRF2 accumulations were verified in the 18 NSCLC cell lines; NRF2 protein levels were, indeed, high and low in NRF2‐high and NRF2‐low cells, respectively (Figure 5A). Lipids and their derivatives accounted for a major portion of the differentially detected metabolites. For example, N‐acetylsphingosine‐1‐phosphate (Figure 5B, panel iii), glycerophosphocholine (Figure 5B, panel iv), lysophosphatidic acid (LPA) (18:0) (Figure 5B, panel vi), 10,16‐dihydroxypalmitic acid (Figure 5B, panel viii), 3‐hexenedioic acid (Figure 5B, panel x), 11‐hydroxy‐3,21‐dioxoolean‐12‐en‐28‐oic acid (Figure 5B, panel xv), and 3‐acetamido‐3‐aminohexanoic acid (Figure 5B, panel xvii) were lipid metabolites that were likely to be exported from NRF2‐high cells. NRF2‐high cells consume larger amounts of triglycerides (TG) (18:2/20:4/21:0) (Figure 5C, panel iv) from the culture media than NRF2‐low cells, implying that lipid metabolism is enhanced in NRF2‐high cancer cells.
Figure 5.
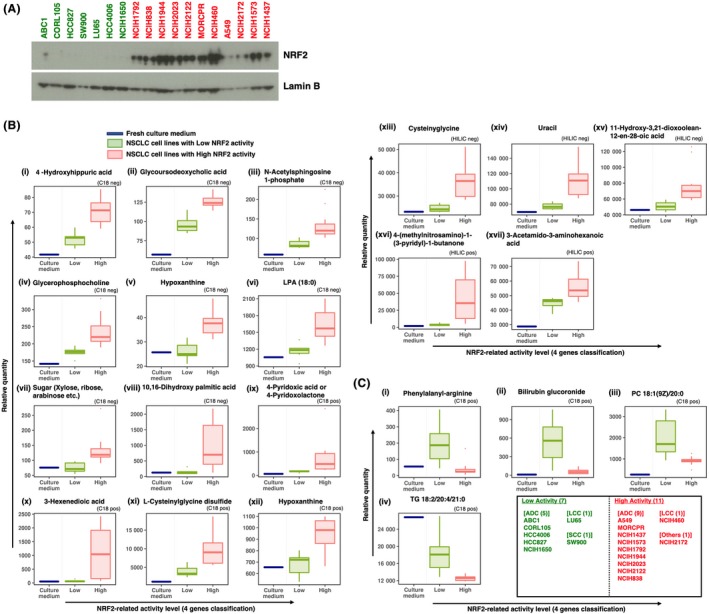
G‐Met analysis of 18 NSCLC cell lines using UHPLC‐QTOF/MS and LC‐FTMS. A, Immunoblot analysis of NRF2 in 18 NSCLC cell lines. Lamin B was detected as a loading control. NRF2‐high and NRF2‐low cells are shown in red and green, respectively. B and C, Box plots of metabolites significantly higher (B) or lower (C) in the culture supernatants of NRF2‐high NSCLC cell lines than in those of NRF2‐low NSCLC cell lines according to expression rankings of 4 NRF2 target genes. Boxes represent the interquartile range (IQR) between first quantile (Q1) and third quartiles (Q3). Lines inside the boxes represent the median, whiskers denote the lowest and highest values within 1.5 × IQR from the Q1 and Q3, respectively, and dots represent outliers beyond the whiskers. Analytical modes using a C18 column or HILIC column in positive ion mode and negative ion mode are shown on each graph as C18 pos, C18 neg, HILIC pos and HILIC neg. LPA, lysophosphatidic acid; PC, phosphatidylcholine; TG, triglyceride
l‐Cysteinylglycine disulfide, which is an oxidized form of a dipeptide derived from the breakdown of glutathione, was higher in NRF2‐high cells than NRF2‐low cells (Figure 5B; panel xi), reflecting the enhanced glutathione synthesis in NRF2‐high cells. Another dipeptide, phenylalanyl‐arginine, was excreted from the NSCLC cell lines with low NRF2 activity but not from those with high NRF2 activity (Figure 5C; panel i), implying that NRF2‐high cells do not excrete dipeptides, but, rather, might utilize them more efficiently than NRF2‐normal cells.
A significant elevation of hypoxanthine was detected in the culture supernatants of NRF2‐high cells in two independent measurement methods: C18‐negative mode and C18‐positive mode (Figure 5B, panels v and xii). This is consistent with our previous results showing that purine nucleotide synthesis is enhanced in NRF2‐high cancer cells.8
Although it is not easy to interpret the biological meanings of all metabolites in the culture supernatants, they are candidates for novel biomarkers that indicate the activation status of NRF2.
3.5. Association study of the transcriptome and metabolome of 18 non–small‐cell lung cancer cell lines
In our efforts to speculate on the synthetic pathways and biological roles of the differentially accumulating metabolites in the culture supernatants of NRF2‐high NSCLC cell lines, we conducted RNA‐seq analysis of the abovementioned 18 NSCLC cell lines (listed in Figure 5C) and examined the association between the metabolites and transcripts (Figure 6 and Figure S1).
Figure 6.
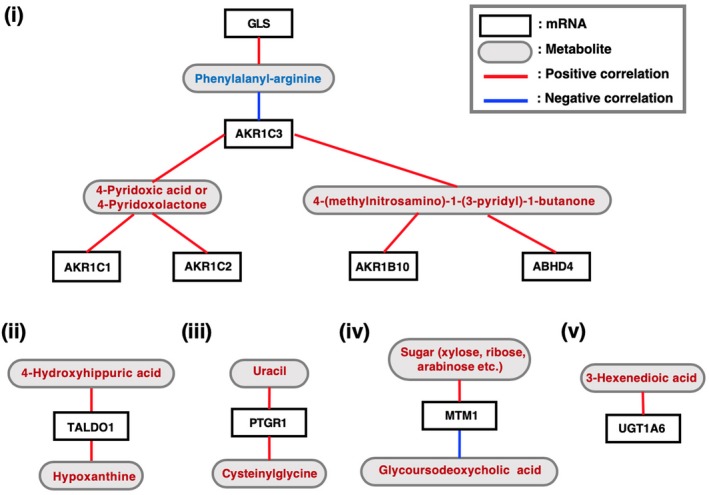
Correlation analysis between the mRNA abundance (TPM; transcripts per million) and metabolite quantity (relative quantity) measured in the G‐Met analysis with Spearman’s method. White and grey boxes indicate the names of genes and metabolites, respectively. Red and blue lines indicate positive and negative correlations between the mRNA abundance and metabolite quantity, respectively. Metabolites shown in red and blue are those increased and decreased in the culture supernatants of NRF2‐high NSCLC cell lines, respectively
We examined the transcriptome of the 18 NSCLC cell lines that were used for the G‐Met analysis. Correlations between the abundance of the differentially accumulating metabolites (Table S6) and the expression levels of metabolism‐related transcripts were analyzed (Figure 6 and Table S7). Among the metabolites that were increased in the culture supernatants of NRF2‐high NSCLC cell lines, one of the xenobiotic metabolites and one of the vitamin metabolites, 4‐(methylnitrosamino)‐1‐(3‐pyridyl)‐1‐butanone and 4‐pyridoxic acid/4‐pyridoxolactone, respectively, were positively correlated with AKR family members, which are involved in detoxification (Figure 6, panel i). Hypoxanthine, which has a purine structure, was positively correlated with TALDO1 (Figure 6, panel ii). This is reasonable considering that TALDO1 is directly activated by NRF2 and is involved in the pentose phosphate pathway,8 which supplies ribose for de novo synthesis of purine nucleotides. Although the rest of the associations between the metabolites and transcripts are not easy to interpret (Figure 6, panels iii‐v), they may provide unique clues to clarifying the biological roles of these metabolites and their contributions to cancer malignancy with further analysis.
Finally, we compared clustering patterns based on metabolomic and transcriptomic signatures of the 18 NSCLC cell lines (Figure 7). The 18 cells lines were categorized into two groups by KEAP1 mutation status (non–synonymous single nucleotide variants) or activation status of NRF2 pathway. Metabolomic signatures in cell lysates by T‐Met, those in culture supernatants by G‐Met and expression profiles of metabolism‐related genes segregated the 18 cell lines better in terms of activation status of NRF2 pathway than KEAP1 mutation status (Figure 7, panels i, iii and v). In contrast, whole transcriptome segregated the 18 cell lines better in terms of KEAP1 mutation status than activation status of NRF2 pathway (Figure 7, panel iv). Unexpectedly, the 18 cell lines were not clearly segregated by metabolomic signatures in culture supernatants by T‐Met (Figure 7, panel ii). These results imply that an appropriate set of metabolites serve as indicators reflecting substantial NRF2 activity.
Figure 7.
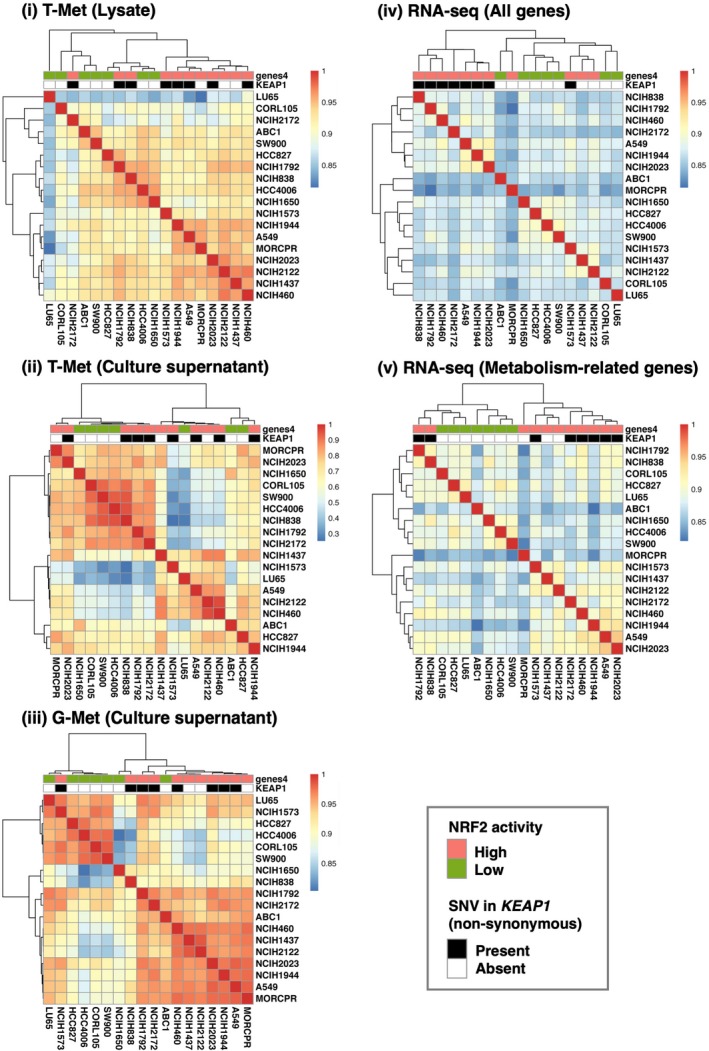
Heat map and hierarchical clustering of 18 cell lines. Similarity between NSCLC cell lines is defined as the Spearman correlation coefficient calculated from the profiles of each analysis. Color codes indicate values of Spearman correlation coefficients. The 18 cell lines are labeled according to the NRF2 activation status and KEAP1 mutation status
4. DISCUSSION
This study described comprehensive metabolic profiling of NSCLC cell lines according to the NRF2 activation status. Because NRF2 activity is mainly determined by the regulation of protein stability rather than by the transcription level of the NRF2 gene, the expression levels of the NRF2 target genes are more appropriate for evaluating NRF2 activity than the mRNA abundance of NRF2 itself. The approach of this study is unique in that NSCLC cells are categorized according to the NRF2 activation status and their metabolic profiles are described using culture supernatants in addition to cell lysates, which allows us to understand dynamic metabolite movement across the plasma membrane. This study provides novel information about the metabolic impacts of NRF2 in NSCLC cell lines on their extracellular fluid.
Non–synonymous somatic mutations of the KEAP1, NRF2 and CUL3 genes are frequently observed in cancers that occur in the lungs, bladder, head and neck, and are recognized as major causes of the persistent activation of NRF2, especially in NSCLC.21, 22 This study suggests the presence of alternative mechanisms that induce the activation of the NRF2 pathway in NSCLC cell lines. Mutations in the regulatory regions might be one of the causes for altered expression levels of the KEAP1, NRF2 and CUL3 genes, resulting in increased NRF2 activity. To verify the functional significance of these mutations, genome editing technology could be used to reverse the mutations to determine whether the expression levels of the respective genes are changed. Other possible mechanisms would be accumulation of a protein that interferes with the interaction between KEAP1 and NRF2, such as p62/SQSTM114, 15 and iASPP/PPP1R13L,19 exon skipping of the NRF2 gene that generates N‐terminally truncated NRF2 lacking a KEAP1‐interaction domain,20 and increased levels of endogenously produced electrophiles.17, 18 There might be other causes that are still unknown.
An interesting feature of the metabolic profile of NRF2‐high NSCLC cells is that various lipid metabolite levels are changed; the levels both increase and decrease in the presence of persistently activated NRF2, suggesting that NRF2 may be involved in lipid metabolism. Indeed, a previous paper reported that NRF2 promotes fatty acid oxidation.23 We also observed that the NRF2‐activated cancer model exhibits upregulation of enzymes catalyzing prostaglandin metabolism.9 As lipid mediators were reported to modulate the activity of anti–tumor immunity,24 the NRF2‐mediated enhancement of lipid mediator production may help NRF2‐activated cancer cells evade anti–tumor immunity.
Another feature is that xenobiotic metabolites, which might have been derived from the ingredients and supplements of the culture medium, are increased in their culture supernatants. Because NRF2 directly activates genes encoding various detoxifying enzymes, elevated xenobiotic metabolites are likely to reflect the increased detoxification capacity of NRF2‐activated NSCLC cells. If a substrate and metabolite pair, which is specifically catalyzed by an enzyme regulated by NRF2, is available, then the metabolic rate of the substrate would be utilized as a surrogate marker of NRF2‐activated NSCLC or, in a more general context, the NRF2 activation status in the body.
NRF2‐activated NSCLC exploits a unique metabolism for proliferation, tumorigenesis and therapeutic resistance. NRF2 redirects glucose and glutamine to anabolic pathways, including purine nucleotides and serine8, 25, activates cystine‐glutamate antiporter xCT to uptake a large amount of cystine at the expense of glutamine, and relies on the glutamine transporter SLC5A1 to compensate for the loss of glutamine.26 As described above, glutaminase inhibition is effective for the suppression of NRF2‐activated NSCLC26; a unique metabolic signature is a favorable therapeutic target displaying selective toxicity towards NRF2‐activated NSCLC.
This study described genetic, transcriptomic and metabolomic signatures of multiple NSCLC cell lines and extracted common features of those with high NRF2 activity. For better understanding of NRF2 roles in NRF2‐high NSCLC cells, NRF2 function needs to be examined in isogenic conditions. Nevertheless, this study provides potentially invaluable information for the exploration of new metabolic nodes that are unique to NRF2‐activated NSCLC for the development of anticancer drugs that are effective for improving the clinical outcome of NRF2‐activated NSCLC patients.
DISCLOSURE
Research funds were provided to Masayuki Yamamoto from Astellas Pharma.
Supporting information
ACKNOWLEDGMENTS
We thank Ms Nao Ota and Yuka Matsuyama for helping with the CE‐TOF/MS operation in T‐Met analysis. We also thank the Biomedical Research Core of the Tohoku University Graduate School of Medicine for their technical support. This work was supported by: JSPS under grant numbers 18H02621 (HM), 18H04794 (HM), 18K19417 (MY), 19H05649 (MY) and 19K07379 (HK); the Naito Foundation (HM); a research grant from the Princess Takamatsu Cancer Research Fund 15‐24728 (HM); and AMED under grant numbers JP19gm5010002 (HM) and JP19cm0106101 (MY). This work was also supported in part by: the Tohoku Medical Megabank Project through the Ministry of Education, Culture, Sports, Science and Technology, Japan; the Reconstruction Agency, Japan; the Project for Promoting Public Utilization of Advanced Research Infrastructure (MEXT); and the Japan AMED (JP19km0105001 and JP19km0105002). The funders had no role in the study design, data collection and analysis, decision to publish or manuscript preparation.
Saigusa D, Motoike IN, Saito S, et al. Impacts of NRF2 activation in non–small‐cell lung cancer cell lines on extracellular metabolites. Cancer Sci. 2020;111:667–678. 10.1111/cas.14278
Daisuke Saigusa, Ikuko N. Motoike, and Sakae Saito contributed equally to this work.
Contributor Information
Hozumi Motohashi, Email: hozumim@med.tohoku.ac.jp.
Masayuki Yamamoto, Email: masiyamamoto@med.tohoku.ac.jp.
REFERENCES
- 1. DeBerardinis RJ, Chandel NS. Fundamentals of cancer metabolism. Sci Adv. 2016;2(5):e1600200. [DOI] [PMC free article] [PubMed] [Google Scholar]
- 2. Renner K, Singer K, Koehl GE, et al. Metabolic hallmarks of tumor and immune cells in the tumor microenvironment. Front Immunol. 2017;8:248. [DOI] [PMC free article] [PubMed] [Google Scholar]
- 3. Sekine H, Yamamoto M, Motohashi H. Tumors sweeten macrophages with acids. Nat Immunol. 2018;19:1281‐1283. [DOI] [PubMed] [Google Scholar]
- 4. Chang C‐H, Qiu J, O’Sullivan D, et al. Metabolic competition in the tumor microenvironment is a driver of cancer progression. Cell. 2015;162:1229‐1241. [DOI] [PMC free article] [PubMed] [Google Scholar]
- 5. Bohn T, Rapp S, Luther N, et al. Tumor immunoevasion via acidosis‐dependent induction of regulatory tumor‐associated macrophages. Nat Immunol. 2018;19:1319‐1329. [DOI] [PubMed] [Google Scholar]
- 6. Yamamoto M, Kensler TW, Motohashi H. The KEAP1‐NRF2 system: a thiol‐based sensor‐effector apparatus for maintaining redox homeostasis. Physiol Rev. 2018;98:1169‐1203. [DOI] [PMC free article] [PubMed] [Google Scholar]
- 7. Kitamura H, Motohashi H. NRF2 addiction in cancer cells. Cancer Sci. 2018;109:900‐911. [DOI] [PMC free article] [PubMed] [Google Scholar]
- 8. Mitsuishi Y, Taguchi K, Kawatani Y, et al. Nrf2 redirects glucose and glutamine into anabolic pathways in metabolic reprogramming. Cancer Cell. 2012;22:66‐79. [DOI] [PubMed] [Google Scholar]
- 9. Kitamura H, Onodera Y, Murakami S, Suzuki T, Motohashi H. IL‐11 contribution to tumorigenesis in an NRF2 addiction cancer model. Oncogene. 2017;36:6315‐6324. [DOI] [PubMed] [Google Scholar]
- 10. Fabregat A, Jupe S, Matthews L, et al. The reactome pathway knowledgebase. Nucleic Acids Res. 2018;46:D649‐D655. [DOI] [PMC free article] [PubMed] [Google Scholar]
- 11. Shannon P, Markiel A, Ozier O, et al. Cytoscape: a software environment for integrated models of biomolecular interaction networks. Genome Res. 2003;13:2498‐2504. [DOI] [PMC free article] [PubMed] [Google Scholar]
- 12. Frank R, Scheffler M, Merkelbach‐Bruse S, et al. Clinical and pathological characteristics of KEAP1‐ and NFE2L2‐mutated non–small cell lung carcinoma (NSCLC). Clin Cancer Res. 2018;24:3087‐3096. [DOI] [PubMed] [Google Scholar]
- 13. DeNicola GM, Karreth FA, Humpton TJ, et al. Oncogene‐induced Nrf2 transcription promotes ROS detoxification and tumorigenesis. Nature. 2011;475:106‐109. [DOI] [PMC free article] [PubMed] [Google Scholar]
- 14. Komatsu M, Kurokawa H, Waguri S, et al. The selective autophagy substrate p62 activates the stress responsive transcription factor Nrf2 through inactivation of Keap1. Nat Cell Biol. 2010;12:213‐223. [DOI] [PubMed] [Google Scholar]
- 15. Ichimura Y, Waguri S, Sou Y‐S, et al. Phosphorylation of p62 activates the Keap1‐Nrf2 pathway during selective autophagy. Mol Cell. 2013;51:618‐631. [DOI] [PubMed] [Google Scholar]
- 16. Saito T, Ichimura Y, Taguchi K, et al. p62/Sqstm1 promotes malignancy of HCV‐positive hepatocellular carcinoma through Nrf2‐dependent metabolic reprogramming. Nat Commun. 2016;7:12030. [DOI] [PMC free article] [PubMed] [Google Scholar]
- 17. Adam J, Hatipoglu E, O'Flaherty L, et al. Renal cyst formation in Fh1‐deficient mice is independent of the Hif/Phd pathway: roles for fumarate in KEAP1 succination and Nrf2 signaling. Cancer Cell. 2011;20:524‐537. [DOI] [PMC free article] [PubMed] [Google Scholar]
- 18. Ooi A, Wong J‐C, Petillo D, et al. An antioxidant response phenotype shared between hereditary and sporadic type 2 papillary renal cell carcinoma. Cancer Cell. 2011;20:511‐523. [DOI] [PubMed] [Google Scholar]
- 19. Ge W, Zhao K, Wang X, et al. iASPP is an antioxidative factor and drives cancer growth and drug resistance by competing with Nrf2 for Keap1 binding. Cancer Cell. 2017;32(5):561‐573.e6. [DOI] [PubMed] [Google Scholar]
- 20. Goldstein L, Lee J, Gnad F, et al. Recurrent loss of NFE2L2 Exon 2 is a mechanism for Nrf2 pathway activation in human cancers. Cell Rep. 2016;16:2605‐2617. [DOI] [PubMed] [Google Scholar]
- 21. Cancer Genome Atlas Research Network . Comprehensive genomic characterization of squamous cell lung cancers. Nature. 2012;489:519‐525. [DOI] [PMC free article] [PubMed] [Google Scholar]
- 22. Kandoth C, McLellan MD, Vandin F, et al. Mutational landscape and significance across 12 major cancer types. Nature. 2013;502:333‐339. [DOI] [PMC free article] [PubMed] [Google Scholar]
- 23. Ludtmann MH, Angelova PR, Zhang Y, Abramov AY, Dinkova‐Kostova AT. Nrf2 affects the efficiency of mitochondrial fatty acid oxidation. Biochem J. 2014;457:415‐424. [DOI] [PMC free article] [PubMed] [Google Scholar]
- 24. Zelenay S, van der Veen A, Böttcher J, et al. Cyclooxygenase‐dependent tumor growth through evasion of immunity. Cell. 2015;162:1257‐1270. [DOI] [PMC free article] [PubMed] [Google Scholar]
- 25. DeNicola GM, Chen P‐H, Mullarky E, et al. NRF2 regulates serine biosynthesis in non–small cell lung cancer. Nat Genet. 2015;47:1475‐1481. [DOI] [PMC free article] [PubMed] [Google Scholar]
- 26. Romero R, Sayin VI, Davidson SM, et al. Keap1 loss promotes Kras‐driven lung cancer and results in dependence on glutaminolysis. Nat Med. 2017;23:1362‐1368. [DOI] [PMC free article] [PubMed] [Google Scholar]
Associated Data
This section collects any data citations, data availability statements, or supplementary materials included in this article.
Supplementary Materials


