

Abstract
There is an urgent need to find novel potential therapeutic targets for the diagnosis and treatment of clear cell renal cell carcinoma (ccRCC) due to its highly invasive ability as a common urological malignant tumor. Circular RNAs (circRNAs) have been indicated as potentially critical mediators in various types of tumor progression. We first used qRT‐PCR analysis to find dysregulated circRNAs in ccRCC. A novel circRNA, hsa_circ_001895, was upregulated in ccRCC specimens and associated with metastatic properties of ccRCC. However, the tumorigenic mechanism of hsa_circ_001895 on ccRCC is yet to be found. We first indicated that hsa_circ_001895 predicted a poor prognosis in ccRCC patients. Additionally, overexpression of hsa_circ_001895 not only promoted cell proliferation, invasion and migration of ccRCC, but also inhibited cell apoptosis, whereas hsa_circ_001895 knockdown reversed the effect on ccRCC progression. In vivo s.c. xenotransplanted tumor model also showed that silencing hsa_circ_001895 could suppress in vivo ccRCC growth. Mechanistically, hsa_circ_001895 directly binds with microRNA (miR)‐296‐5p and inhibits its expression. Moreover, sex determining region Y (SRY)‐box 12 (SOX12) was identified as a target of miR‐296‐5p, the expression of which was suppressed by miR‐296‐5p. Notably, the inhibitory effect of hsa_circ_001895 on ccRCC progression was reversed by miR‐296‐5p inhibitor. In general, our findings indicated that hsa_circ_001895 may sponge miR‐296‐5p and promote SOX12 expression, which is the underlying mechanism of hsa_circ_001895‐induced ccRCC progression.
Keywords: clear cell renal cell carcinoma, hsa_circ_001895, miR‐296‐5p, progression, SOX12
CircRNA hsa_circ_001895 was upregulated in both clear cell renal cell carcinoma (ccRCC) tissues and cell lines. Hsa_circ_001895 promoted ccRCC proliferation.

1. INTRODUCTION
Renal cell carcinoma accounts for at least 3% of malignant diseases,1 and ranks the second leading cause of urological malignant neoplasm‐related death.2 Clear cell renal cell carcinoma (ccRCC) comprises 80%‐90% of RCC with higher invasive ability and relapse rate than other RCC subtypes.3 Incidence and mortality of ccRCC appear to be increasing rapidly in the past few decades as a result of this highly metastatic disease.4 Overall patient survival is not satisfactory as a result of local recurrence and distant metastasis.5, 6, 7 Therefore, identification of new sensitive biomarkers and investigation of the underlying molecular mechanism would be of great clinical significance for diagnosis and treatment.
Circular RNAs (circRNAs), covalently closed continuous loop without 5′‐3′ polarity and polyadenylation tails,8 are widespread in the cytoplasm.9 CircRNAs have been found to be dysregulated in cancers.10 However, the functional role of circRNAs in carcinogenesis is yet to be found. Recently, research has found that circRNAs play an important role in growth and metastasis of various tumors.11 CircHIAT1 was downregulated in ccRCC, and inhibition of circHIAT1 promoted cell migration and invasion of ccRCC.12 As a result of the complicated pathogenesis of ccRCC, more circRNAs need to be discovered.
Circular RNAs may function in microRNA (miRNA) binding, protein interaction and regulation of mRNA splicing to mediate cancer progression.13 CircRNAs contain miRNA‐binding sites in their sequences,14 which enable them to regulate miRNA function as a miRNA sponger.9 It has been reported that miRNAs usually bind to the 3′ UTR of target mRNAs to regulate gene expression.15 Therefore, the binding of circRNAs to miRNAs results in the regulation of target gene expression and formation of a circRNA‐miRNA‐mRNA functional network. For example, circHIAT1 binds to miR‐195‐5p/29a‐3p/29c‐3p to upregulate CDC42, thus participating in ccRCC progression.12
Although multiple circRNAs have been reported to regulate tumor progression,16 the functional roles of circRNAs in ccRCC remain largely unknown. We found a novel circRNA, hsa_circ_001895, which was upregulated in ccRCC specimens and associated with poor prognosis of ccRCC patients. Hereafter, we investigated the impact of hsa_circ_001895 on tumor progression of ccRCC. Moreover, the downstream target and underlying mechanism were also explored. The results might have certain guiding significance for development of novel ccRCC therapy.
2. MATERIALS AND METHODS
2.1. Patients and tumor tissue collection
Total of 60 paired ccRCC and adjacent noncancer tissues were collected from patients by surgical resection at Nanfang Hospital, Southern Medical University. The patients were diagnosed by pathology examination. Permission for this study was obtained from the ethics committee of the institution, and all patients signed written informed consent. Patients with ccRCC are assigned as stage I, II, III and IV by TNM classification.
2.2. In situ hybridization
Clear cell renal cell carcinoma tissues of 5‐μm thickness at different TNM stages were fixed in 10% formalin, and embedded with paraffin. After dewaxing and rehydration, the sections were digested with 20 µg/mL proteinase K for 30 minutes. Four percent paraformaldehyde‐fixed sections were hybridized with 8 ng/µL specific antisense oligonucleotide DNA probe synthesized by Invitrogen overnight at 55°C. The samples were incubated with HRP (Sigma Aldrich) at 4°C for 30 minutes. Hybridization signals were amplified with diaminobenzidine (DAB; Sigma Aldrich), and images were taken by fluorescent microscope (DP12 SZX7; Olympus Inc.).
2.3. Cell culture and transfection
Human ccRCC cell lines (786‐O, A498, OS‐RC‐2, 769‐P and ACHN) and human renal proximal tubular epithelial cell line HK2, purchased from Chinese Academy of Sciences, were cultured in RPMI 1640 medium (Lonza) supplemented with 10% FBS (Gibco). Constant temperature of 37°C with 5% CO2 was used for incubating cells.
For silencing of hsa_circ_001895, shRNA target hsa_circ_001895 or the negative control (shNC) was inserted into pLKO.1 vector (Biosettia). HEK‐293T cells (4 × 10⁵/well) were cotransfected with pLKO‐hsa_circ_001895 (sh‐circ) or pLKO‐shNC (sh‐NC) with psPAX2 and pMD2.G by Lipofectamine 2000 (Invitrogen). Forty‐eight hours later, lentiviruses were harvested. 786‐O or A498 cells were infected with sh‐circ or sh‐NC lentiviruses with 8 mg/mL polybrene by ViraPower Packaging Mix (ThermoFisher). Stable cell lines were obtained by treatment with 5 μg/mL puromycin (Sigma Aldrich) for 7 days. For knockdown of CTBP1 (C‐terminal‐binding protein 1), shRNA target CTBP1 was constructed (RiboBio). 786‐O or A498 cells were also transfected with sh‐CTBP1 (40 nmol/L) by Lipofectamine 2000 (Invitrogen).
For overexpression of hsa_circ_001895 and CTBP1, full length of hsa_circ_001895 and CTBP1 were constructed into pcDNA3.1 vector (Invitrogen). 786‐O or A498 cells were transfected with pcDNA3.1‐hsa_circ_001895 or pcDNA3.1‐CTBP1 by Lipofectamine 2000 (Invitrogen).
MicroRNA‐296‐5p mimics, inhibitor and the respective negative controls (miR‐NC, inh NC) were synthesized by GenePharma. 786‐O or A498 cells were transfected with miR‐296‐5p mimics/inhibitor (20 nmol/L) or their NC by Lipofectamine 2000.
2.4. Fluorescence in situ hybridization
786‐O or A498 cells were first fixed in 4% formaldehyde solution, and then incubated with 0.1% Triton X‐100. Fluorescence‐conjugated hsa_circ_001895 or miR‐296‐5p probes (40 nmol/L) (Invitrogen) were hybridized at 37°C with cells in the dark for 5 hours. The cells were then photographed by laser scanning confocal microscopy (Carl Zeiss).
2.5. Cell proliferation assay
786‐O or A498 cells were seeded in 96‐well plates at a concentration of 2 × 10³/well. CCK8 solution (20 μL; Dojindo) was added to each well and mixed for 2 hours. Microplate Autoreader (ThermoFisher) was used to measure absorbance at 450 nm every 24 hours. For colony formation experiments, 786‐O or A498 cells were seeded on six‐well plates at a concentration of 1 × 10³/well with RPMI 1640 medium. Fourteen days later, the colonies were fixed in methanol and stained with crystal violet (0.1%). Visible colonies were counted and photographed under a light microscope (Bx41, Olympus).
5‐Ethynyl‐2′‐deoxyuridine (EdU) cell proliferation assay kit (RiboBio) was used to detect cell proliferation of 786‐O or A498 cells. Cultured 786‐O or A498 cells (200 μL of 2 × 10⁴/mL) were incubated with 50 µmol/L EdU for 8 hours. After fixation with 70% alcohol and permeabilization with Triton X‐100, the cells were then incubated with Apollo Staining reaction liquid (Click‐iT™ Edu Apollo Stain Kit (Invitrogen) to label the cells. Nuclei were stained with DAPI. Immunostaining was visualized and photographed under a fluorescent microscope (Olympus inverted microscope IX71).
2.6. Flow cytometer
786‐O or A498 cells (1 × 10⁶) were harvested after trypsin digestion. For cell cycle analysis, cells were stained with 5 µL propidium iodide (PI; 100 µg/mL) with 1 U/mL ribonuclease (Abcam). For cell apoptosis analysis, cells were resuspended with 100 μL binding buffer (KeyGEN BioTech) containing 5 µL PI (100 µg/mL) with 1 U/mL ribonuclease in the dark, and then incubated with an additional 5 μL FITC‐conjugated Annexin V. Both cell types were analyzed by FACS flow cytometer (Attune; Life Technologies).
2.7. Wound healing
786‐O or A498 cells were seeded in 24‐well plates at a concentration of 1 × 10⁶/well for 24 hours. Wound gaps were then formed by gentle scratching using a plastic pipette tip in the cell monolayer of each well. Debris or detached cells were removed and cultured in DMEM for another 24 hours before calculating wound width under an inverted microscope (CKX53, Olympus).
2.8. Transwell assay
786‐O or A498 cells at a concentration of 5 × 10⁴/well were seeded into the upper wells of a chamber (BD Biosciences) with a Matrigel‐coated membrane (BD Biosciences). RPMI 1640 medium with 10% FBS was added to the lower wells of chambers. Eight hours later, medium of upper wells and filters were removed. Twenty four hours later, cells that had invaded the bottom of chambers were fixed with 100% methanol, washed with PBS and then stained with 0.1% crystal violet. The stained cells were imaged and counted under a microscope (Bx41, Olympus).
2.9. Dual luciferase reporter assay
Wild‐type or mutant hsa_circ_001895 or 3′‐UTR SOX12 was synthesized and then subcloned into pmirGLO (Promega). miR‐296‐5p, miR‐520h or miR‐516a‐5p containing the binding sites of hsa_circ_001895 were also subcloned into pmirGLO luciferase reporter vector. Additionally, 3′‐UTR nuclear factor I‐C (NFIC), RNF44 (ring finger protein 44) and SOX12 were also subcloned into pmirGLO luciferase reporter vector. 786‐O or A498 cells were seeded in 24‐well plates at a concentration of 3 × 10⁴ per well and cotransfected miR‐296‐5p mimics or miR‐NC with pmirGLO‐wt‐hsa_circ_001895, pmirGLO‐mut‐hsa_circ_001895, pmirGLO‐wt‐SOX12 or pmirGLO‐mut‐SOX12. HEK293 cells were also transfected with pmirGLO‐miR‐296‐5p, miR‐520h, miR‐516a‐5p, NFIC, RNF44 or SOX12. Two days later, luciferase activities were measured by Lucifer Reporter Assay System (Promega) and normalized to Renilla luciferase activity.
2.10. RNA immunoprecipitation
786‐O or A498 cells were collected and lysed using Magna RIP Kit (EMD Millipore), and then incubated with protein G Sepharose beads (GE Healthcare) coated with anti‐AGO2 antibody (Abcam) at 4°C overnight, and anti‐IgG antibody was used as the negative control. RNA was then isolated for qRT‐PCR as mentioned below.
2.11. qRT‐PCR
Total RNAs from ccRCC tissues or cell lines were isolated using Trizol (Invitrogen), and miRNAs were extracted with miRcute miRNA Isolation Kit (Tiangen). Cytoplasmic and nuclear RNAs were separated using PARIS Kit (Life Technologies, ThermoFisher). For RNase R treatment, 2 μg total RNAs was incubated with or without 3 U/μg RNase R (Epicenter Technologies), and the resulting RNAs were purified by RNeasy MinElute cleaning Kit (Qiagen). RNAs were reverse‐transcribed using PrimeScript RT Reagent (Takara). SYBR Green Master (Roche) on ViiA 7 (Applied Biosystems) was used for qRT‐PCR. GAPDH was used as endogenous control for circRNAs and mRNAs; U6 was used as endogenous control for miRNAs. Primer sequences are shown in Table 1.
Table 1.
Primer sequences used for qRT‐PCR
| ID | Sequence (5′‐3′) |
|---|---|
| GAPDH F | ACCACAGTCCATGCCATCAC |
| GAPDH R | TCCACCACCCTGTTGCTGTA |
| β‐actin F | GGGCATCCTGACCCTCAAG |
| β‐actin R | TCCATGTCGTCCCAGTTGGT |
| U2 F | CGAAGGTTCAGGTTTACTCACG |
| U2 R | ATTTCAATCTCAGGCGGA |
| hsa_circ_001895 F | TGGAGACTGGGGGAAGATGA |
| hsa_circ_001895 R | CACACTAACTGGCTGAGGGG |
| CTBP1 F | GTGCCCTGATGTACCATACCA |
| CTBP1 R | GCCAATTCGGACGATGATTCTA |
| miR‐516a‐5p F | CGGCGGATCACACAAAGGCAA |
| miR‐516a‐5p R | CGGCGGGAGTGCCTTCTTTTG |
| miR‐520h F | TCGCGACAAAGTGCTTCCCT |
| miR‐520h R | GTGCAGGGTCCGAGGT |
| miR‐296‐5p F | CGTCTATACAGACCCTGGCTTTTC |
| miR‐296‐5p R | CTCAACTGGTGTCGTGGA |
| NFIC F | GGACAGGGATGGGCTCTG |
| NFIC R | CGTTCTTCTGAGGCCAGTGC |
| RNF44 F | CCTACTTCCTCTCGATGCTG |
| RNF44 R | CTGCTCTATGTCTGCTTTGG |
| SOX12 F | CGCGATGGTGCAGCAGCG |
| SOX12 R | GCCACTGGTCCATGATCTTC |
| U6 F | CTCGCTTCGGCAGCACA |
| U6 R | AACGCTTCACGAATTTGCGT |
2.12. Western blot
Proteins extracted from ccRCC tissues or cells (30 μg) were separated by SDS‐PAGE, and then transferred to PVDF membrane. The PVDF membrane was then incubated overnight with primary antibodies: anti‐E‐cadherin, anti‐N‐cadherin antibodies (1:1500; Abcam), Bcl‐2, Bax and Cleaved caspase 3 (1:2000; Abcam), NFIC, RNF44 and SOX12 (1:2500; Abcam), GAPDH (1:3000; Abcam) at 4°C after blocking with 5% BSA. Last, immunoreactivities were detected by ECL (KeyGen) after incubating with HRP‐labeled secondary antibody (1:5000; Abcam).
2.13. Mouse xenograft assay
All experimental protocols were carried out under the approved guidelines of the Institutional Animal Care and Use Committee at our institution. Sixteen 4‐week‐old female BALB/c nude mice, purchased from Shanghai Institute of Material Medical (Chinese Academy of Science), were randomly separated into two groups. 786‐O cells (100 μL of 5 × 10⁶) in PBS with pLKO‐hsa_circ_001895 or pLKO‐shNC were s.c. injected into the right flank of nude mice. Tumors were measured with digital calipers every 7 days and tumor volume was calculated. Thirty days later, the mice were killed with 40 mg/kg sodium pentobarbital. Tumor tissues were isolated and weighted, and RNAs and proteins were extracted for analysis.
2.14. Hematoxylin and eosin staining
Clear cell renal cell carcinoma tissues from mice were fixed in 4% paraformaldehyde and then processed by a paraffin tissue‐processing machine, cut into 7‐μm sections using a RM2245 microtome (Leica Microsystems). For H&E staining, the sections were first deparaffinized in xylene, and then hydrated in serially diluted ethanol, and finally stained with H&E (Sigma Aldrich) for 10 minutes. Representative photomicrographs were captured using a microscope (Bx41, Olympus Corp.).
2.15. Immunohistochemistry
Clear cell renal cell carcinoma tissues from patients or mice were fixed in 10% formalin, and embedded with paraffin. Sections (4 μm) were incubated in 3% H2O2 after dewaxing and rehydration, and then immersed in Tris‐EDTA buffer containing 0.05% Tween 20. The sections were incubated in 4% dry milk and 0.3% goat serum in PBS solution and then incubated overnight with anti‐SOX12, E‐cadherin, N‐cadherin Ki‐67 or cleaved caspase 3 (Abcam) antibody in the presence of 10% rabbit serum. Last, the sections were incubated with HRP goat anti‐rabbit IgG secondary antibody. Slides were counterstained with hematoxylin to stain cell nuclei and examined under a light microscope (Bx41, Olympus).
2.16. Statistical analysis
All results are expressed as mean ± SEM. We determined the statistical analyses using GraphPad Prism software and one‐way analysis of variance (ANOVA). Overall survival difference between patients with high or low levels of hsa_circ_001895 expression was analyzed by Kaplan‐Meier method and log‐rank test. P < .05, P < .01 or P < .001 were considered statistically significant.
3. RESULTS
3.1. CircRNA hsa_circ_001895 was upregulated in both ccRCC tissues and cell lines
We first screened three paired ccRCC and adjacent noncancer tissues by qRT‐PCR. Hierarchical clustering indicated 12 upregulated and four downregulated circRNAs in ccRCC tissues (Figure 1A). A new circRNA hsa_circ_001895 was verified to be upregulated in ccRCC tissues (Figure 1B). Moreover, qRT‐PCR also showed upregulation of hsa_circ_001895 in 60 pairs of ccRCC tissues compared to adjacent noncancer tissues (Figure 1B). Additionally, hsa_circ_001895 was positively related to TNM stage of ccRCC by in situ hybridization (ISH; Figure 1C), suggesting that hsa_circ_001895 may contribute to the progression of ccRCC.
Figure 1.
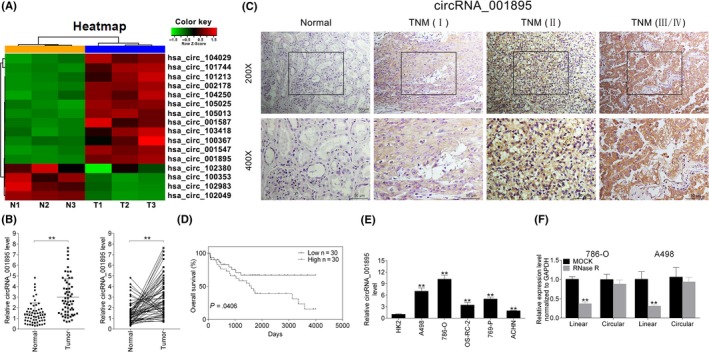
Circular RNA (circRNA) hsa_circ_001895 was upregulated in both clear cell renal cell carcinoma (ccRCC) tissues and cell lines. A, Heat map shows dysregulated circRNAs between ccRCC tissues (T) and adjacent noncancer tissues (N). B, Expression of circRNA hsa_circ_001895 in ccRCC tissues and adjacent noncancer tissues detected by qRT‐PCR (N = 60). C, In situ hybridization analysis of hsa_circ_001895 expression in ccRCC tissues with different TNM stage. D, Overall survival analysis of ccRCC patients with high hsa_circ_001895 expression and low levels of hsa_circ_001895. E, Expression of hsa_circ_001895 in human ccRCC cell lines (786‐O, A498, OS‐RC‐2, 769‐P and ACHN) and HK2 detected by qRT‐PCR. F, Hsa_circ_001895 was resistant to RNase R digestion compared to linear CTBP1. **Tumor vs normal tissues, ccRCC cell lines vs HK2, RNase R vs MOCK, P < .01
Depending on median ratio of hsa_circ_001895 expression, patients were divided into a high hsa_circ_001895 expression group (N = 30) and a low hsa_circ_001895 expression group (N = 30). Kaplan‐Meier survival analysis showed that high expression of hsa_circ_001895 showed shorter overall survival (OS) than patients with low expression of hsa_circ_001895 (P = .0406; Figure 1D). Further refinement analysis of correlation between hsa_circ_001895 expression and clinicopathological characteristics of ccRCC patients showed that among the 60 patients, high expression of hsa_circ_001895 was significantly related to TNM stage (P = .005), pT stage (P = .003) and pN stage (P = .001; Table 2). Moreover, other clinical characteristics such as age (P = .605), gender (P = .787), and so on, showed no significant correlation with hsa_circ_001895 expression (Table 2). These results indicated that upregulation of hsa_circ_001895 was related to poor prognosis of ccRCC, suggesting a potential prognostic biomarker of hsa_circ_001895 in ccRCC.
Table 2.
Association of circRNA_001895 expression with clinicopathological characteristics in 60 ccRCC patients
| Characteristic | Patients | Tumoral circRNA_001895 expression | |||
|---|---|---|---|---|---|
| n | % | Low | High | P value | |
| All patients | 60 | 100 | 30 | 30 | |
| Gender | .787 | ||||
| Male | 39 | 65.00 | 19 | 20 | |
| Female | 21 | 35.0 | 11 | 10 | |
| Age (y) | .605 | ||||
| ≤55 | 32 | 53.33 | 15 | 17 | |
| >55 | 28 | 46.67 | 15 | 13 | |
| TNM stage | .005 | ||||
| I + II | 47 | 78.33 | 28 | 19 | |
| III + IV | 13 | 21.67 | 2 | 11 | |
| pT stage | .003 | ||||
| T1 + T2 | 49 | 81.67 | 29 | 20 | |
| T3 + T4 | 11 | 18.33 | 1 | 10 | |
| pN stage | .001 | ||||
| N0 | 51 | 85.00 | 30 | 21 | |
| N1 | 9 | 15.00 | 0 | 9 | |
| pM stage | .076 | ||||
| M0 | 57 | 95.00 | 30 | 27 | |
| M1 | 3 | 5.00 | 0 | 3 | |
| Fuhrman grade | .542 | ||||
| I + II | 46 | 76.67 | 24 | 22 | |
| III + IV | 14 | 23.33 | 6 | 8 | |
| Tumor size (cm) | .795 | ||||
| ≤5 | 33 | 55.00 | 16 | 17 | |
| >5 | 27 | 45.00 | 14 | 13 | |
Meanwhile, the expression of hsa_circ_001895 was also upregulated in five human ccRCC cell lines (786‐O, A498, OS‐RC‐2, 769‐P and ACHN) compared to HK2 (Figure 1E). 786‐O and A498 cells with higher expression of hsa_circ_001895 were chosen for subsequent functional assays. RNase R that could digest linear RNAs was used to further verify the circular nature of hsa_circ_001895, and the result indicated that hsa_circ_001895 was resistant to RNase R digestion compared to linear CTBP1 (Figure 1F).
3.2. Hsa_circ_001895 promoted ccRCC proliferation
Results of nuclear and cytoplasmic separation experiments showed that hsa_circ_001895 was mainly located in the cytoplasm (Figure 2A). FISH also confirmed the cytoplasm localization of hsa_circ_001895 in ccRCC cells (Figure 2B). The specific mechanism of hsa_circ_001895 involved in ccRCC was further investigated through gain‐ and loss‐of‐function assays. First, 786‐O and A498 cells transfected with sh‐hsa_circ_001895 or pcDNA‐hsa_circ_001895 for the knockdown or overexpression of hsa_circ_001895, respectively, were determined by qRT‐PCR as shown in Figure 2C. Knockdown or overexpression of hsa_circ_001895 and CTBP1 were not influenced by each other (Figure 2C). Second, CCK‐8 (Figure 2D) showed that sh‐hsa_circ_001895 decreased cell viability of ccRCC cells, whereas pcDNA‐hsa_circ_001895 increased cell viability. Moreover, colony formation (Figure 2E) and EdU labeling (Figure 2F) assays showed the promotion ability of hsa_circ_001895 overexpression on cell proliferation of ccRCC cells. However, hsa_circ_001895 knockdown showed the reverse effect on cell proliferation (Figure 2E,F). Last, flow cytometry indicated that hsa_circ_001895 knockdown blocked the cell cycle at G1 phase, whereas hsa_circ_001895 overexpression promoted the cell cycle (Figure 2G).
Figure 2.
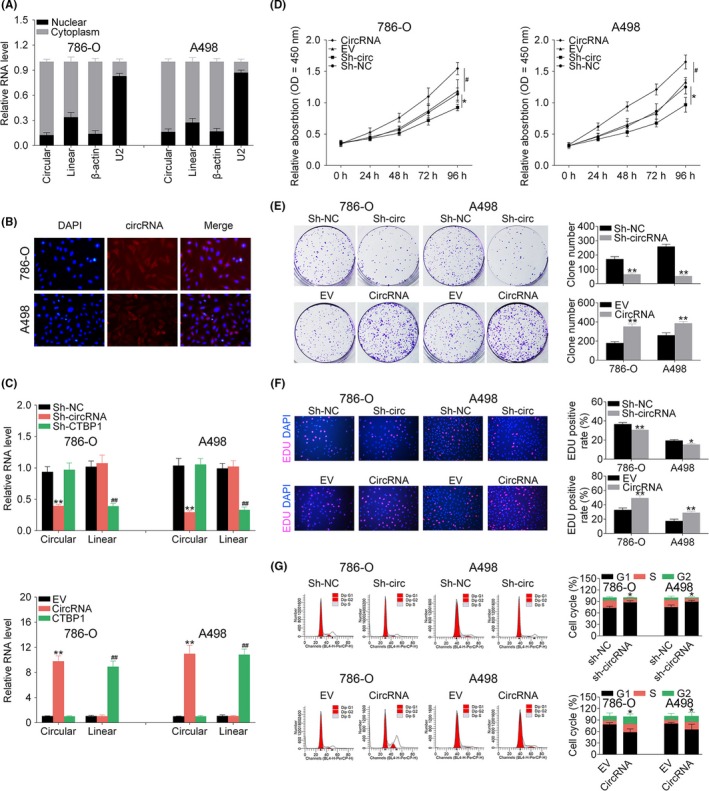
Hsa_circ_001895 promoted clear cell renal cell carcinoma (ccRCC) proliferation. A, Expression of hsa_circ_001895 in cytoplasm or nucleus of 786‐O and A498 cells detected by qRT‐PCR. B, Subcellular localization of hsa_circ_001895 in 786‐O and A498 cells by RNA‐FISH. C, Transfection efficiency of sh‐hsa_circ_001895, sh‐CTBP1, pcDNA‐hsa_circ_001895 and pcDNA‐CTBP1 in 786‐O and A498 cells detected by qRT‐PCR. D, Influence of hsa_circ_001895 on cell viability of 786‐O and A498 cells detected by CCK‐8. E, Influence of hsa_circ_001895 on cell proliferation of 786‐O and A498 cells detected by colony formation assay. F, Influence of hsa_circ_001895 on cell proliferation of 786‐O and A498 cells detected by 5‐ethynyl‐2′‐deoxyuridine (EdU) staining assay. G, Influence of hsa_circ_001895 on cell cycle of 786‐O and A498 cells detected by flow cytometry. *, **sh‐hsa_circ_001895 vs sh‐NC or pcDNA‐hsa_circ_001895 vs EV, P < .05, P < .01. # ##sh‐CTBP1 vs sh‐NC or pcDNA‐CTBP1 vs EV, P < .05, EV, P < .01
3.3. Hsa_circ_001895 promoted ccRCC migration and invasion and inhibited cell apoptosis
Wound‐healing assay indicated the suppression ability of hsa_circ_001895 knockdown on cell migration (Figure 3A). However, hsa_circ_001895 overexpression promoted cell migration (Figure 3A). Moreover, the suppression ability of hsa_circ_001895 knockdown or the promotion ability of hsa_circ_001895 overexpression on cell invasion (Figure 3B) was also confirmed by Transwell assay. Flow cytometry showed that hsa_circ_001895 could suppress cell apoptosis, whereas hsa_circ_001895 knockdown induced cell apoptosis (Figure 3C). As proteins involved in cell migration and invasion, E‐cadherin was increased and N‐cadherin was decreased by hsa_circ_001895 knockdown (Figure 3D). Moreover, as proteins involved in cell apoptosis, Bcl‐2 was decreased whereas Bax and Cleaved caspase 3 were increased by hsa_circ_001895 knockdown (Figure 3D). Similarly, hsa_circ_001895 overexpression showed the reverse effect on protein expression in ccRCC cells (Figure 3D), confirming that hsa_circ_001895 may account for the malignant phenotypes of ccRCC.
Figure 3.
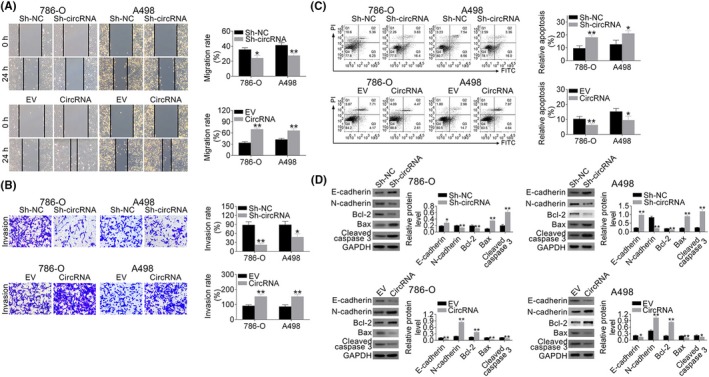
Hsa_circ_001895 promoted clear cell renal cell carcinoma (ccRCC) migration and invasion and inhibited cell apoptosis. A, Influence of hsa_circ_001895 on cell migration of 786‐O and A498 cells detected by wound‐healing assay. B, Influence of hsa_circ_001895 on cell invasion of 786‐O and A498 cells detected by Transwell assay. C, Influence of hsa_circ_001895 on cell apoptosis of 786‐O and A498 cells detected by flow cytometry. D, Influence of hsa_circ_001895 on protein expression of E‐cadherin, N‐cadherin, Bcl‐2, Bax and Cleaved caspase 3 in 786‐O and A498 cells detected by western blot. *, **sh‐hsa_circ_001895 vs sh‐NC or pcDNA‐hsa_circ_001895 vs EV, P < .05, P < .01
3.4. Negative correlation between hsa_circ_001895 and miR‐296‐5p
The potential binding targets of hsa_circ_001895 were predicted as miR‐296‐5p, miR‐520h and miR‐516a‐5p through CircInteractome (circRNA interactome) and starBase (Figure 4A). Dual luciferase reporter assay indicated the highest relative intensity of miR‐516a‐5p, and higher relative intensity of miR‐520h than miR‐296‐5p in HEK293 cells (Figure 4B). miR‐296‐5p was upregulated in 786‐O and A498 cells transfected with sh‐hsa_circ_001895, whereas miR‐516a‐5p and miR‐520h were not affected by hsa_circ_001895 knockdown (Figure 4C). Moreover, FISH showed colocalization of hsa_circ_001895 and miR‐296‐5p in the cytoplasm (Figure 4D). To further determine the binding ability between hsa_circ_001895 and miR‐296‐5p, dual luciferase reporter assay was conducted (Figure 4E). Results showed that miR‐296‐5p mimics decreased the luciferase activity of pmirGLO‐wt‐hsa_circ_001895, but had no effect on luciferase activity of pmirGLO‐mut‐hsa_circ_001895 (Figure 4F). RNA immunoprecipitation (RIP) assay showed that both hsa_circ_001895 and miR‐296‐5p were significantly enriched in Ago2‐containing beads compared with IgG‐containing beads or the input group (Figure 4G). Moreover, miR‐296‐5p was downregulated in ccRCC tissues (Figure 4H), and bivariate correlation analysis showed negative correlation between miR‐296‐5p and hsa_circ_001895 in ccRCC (Figure 4I). Collectively, these results indicated that hsa_circ_001895 could directly bind to miR‐296‐5p and inhibit its expression.
Figure 4.
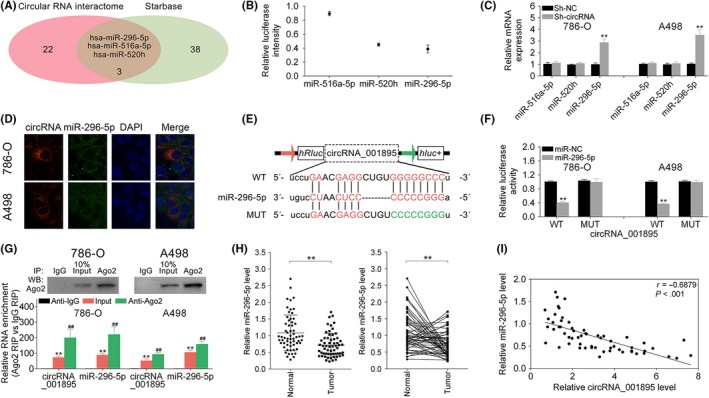
Negative correlation between hsa_circ_001895 and microRNA (miR)‐296‐5p. A, Potential binding targets of hsa_circ_001895 predicted by CircInteractome (circular RNA interactome) and starBase. B, Relative intensity of miR‐516a‐5p, miR‐520h and miR‐296‐5p in HEK293 cells. C, Influence of hsa_circ_001895 on miR‐516a‐5p, miR‐520h and miR‐296‐5p expression in 786‐O and A498 cells detected by qRT‐PCR. D, Subcellular localization of hsa_circ_001895 and miR‐296‐5p in 786‐O and A498 cells by RNA‐FISH. E, Wild‐type and mutant binding sites of miR‐296‐5p in hsa_circ_001895. F, Influence of miR‐296‐5p mimics on luciferase activities of pmirGLO‐wt‐hsa_circ_001895 or pmirGLO‐mut‐hsa_circ_001895 in 786‐O and A498 cells detected by qRT‐PCR. G, Enrichment of hsa_circ_001895 and miR‐296‐5p in Ago2‐containing beads of 786‐O and A498 cells. H, Expression of miR‐296‐5p in clear cell renal cell carcinoma (ccRCC) tissues and adjacent noncancer tissues detected by qRT‐PCR (N = 60). I, Negative correlation between miR‐296‐5p and hsa_circ_001895 in ccRCC patients. **sh‐hsa_circ_001895 vs sh‐NC, miR‐296‐5p mimics vs miR‐NC, Input vs Anti‐IgG, Tumor vs Normal tissues, P < .01. ##Anti‐Ago2 vs Anti‐IgG, P < .01
3.5. SOX12 was a direct target of miR‐296‐5p
Similarly, SOX12, NFIC and RNF44 were predicted as miR‐296‐5p binding targets through TargetScan, miRDB, miRTarBase, miRWalk and miRTargetLink Human (Figure 5A). Dual luciferase reporter assay indicated the highest relative intensity of RNF44, and higher relative intensity of SOX12 than NFIC in HEK293 cells (Figure 5B). Both mRNA (Figure 5C) and protein (Figure 5D) expression of NFIC and SOX12 were downregulated in cells transfected with sh‐hsa_circ_001895, whereas RNF44 was not affected by hsa_circ_001895 knockdown (Figure 5C,D). Dual luciferase reporter assay was also conducted (Figure 5E), and results showed that miR‐296‐5p mimics decreased the luciferase activity of pmirGLO‐wt‐SOX12, but had no effect on luciferase activity of pmirGLO‐mut‐SOX12 (Figure 5F). Transfection efficiency of miR‐296‐5p mimics or inhibitor were confirmed by qRT‐PCR (Figure 5G). Moreover, the expression of SOX12 was decreased by miR‐296‐5p mimics but increased by miR‐296‐5p inhibitor (Figure 5H). Upregulation of SOX12 in ccRCC tissues was confirmed by qRT‐PCR (Figure 5I). Moreover, the expression of SOX12 was positively related to the TNM stage of ccRCC by ISH (Figure 5J). Therefore, expression of SOX12 was significantly negatively correlated with miR‐296‐5p, but positively correlated with hsa_circ_001895 in ccRCC (Figure 5K). The upregulation of SOX12 was also confirmed by western blot (Figure 5L). Collectively, these results showed that miR‐296‐5p could directly bind to SOX12 and inhibit its expression.
Figure 5.
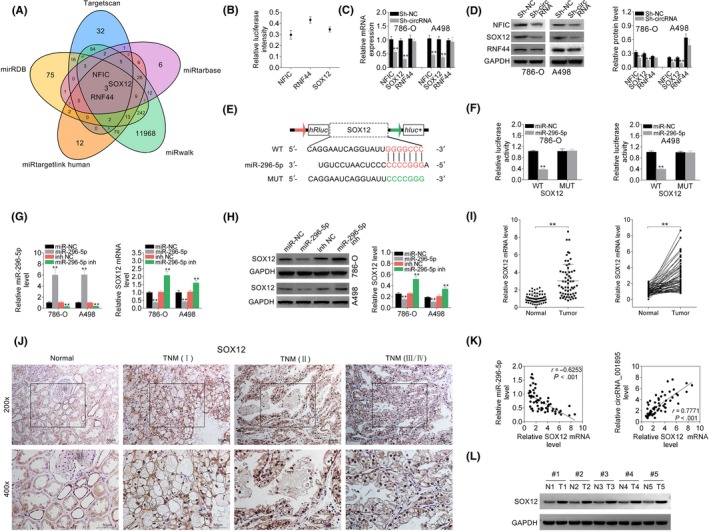
SOX12 was a direct target of microRNA (miR)‐296‐5p. A, Potential miR‐296‐5p binding targets predicted by TargetScan, miRDB, miRTarBase, miRWalk and miRTargetLink Human. B, Relative intensity of RNF44, SOX12 and NFIC in HEK293 cells. C, Influence of hsa_circ_001895 on mRNA expression of RNF44, SOX12 and nuclear factor I‐C (NFIC) in 786‐O and A498 cells detected by qRT‐PCR. D, Influence of hsa_circ_001895 on protein expression of RNF44, SOX12 and NFIC in 786‐O and A498 cells detected by qRT‐PCR. E, Wild‐type and mutant binding sites of miR‐296‐5p in SOX12. F, Influence of miR‐296‐5p mimics on luciferase activities of pmirGLO‐wt‐SOX12 or pmirGLO‐mut‐SOX12 in 786‐O and A498 cells detected by qRT‐PCR. G, Transfection efficiency of miR‐296‐5p mimics or inhibitor in 786‐O and A498 cells detected by qRT‐PCR. H, Influence of miR‐296‐5p on protein expression of SOX12 in 786‐O and A498 cells detected by western blot. I, mRNA expression of SOX12 in clear cell renal cell carcinoma (ccRCC) tissues and adjacent noncancer tissues detected by qRT‐PCR (N = 60). J, In situ hybridization (ISH) analysis of SOX12 expression in ccRCC tissues with different TNM stage. K, Negative correlation between miR‐296‐5p and SOX12 in ccRCC patients. Positive correlation between hsa_circ_001895 and SOX12 in ccRCC patients. L, Protein expression of SOX12 in ccRCC tissues and adjacent noncancer tissues detected by western blot. **sh‐hsa_circ_001895 vs sh‐NC, miR‐296‐5p mimics vs miR‐NC, miR‐296‐5p inhibitor vs inh NC, Tumor vs Normal tissues, P < .01
3.6. Hsa_circ_001895 knockdown inhibited ccRCC proliferation by sponging miR‐296‐5p
Clear cell renal cell carcinoma cells were cotransfected with sh‐hsa_circ_001895 and miR‐296‐5p inhibitor. First, CCK‐8 (Figure 6A) showed that that the inhibition of cell viability by sh‐hsa_circ_001895 was promoted by additional transfection with miR‐296‐5p inhibitor. miR‐296‐5p inhibitor reversed the inhibition ability on cell proliferation by colony formation (Figure 6B) and EdU staining (Figure 6C) assays. Moreover, cell cycle blocked by hsa_circ_001895 knockdown was promoted by additional transfection with miR‐296‐5p inhibitor (Figure 6D). Together, these results further suggested that hsa_circ_001895 knockdown inhibited ccRCC proliferation by sponging miR‐296‐5p.
Figure 6.
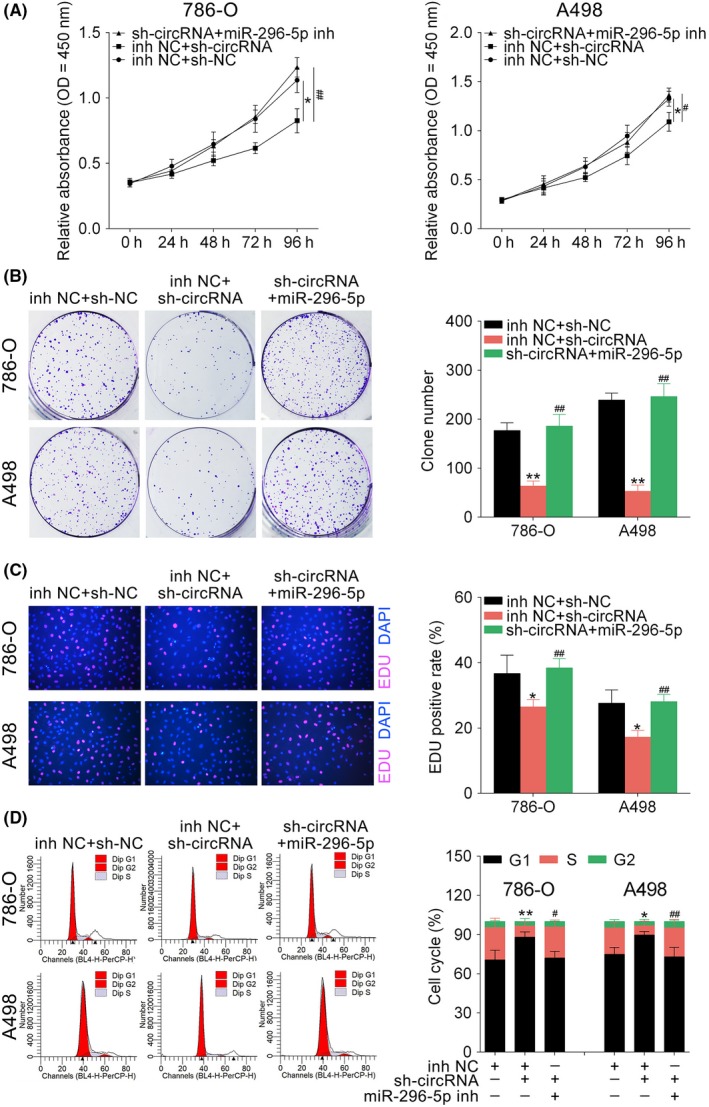
Hsa_circ_001895 knockdown inhibited clear cell renal cell carcinoma (ccRCC) proliferation by sponging microRNA (miR)‐296‐5p. A, Influence of hsa_circ_001895 and miR‐296‐5p on cell viability of 786‐O and A498 cells detected by CCK‐8. B, Influence of hsa_circ_001895 and miR‐296‐5p on cell proliferation of 786‐O and A498 cells detected by colony formation assay. C, Influence of hsa_circ_001895 and miR‐296‐5p on cell proliferation of 786‐O and A498 cells detected by 5‐ethynyl‐2′‐deoxyuridine (EdU) staining assay. D, Influence of hsa_circ_001895 and miR‐296‐5p on cell cycle of 786‐O and A498 cells detected by flow cytometry. *, **sh‐hsa_circ_001895 + inh NC vs sh‐NC + inh NC, P < .05, P < .01. #, ##sh‐hsa_circ_001895 + miR‐296‐5p inhibitor vs sh‐NC + inh NC, P < .05, P < .01
3.7. Hsa_circ_001895 knockdown inhibited ccRCC migration and invasion but induced cell apoptosis by sponging miR‐296‐5p
Migration (Figure 7A) and invasion (Figure 7B) abilities suppressed by sh‐hsa_circ_001895 were also reversed by additional transfection with miR‐296‐5p inhibitor. The promotion ability of sh‐hsa_circ_001895 on cell apoptosis (Figure 7C) was suppressed by additional miR‐296‐5p inhibitor. These results showed that hsa_circ_001895 knockdown suppressed ccRCC progression by sponging miR‐296‐5p. Moreover, 786‐O and A498 cells cotransfected with sh‐hsa_circ_001895 and miR‐296‐5p inhibitor showed the reverse effect on protein expression of E‐cadherin, N‐cadherin, Bcl‐2, Bax and Cleaved caspase 3 compared to sh‐hsa_circ_001895 transfection alone (Figure 7D).
Figure 7.
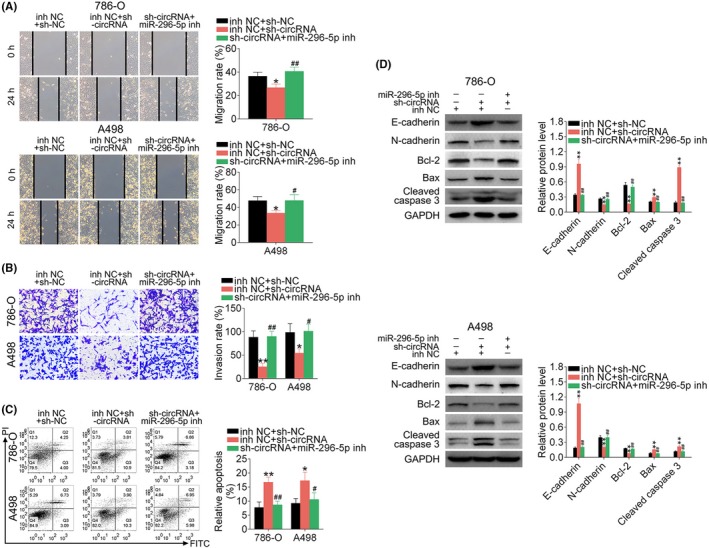
Hsa_circ_001895 knockdown inhibited clear cell renal cell carcinoma (ccRCC) migration and invasion but induced cell apoptosis by sponging microRNA (miR)‐296‐5p. A, Influence of hsa_circ_001895 and miR‐296‐5p on cell migration of 786‐O and A498 cells detected by wound‐healing assay. B, Influence of hsa_circ_001895 and miR‐296‐5p on cell invasion of 786‐O and A498 cells detected by Transwell assay. C, Influence of hsa_circ_001895 and miR‐296‐5p on cell apoptosis of 786‐O and A498 cells detected by flow cytometry. D, Influence of hsa_circ_001895 and miR‐296‐5p on protein expression of E‐cadherin, N‐cadherin, Bcl‐2, Bax and Cleaved caspase 3 in 786‐O and A498 cells detected by Transwell assay. *, **sh‐hsa_circ_001895 + inh NC vs sh‐NC + inh NC, P < .05, P < .01. #, ##sh‐hsa_circ_001895 + miR‐296‐5p inhibitor vs sh‐NC + inh NC, P < .05, P < .01. PI, propidium iodide
3.8. Hsa_circ_001895 knockdown inhibited in vivo ccRCC tumor
We inoculated 786‐O cells transfected with sh‐hsa_circ_001895 or sh‐NC into nude mice to explore the clinical application of hsa_circ_001895. First, transfection efficiency was determined by qRT‐PCR as shown in Figure 8A by downregulation of hsa_circ_001895 and upregulation of miR‐296‐5p. Moreover, intratumoral injection of sh‐hsa_circ_001895 inhibited tumor growth (Figure 8B), as shown by decreased tumor volume and weight (Figure 8C). Furthermore, full specimen staining with H&E showed morphological features of ccRCC tissues, and immunohistochemistry indicated that intratumoral injection of sh‐hsa_circ_001895 reduced the expression of SOX12, Ki67 and N‐cadherin, but induced E‐cadherin and Cleaved caspase 3 (Figure 8D). These results suggested that hsa_circ_001895 knockdown inhibited xenograft tumor growth through regulation of SOX12.
Figure 8.
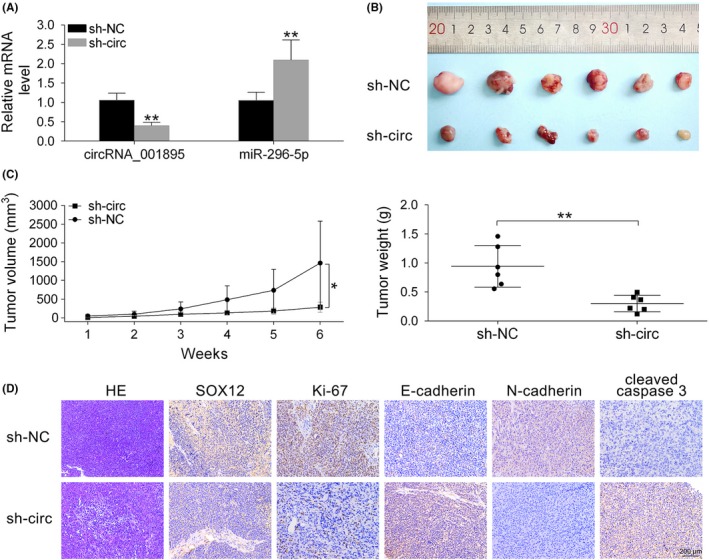
Hsa_circ_001895 knockdown inhibited in vivo clear cell renal cell carcinoma (ccRCC) tumor growth. A, Influence of sh‐hsa_circ_001895 on hsa_circ_001895 and microRNA (miR)‐296‐5p expression in mice intratumorally injected with lentiviral vector with hsa_circ_001895 knockdown or the negative control (sh‐NC). B, Effect of sh‐hsa_circ_001895 on ccRCC tumor growth in xenograft tumor mice. C, Influence of sh‐hsa_circ_001895 on tumor volume and weight. D, H&E staining shows morphological features of ccRCC tissues, and immunohistochemical staining was used to determine expression of SOX12, Ki‐67, E‐cadherin, N‐cadherin and Cleaved caspase 3 affected by sh‐hsa_circ_001895. Black bar, 200 μm. *, **sh‐hsa_circ_001895 vs sh‐NC, P < .05, P < .01
4. DISCUSSION
Recent study has indicated dysregulation of circRNAs in ccRCC and the association of circRNAs with malignant behavior in ccRCC.17 Hsa_circ_0001451 was downregulated in ccRCC tissues and correlated with the clinicopathological features and OS of ccRCC patients.18 circ‐ABCB10 was upregulated in ccRCC cell lines and correlated with pejorative prognosis in ccRCC.19 Herein, we found a novel upregulated circRNA, hsa_circ_001895, in ccRCC tissues. Hsa_circ_001895 was positively associated with the TNM stage of ccRCC, and predicted a poor prognosis in ccRCC patients, suggesting the potential regulatory ability of hsa_circ_001895 on ccRCC progression. However, due to the small sample size of our current clinical analysis (N = 60), significant relationship between high hsa_circ_001895 expression and other clinicopathological features of ccRCC patients may be not precise enough. A larger patient cohort is needed to strengthen the clinical significance of hsa_circ_001895 in ccRCC patients.
Circ‐ABCB10 overexpression19 or hsa_circ_0001451 knockdown18 promoted ccRCC proliferation and induced cell apoptosis in vitro, revealing the relationship between potential markers and therapeutic targets of circRNAs in ccRCC. Additionally, increasing evidence has shown the functional roles of circRNAs as promoters or inhibitors of cancer‐critical genes of ccRCC,20 thus involved in the regulation of tumor progression.17 circATP2B1 promoted ccRCC invasion through miR‐204‐3p‐mediated fibronectin 1 expression.21 CircRNAZNF609 promoted cell progression of ccRCC by sponging miR‐138‐5p targeted forkhead box P4.22 CircPCNXL2 promoted cell progression of ccRCC by sponging miR‐153 Zinc finger E‐box‐binding homeobox 2.23 Therefore, circRNAs, considered potential prognosis biomarkers of ccRCC, may not only contribute to early diagnosis, but also improve the individualized treatment of ccRCC patients.17
The present study showed that hsa_circ_001895 might be a potential novel target for ccRCC therapy. Consistent with the clinical results of hsa_circ_001895 in ccRCC, in vitro functional assays showed that hsa_circ_001895 promoted ccRCC progression of ccRCC, as well as inhibition of cell apoptosis. Moreover, hsa_circ_001895 knockdown inhibited ccRCC progression, but induced cell apoptosis. In vivo subcutaneous xenotransplanted tumor model showed, for the first time, that interference of hsa_circ_001895 could suppress in vivo tumorigenic ability of ccRCC, indicating the potential clinical application of hsa_circ_001895 in the treatment of ccRCC.
As the “oncogene” function of hsa_circ_001895 in ccRCC was found, we then determined the underlying mechanism. First, the “oncogene” role of hsa_circ_001895 in ccRCC depends on the promotion of cell apoptosis through targeting Bcl‐2, Bax and Cleaved caspase‐3. As an anti‐apoptotic protein, Bcl‐2 interacts with proapoptotic regulator, Bax, to regulate cell apoptosis in ccRCC.24 Activation of caspase‐3 induced cell apoptosis of ccRCC.25 High Bax and cleaved caspase expression or low expression of Bcl‐2 was associated with apoptosis of ccRCC. Our results showed that hsa_circ_001895 overexpression increased Bcl‐2, but decreased Bax and Cleaved caspase 3, thus inhibiting cell apoptosis. However, hsa_circ_001895 knockdown increased Bax and Cleaved caspase‐3, but decreased Bcl‐2, thus promoting cell apoptosis of ccRCC. Flow cytometry further confirmed the anti‐apoptotic role of hsa_circ_001895.
Other than promotion of cell apoptosis, the oncogenic role of hsa_circ_001895 on ccRCC also depends on the promotion of epithelial to mesenchymal transition (EMT). EMT is essential for the development of metastasis and contributes to the unfavorable prognosis in ccRCC.26, 27 EMT, as shown by downregulation of E‐cadherin accompanied by upregulation of N‐cadherin, could enhance metastasis of ccRCC.28 Both in vivo and in vitro results in the present study showed that hsa_circ_001895 knockdown could increase E‐cadherin and decrease N‐cadherin to inhibit EMT and metastasis of ccRCC. Moreover, EMT also participates in the promotion of ccRCC cancer stemness.29 Considering that hsa_circ_001895 was associated with EMT of ccRCC, further investigation of hsa_circ_001895 on stemness properties of ccRCC is needed.
Generally, circRNAs regulate gene expression by sponging miRNAs.30 By the means of dual luciferase reporter assay and RIP, miR‐296‐5p was validated as the direct binding target for hsa_circ_001895. miR‐296‐5p is a tumor suppressor in various tumors.31, 32, 33 The present study indicated that hsa_circ_001895 knockdown inhibited ccRCC progression but induced cell apoptosis through sponging miR‐296‐5p. It is the first time that miR‐296‐5p is associated with ccRCC progression. As is well known, von Hippel‐Lindau tumor‐suppressor gene (VHL), a powerful suppressor of ccRCC, is mutated in most ccRCC cell lines, including 786‐O.34 VHL‐mediated miRNAs might be involved in regulation of renal cancer progression.35 miRNAs could target VHL‐hypoxia‐inducible factor 1‐alpha pathway to predict renal cell carcinoma risk.36 Whether the circ_001895‐miR‐296‐5p axis participates in VHL‐mediated ccRCC progression needs to be further studied. Moreover, SOX12 was identified as a target of miR‐296‐5p. SOX proteins contain a conserved DNA‐binding domain to participate in numerous important biological processes, such as cell differentiation during embryonic development.37 Aberrant embryonic development has been considered to be associated with cancer development.38 Moreover, EMT has also been involved in embryonic development during cancer development. Therefore, SOX12 may be associated with EMT during ccRCC progression.39 SOX12 was found to promote hepatocellular carcinoma metastasis40 or inhibit colon cancer metastasis41 by different signaling pathways. More recently, SOX12 was shown to be a predictive marker of prognosis in ccRCC patients.42 Our study showed that hsa_circ_001895 knockdown suppressed xenograft ccRCC tumor growth by SOX12, further confirming the important regulatory ability of SOX12 on ccRCC progression. However, the underlying signaling pathway involved in the regulation of SOX12 on ccRCC progression needs to be further investigated.
Generally, our results showed that hsa_circ_001895 is an “oncogene,” the knockdown of which inhibited ccRCC progression and promoted cell apoptosis through miR‐296‐5p‐mediated SOX12. Relationship between the hsa_circ_001895/miR‐296‐5p/SOX12 regulatory axis and ccRCC progression suggests the potential application of hsa_circ_001895 in ccRCC.
DISCLOSURE
Authors declare no conflicts of interest for this article.
Chen Z, Xiao K, Chen S, Huang Z, Ye Y, Chen T. Circular RNA hsa_circ_001895 serves as a sponge of microRNA‐296‐5p to promote clear cell renal cell carcinoma progression by regulating SOX12. Cancer Sci. 2020;111:713–726. 10.1111/cas.14261
Contributor Information
Yunlin Ye, Email: YunlinYeset@163.com.
Tong Chen, Email: TongChenswt@163.com.
REFERENCES
- 1. Scelo G, Larose TL. Epidemiology and risk factors for kidney cancer. J Clin Oncol. 2018;36:3574‐3581. [DOI] [PMC free article] [PubMed] [Google Scholar]
- 2. Ghali MGZ. Role of the medullary lateral tegmental field in sympathetic control. J Integr Neurosci. 2017;16:189‐208. [DOI] [PubMed] [Google Scholar]
- 3. Jemal A, Bray F, Center MM, Ferlay J, Ward E, Forman D. Global cancer statistics. CA Cancer J Clin. 2011;61(2):69‐90. [DOI] [PubMed] [Google Scholar]
- 4. Siegel RL, Miller KD, Jemal A. Cancer statistics, 2017. CA Cancer J Clin. 2017;67(1):7‐30. [DOI] [PubMed] [Google Scholar]
- 5. Powles T, Staehler M, Ljungberg B, et al. European Association of Urology Guidelines for clear cell renal cancers that are resistant to vascular endothelial growth factor receptor‐targeted therapy. Eur Urol. 2016;70(5):705‐706. [DOI] [PubMed] [Google Scholar]
- 6. Powles T, Staehler M, Ljungberg B, et al. Updated EAU guidelines for clear cell renal cancer patients who fail VEGF targeted therapy. Eur Urol. 2016;69(1):4‐6. [DOI] [PubMed] [Google Scholar]
- 7. Bahouth Z, Sabo E, Nativ O, et al. Relationship between clinical factors and the occurrence of post‐operative acute kidney injury in patients undergoing nephron‐sparing surgery. J Mol Clin Med. 2018;1(1):47‐50. [Google Scholar]
- 8. Qu S, Yang X, Li X, et al. Circular RNA: a new star of noncoding RNAs. Cancer Lett. 2015;365(2):141‐148. [DOI] [PubMed] [Google Scholar]
- 9. Conn SJ, Pillman KA, Toubia J, et al. The RNA binding protein quaking regulates formation of circRNAs. Cell. 2015;160(6):1125‐1134. [DOI] [PubMed] [Google Scholar]
- 10. Gao Y, Wang J, Zhao F. CIRI: an efficient and unbiased algorithm for de novo circular RNA identification. Genome Biol. 2015;164:4. [DOI] [PMC free article] [PubMed] [Google Scholar]
- 11. Guarnerio J, Bezzi M, Jeong JC, et al. Oncogenic role of fusion‐circRNAs derived from cancer‐associated chromosomal translocations. Cell. 2016;166(4):1055‐1056. [DOI] [PubMed] [Google Scholar]
- 12. Wang K, Sun Y, Tao W, Fei X, Chang C. Androgen receptor (AR) promotes clear cell renal cell carcinoma (ccRCC) migration and invasion via altering the circHIAT1/miR‐195‐5p/29a‐3p/29c‐3p/CDC42 signals. Cancer Lett. 2017;394:1‐12. [DOI] [PubMed] [Google Scholar]
- 13. Huang S, Yang B, Chen BJ, et al. The emerging role of circular RNAs in transcriptome regulation. Genomics. 2017;109(5–6):401‐407. [DOI] [PubMed] [Google Scholar]
- 14. Hansen TB, Jensen TI, Clausen BH, et al. Natural RNA circles function as efficient microRNA sponges. Nature. 2013;495(7441):384‐388. [DOI] [PubMed] [Google Scholar]
- 15. Ambros V. The functions of animal microRNAs. Nature. 2004;431(7006):350‐355. [DOI] [PubMed] [Google Scholar]
- 16. Zhang Y, Liang W, Zhang P, et al. Circular RNAs: emerging cancer biomarkers and targets. J Exp Clin Cancer Res. 2017;36(1):152. [DOI] [PMC free article] [PubMed] [Google Scholar]
- 17. Verma S, Gupta S. Noncoding RNAs and its implication as biomarkers in renal cell carcinoma: a systematic analysis. Ann Urol Oncol. 2019;1‐11. [Google Scholar]
- 18. Wang G, Xue W, Jian W, et al. The effect of Hsa_circ_0001451 in clear cell renal cell carcinoma cells and its relationship with clinicopathological features. J Cancer. 2018;9(18):3269‐3277. [DOI] [PMC free article] [PubMed] [Google Scholar]
- 19. Huang Y, Zhang Y, Jia L, Liu C, Xu F. Circular RNA ABCB10 promotes tumor progression and correlates with pejorative prognosis in clear cell renal cell carcinoma. Int J Biol Markers. 2019;34(2):176‐183. [DOI] [PubMed] [Google Scholar]
- 20. Yu CY, Kuo HC. The emerging roles and functions of circular RNAs and their generation. J Biomed Sci. 2019;26(1):29. [DOI] [PMC free article] [PubMed] [Google Scholar]
- 21. Han Z, Zhang Y, Sun Y, et al. ERbeta‐mediated alteration of circATP2B1 and miR‐204‐3p signaling promotes invasion of clear cell renal cell carcinoma. Cancer Res. 2018;78(10):2550‐2563. [DOI] [PubMed] [Google Scholar]
- 22. Xiong Y, Zhang J, Song C. CircRNA ZNF609 functions as a competitive endogenous RNA to regulate FOXP4 expression by sponging miR‐138‐5p in renal carcinoma. J Cell Physiol. 2019;234(7):10646‐10654. [DOI] [PubMed] [Google Scholar]
- 23. Zhou B, Zheng P, Li Z, et al. CircPCNXL2 sponges miR‐153 to promote the proliferation and invasion of renal cancer cells through upregulating ZEB2. Cell Cycle. 2018;17(23):2644‐2654. [DOI] [PMC free article] [PubMed] [Google Scholar]
- 24. Gobe G, Rubin M, Williams G, Sawczuk I, Buttyan R. Apoptosis and expression of Bcl‐2, Bcl‐XL, and Bax in renal cell carcinomas. Cancer Invest. 2002;20(3):324‐332. [DOI] [PubMed] [Google Scholar]
- 25. Wu XX, Kakehi Y, Mizutani Y, Lu J, Terachi T, Ogawa O. Activation of caspase‐3 in renal cell carcinoma cells by anthracyclines or 5‐fluorouracil. Int J Oncol. 2001;19(1):19‐24. [DOI] [PubMed] [Google Scholar]
- 26. Hwang HS, Go H, Park JM, et al. Epithelial‐mesenchymal transition as a mechanism of resistance to tyrosine kinase inhibitors in clear cell renal cell carcinoma. Lab Invest. 2019;99(5):659‐670. [DOI] [PubMed] [Google Scholar]
- 27. Mlcochova H, Machackova T, Rabien A, et al. Epithelial‐mesenchymal transition‐associated microRNA/mRNA signature is linked to metastasis and prognosis in clear‐cell renal cell carcinoma. Sci Rep. 2016;6:31852. [DOI] [PMC free article] [PubMed] [Google Scholar]
- 28. Li Q, Hou L, Ding G, et al. KDM6B induces epithelial‐mesenchymal transition and enhances clear cell renal cell carcinoma metastasis through the activation of SLUG. Int J Clin Exp Pathol. 2015;8(6):6334‐6344. [PMC free article] [PubMed] [Google Scholar]
- 29. Singla M, Kumar A, Bal A, Sarkar S, Bhattacharyya S. Epithelial to mesenchymal transition induces stem cell like phenotype in renal cell carcinoma cells. Cancer Cell Int. 2018;18:57. [DOI] [PMC free article] [PubMed] [Google Scholar]
- 30. Ebbesen KK, Kjems J. MicroRNA sponging by a new hearty circRNA. Noncoding RNA Investig. 2017;1:16‐26. [Google Scholar]
- 31. Lee KH, Lin FC, Hsu TI, et al. MicroRNA‐296‐5p (miR‐296‐5p) functions as a tumor suppressor in prostate cancer by directly targeting Pin1. Biochim Biophys Acta. 2014;1843(9):2055‐2066. [DOI] [PubMed] [Google Scholar]
- 32. Zhou SL, Tang QL, Zhou SX, Ren RZ. MiR‐296‐5p suppresses papillary thyroid carcinoma cell growth via targeting PLK1. Eur Rev Med Pharmacol Sci. 2019;23(5):2084‐2091. [DOI] [PubMed] [Google Scholar]
- 33. Shi DM, Li LX, Bian XY, et al. miR‐296‐5p suppresses EMT of hepatocellular carcinoma via attenuating NRG1/ERBB2/ERBB3 signaling. J Exp Clin Cancer Res. 2018;37(1):294. [DOI] [PMC free article] [PubMed] [Google Scholar]
- 34. Gnarra JR, Tory K, Weng Y, et al. Mutations of the VHL tumour suppressor gene in renal carcinoma. Nat Genet. 1994;7(1):85‐90. [DOI] [PubMed] [Google Scholar]
- 35. Neal CS, Michael MZ, Rawlings LH, Van der Hoek MB, Gleadle JM. The VHL‐dependent regulation of microRNAs in renal cancer. BMC Med. 2010;8(1):64. [DOI] [PMC free article] [PubMed] [Google Scholar]
- 36. Wei H, Ke HL, Lin J, Shete S, Wood CG, Hildebrandt MAT. MicroRNA target site polymorphisms in the VHL‐HIF1α pathway predict renal cell carcinoma risk. Mol Carcinog. 2014;53(1):1‐7. [DOI] [PMC free article] [PubMed] [Google Scholar]
- 37. Kamachi Y, Kondoh H. Sox proteins: regulators of cell fate specification and differentiation. Development. 2013;140(20):4129‐4144. [DOI] [PubMed] [Google Scholar]
- 38. Hockel M. Morphogenetic fields of embryonic development in locoregional cancer spread. Lancet Oncol. 2015;16(3):e148‐e151. [DOI] [PubMed] [Google Scholar]
- 39. Kim DH, Xing T, Yang Z, Dudek R, Lu Q, Chen YH. Epithelial mesenchymal transition in embryonic development, tissue repair and cancer: a comprehensive overview. J Clin Med. 2017;7(1):1. [DOI] [PMC free article] [PubMed] [Google Scholar]
- 40. Huang W, Chen Z, Shang X, et al. Sox12, a direct target of FoxQ1, promotes hepatocellular carcinoma metastasis through up‐regulating Twist1 and FGFBP1. Hepatology. 2015;61(6):1920‐1933. [DOI] [PubMed] [Google Scholar]
- 41. Duquet A, Melotti A, Mishra S, et al. A novel genome‐wide in vivo screen for metastatic suppressors in human colon cancer identifies the positive WNT‐TCF pathway modulators TMED3 and SOX12. EMBO Mol Med. 2014;6(7):882‐901. [DOI] [PMC free article] [PubMed] [Google Scholar]
- 42. Gu W, Wang B, Wan F, et al. SOX2 and SOX12 are predictive of prognosis in patients with clear cell renal cell carcinoma. Oncol Lett. 2018;15(4):4564‐4570. [DOI] [PMC free article] [PubMed] [Google Scholar]