Abstract
Glypican‐3 (GPC3) is a cancer antigen expressed in approximately 80% of hepatocellular carcinomas (HCC) and is secreted into the blood. To confirm the effectiveness of GPC3 as a biomarker in HCC, we analyzed the relationship between GPC3 expression levels in cancer cells and in blood in 56 patients with HCC. Preoperative plasma GPC3 levels were determined with an immunoassay, and expression of GPC3 in resected tumors was analyzed by immunohistochemical staining. Median plasma GPC3 level in all HCC cases was 4.6 pg/mL, and tended to be higher in patients with hepatitis C virus (HCV)‐related HCC (HCV group) (9.9 pg/mL) than in patients with hepatitis B virus (HBV)‐related HCC (HBV group) (2.6 pg/mL) or in those without virus infection (None group) (3.0 pg/mL), suggesting that the virus type most likely influences GPC3 secretion. Median percentage of GPC3+ cells in tumors was also higher in the HCV (26.2%) and HBV (11.1%) groups than in the None group (4.2%). In the HCV group, there was a positive correlation between the two parameters (r = 0.66, P < .01). Moreover, receiver operating characteristic analysis predicted >10% GPC3+ cells in a tumor if the cut‐off value was 6.8 pg/mL (sensitivity 80%, specificity 100%; area under the curve 0.875, 95% confidence interval 0.726‐1) in the HCV group. Plasma concentration of GPC3 could be a predictive marker of tumoral GPC3 expression in patients with HCV‐related HCC, suggesting a useful biomarker for immunotherapies targeting GPC3, although larger‐scale validations are needed.
Keywords: glypican‐3, hepatitis virus, hepatocellular carcinoma, immunohistochemical staining, plasma glypican‐3
Glypican‐3 (GPC3) is a cancer antigen expressed in approximately 80% of hepatocellular carcinomas (HCC) and is secreted into the blood. We analyzed the relationship between GPC3 expression levels in cancer cells and in blood in 56 patients with HCC. In conclusion, plasma concentration of GPC3 could be a predictive marker of tumoral GPC3 expression in patients with HCV‐related HCC, suggesting a useful biomarker for immunotherapies targeting GPC3.
1. INTRODUCTION
Hepatocellular carcinoma (HCC) is the fourth leading cause of cancer‐related death worldwide, which is expected to increase in many countries, especially in Asia, in the future.1 Despite progress in surgical and non‐surgical therapies, the prognosis of HCC remains poor. The multikinase inhibitor sorafenib was reported to prolong median survival and the time to progression for HCC patients, and lenvatinib was found to be non‐inferior to sorafenib with regards to improving overall survival in cases of untreated advanced HCC.2, 3 Nevertheless, new biomarkers and molecular targets are urgently needed to improve the prognosis.
Glypican‐3 (GPC3) is an oncofetal proteoglycan that is bound to the cell surface by a glycosylphosphatidylinositol anchor.4 GPC3 is expressed in various fetal tissues (ie, liver, lung, kidney, and placenta), but is not observed in normal postnatal tissues; however, GPC3 is expressed in HCC, melanomas, ovarian clear cell carcinoma, and in certain childhood cancers (hepatoblastomas, nephroblastomas, and yolk sac tumors).5, 6, 7 Recent immunohistochemistry (IHC) studies have suggested that GPC3 can also be expressed in other tumors, including gastric cancer, colorectal cancer, non‐small cell lung cancer, thyroid cancers, renal cancer, bladder cancer, and breast cancer.8, 9, 10, 11, 12
Furthermore, a strong GPC3 IHC score was found to be of prognostic value for HCC, as it was significantly correlated with shorter overall survival (OS) and disease‐free survival (DFS).13, 14, 15 Thus, in an attempt to effectively target these strongly malignant and potent tumors, we previously developed GPC3‐derived peptide vaccines, which were assessed in clinical trials.16, 17, 18, 19, 20, 21 In the future, we envision an array of GPC3‐based strategies besides cancer vaccines, including their application in adoptive immunotherapy with T‐cell receptor‐ or chimeric antigen receptor‐transduced T cells.22 To enhance the clinical effects and efficiently allocate these agents to patients, it is necessary to develop a biomarker that would enable selecting patients who are most likely to benefit from these treatments.
GPC3 is also released into the serum of HCC patients where it undergoes cleavage at its central region into its N‐ and C‐terminal forms by the enzyme furin.23 GPC3 is also considered to exist in a full‐length form, as in the membrane‐bound state, with numerous intermolecular disulfide bonds.24, 25 Although many studies have reported the potential utility of GPC3 as a tumor marker, the majority of these studies detected only the N‐ or C‐terminal subunit.6, 25, 26, 27 Moreover, few studies have precisely analyzed the correlation of plasma GPC3 levels and GPC3 expression in tumors. Traditionally, pretreatment GPC3 expression in tumors could only be assessed by a small biopsy specimen, which is highly invasive and unreliable owing to intratumoral heterogeneity.28 We recently developed a measurement system specific to full‐length GPC3 (FL‐GPC3) in the blood.29 In the previous study, we developed a conventional chromogenic sandwich ELISA system that quantified antigen concentration using the absorbance of TMB.30 The antibody set used in the system was a 3‐D structure‐recognizing antibody comprising two monoclonal antibodies that could capture full‐length GPC3 in the form of a sandwich. However, it was difficult to sufficiently identify antibody‐binding sites using this assay. The measurement system used in the present study was a fully automatic high‐throughput immunoassay system, HISCLTM‐800 (Sysmex Co.) that has a wider dynamic range and higher sensitivity. The newly established antibody set used in the present study has higher affinity than that used in the previous study, and its binding site is clear. Therefore, we believe that the measurement system used in this study has higher sensitivity than that used in the previous study.
In the present study, we evaluated whether this novel system could contribute to the prediction of GPC3 expression in HCC patients as a useful, non‐invasive biomarker. Although GPC3 has been reported to be expressed in several tumors in addition to HCC, it remains unclear whether GPC3 is also present in the blood of patients with these cancers. Therefore, we also evaluated plasma and tumoral GPC3 levels in patients with several tumor types. Confirmation of such correlations would allow for predicting the expression of GPC3 by pretreatment liquid biopsy to more effectively determine prognosis and select patients who are eligible for GPC3‐targeting immunotherapies.
2. MATERIALS AND METHODS
2.1. Patients and plasma samples
Preoperative plasma samples were collected from 56 patients with HCC who underwent surgical resection at the National Cancer Center East (NCCE) Japan between 2015 and 2017. After receiving appropriate consent, we also used samples from patients with other cancer types which had been stored at the National Cancer Center Biobank or in our laboratory, including breast cancer (n = 10), colorectal cancer (n = 20), malignant lymphoma (n = 20), gastric cancer (n = 20), thyroid cancer (n = 20), esophageal cancer (n = 20), renal cancer (n = 20), prostate cancer (n = 20), biliary cancer (n = 20), adenocarcinoma of the lung (n = 20), squamous cell carcinoma of the lung (n = 20), bladder cancer (n = 20), and pancreatic cancer (n = 20). There was an equal number of samples from men and women in all groups except for breast and prostate cancer samples. Other samples obtained from patients with hepatitis C virus (HCV)‐related HCC (n = 248) which had been collected pre‐ or post‐treatment and stored at Ogaki Municipal Hospital (OMH) were also evaluated. Written informed consent was obtained from all patients.
Healthy donors (n = 60; 30 men and 30 women) were invited by the National Cancer Center, Center for Public Health Sciences, Japan to participate, and they all agreed in writing to use their samples for research. Other preoperative plasma samples were also collected from 37 patients with HCC who underwent surgical resection at the NCCE between 2008 and 2010. This study was approved by the NCCE (approval number: 2014‐355) and OMH, and conformed with the ethical guidelines of the 1975 Declaration of Helsinki.
2.2. Measurement of plasma GPC3 and alpha‐fetoprotein
To assess the levels of plasma GPC3, FL‐GPC3 was measured using the HISCLTM‐800 (Sysmex Co.) automated immunoassay device.29 This system involves a sandwich assay using an antibody recognizing the N‐terminus of GPC3 for capture and an antibody recognizing the C‐terminus for detection. Serum AFP concentrations were measured using a commercially available electrochemiluminescence immunoassay kit (Roche).
2.3. Immunohistochemistry staining and analysis
Immunohistochemistry staining was carried out by the tyramide signal amplification method using an Opal IHC kit (PerkinElmer) according to the manufacturer’s instructions. In patients with multiple HCC, the largest tumor resected was analyzed. This analysis uses microwave treatment to remove primary and secondary antibodies while retaining the fluorescent signal. Tissue sections (3 μm in thickness) were cut from each formalin‐fixed, paraffin‐embedded tumor specimen and then baked at 60°C onto adhesive glass slides for 30 minutes before deparaffinization. The primary antibody used was anti‐GPC3 (clone 1G12, 1:200 dilution; BioMosaics), and spectra DAPI (PerkinElmer) was used for staining of nuclei. Tris‐EDTA (pH 9) buffer was used for microwave heating before GPC3 staining. Opal fluorophores (PerkinElmer) were used for labeling the primary antibody. A HRP‐labeled secondary detection system (EnVision Plus; DAKO) was used as a catalyst for fluorophore‐conjugated tyramide.
Fluorescently labeled images (669 × 500 μm each) of the tumor (20 fields) were captured with an automated imaging system (Vectra ver. 3.0; PerkinElmer). Image analysis software (InForm; PerkinElmer) was used to detect GPC3+ cells and measure their fluorescence intensity. These cells were quantified using an analytical software program (Spotfire; TIBCO) and their percentage among total cells was then calculated.
2.4. Statistical analysis
Statistical analyses were carried out using the R software package (The R Foundation for Statistical Computing; http://www.r-project.org). Patient characteristics were compared by Fisher’s exact tests for nominal variables and by the Mann‐Whitney U test for continuous variables. Survival rates were analyzed by the Kaplan‐Meier method and log‐rank test. Cut‐off values were determined by receiver operating characteristic (ROC) curves and area under the curve (AUC) analyses, and Spearman rank correlation was used for correlation analysis. Statistical significance was defined as P < .05.
3. RESULTS
3.1. Levels of plasma GPC3 alter over time and could be a specific marker for HCC
We previously measured the concentrations of plasma GPC3 in another dataset including 37 patients with HCC who underwent radical surgery between 2008 and 2010. Median value tended to be higher than that of the current dataset (between 2015 and 2017) (Figure S1). This suggested the potential time‐dependent change of plasma GPC3 concentration in patients with HCC. Moreover, the plasma GPC3 concentration in patients with HCC (both datasets) was significantly higher than that in healthy donors (P < .01 and P = .01). Meanwhile, that in patients with various other types of carcinomas was almost the same as that in healthy donors, indicating that plasma GPC3 could be a specific marker for HCC (Figure S1).
3.2. Patient characteristics
Clinical and demographic characteristics of the 56 patients with HCC whose preoperative plasma GPC3 levels were measured and resected specimens were evaluated by immunohistochemical staining are summarized in Table 1. Forty‐two patients were male, and median age was 69.0 years. Forty patients (71.4%) had a hepatic virus infection, and all patients had Child‐Pugh class A disease. Pathological stage was determined according to the TNM classification of the UICC,31 showing that almost all patients had stage I or II disease. Mean tumor size was 37.1 mm. Moreover, 67.9% of the patients were diagnosed with vascular invasion and 82.1% had chronic hepatitis. Median preoperative plasma GPC3 level was 4.6 pg/mL and mean proportion of GPC3+ cells was 22.5%.
Table 1.
Characteristics of 56 patients with HCC whose preoperative plasma GPC3 levels were measured and resected specimens were evaluated by immunohistochemical staining
| Factor | n = 56 | |
|---|---|---|
| Age (y) | Median (range) | 69.0 (40‐84) |
| Gender | M/F | 42/14 |
| Hepatic viral infection | HCV/HBV/none | 25/15/16 |
| No. of tumors | Solitary/multiple | 42/14 |
| Stage | I/II/III | 26/25/5 |
| Tumor size, mm, median (range) | 27.5 (9.0‐130) | |
| ≥30 mm/<30 mm | 27/29 | |
| Differentiation of tumor | Well/moderate/poor | 1/54/0 |
| Vascular invasion | Negative/positive | 38/18 |
| Liver condition | Normal/chronic hepatitis/cirrhosis | 3/46/7 |
| Plasma GPC3 (pg/mL) | Mean ± SD | 20.9 ± 62.3 |
| Median (range) | 4.6 (0.5‐384.3) | |
| Proportion of GPC3+ cells (%) | Mean ± SD | 22.5 ± 22.9 |
| Median (range) | 12.3 (0‐84.8) |
Abbreviations: GPC3, glypican‐3; HBV, hepatitis B virus; HCV, hepatitis C virus.
3.3. Virus infection type strongly influences the secretion and expression of GPC3
We next examined the factors that most strongly affected plasma GPC3 levels (Table S1). When classified by virus type, median plasma GPC3 level in patients with HCV infection (HCV group) tended to be higher than that of patients with HBV infection (HBV group) and in those without virus infection (P = .06) (Table S2, Figure 1A), suggesting that virus type might play the greatest role in GPC3 secretion. Similar trends were also observed in the 2008‐2010 dataset (Table S3). Proportion of HCV patients dropped from 62% to 45% between the two datasets, suggesting that the above‐mentioned chronological change in GPC3 plasma levels was likely related to the change in the proportion of patients with HCV or HBV.
Figure 1.
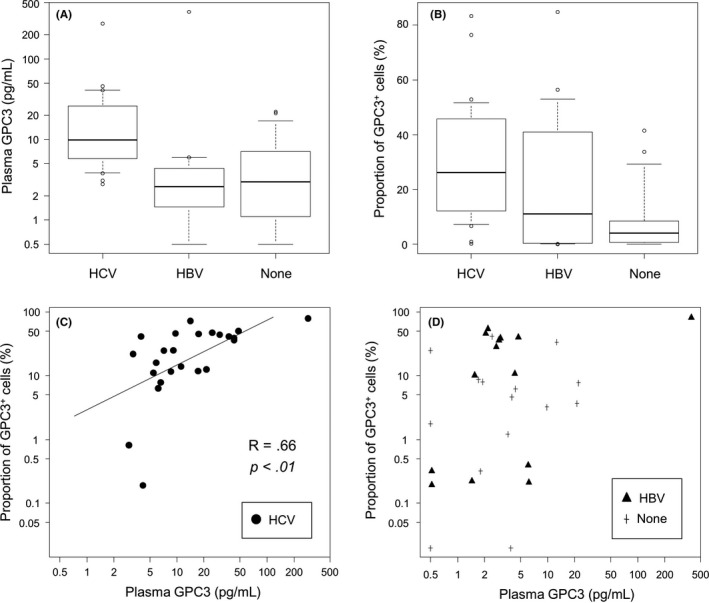
Analysis of plasma glypican‐3 (GPC3) levels and proportions of GPC3+ cells among each virus group. A, Box plot of plasma GPC3 levels across virus types. B, Box plot of proportions of GPC3+ cells across virus types. C, Correlation between plasma GPC3 levels and proportions of GPC3+ cells in the hepatitis C virus (HCV) group, and (D) in other groups. HBV, hepatitis B virus
In addition, the proportion of GPC3+ cells in tumors was higher in the HCV and HBV groups than in the None group (HCV vs None; P < .01, HBV vs None; P = .14) (Table 2, Figure 1B). There were no significant differences in the other factors assessed according to virus type.
Table 2.
Patient characteristics according to viral infection
| HCV (n = 25) | HBV (n = 15) | None (n = 16) | ||
|---|---|---|---|---|
| Age (y) | Median (range) | 71 (54‐83) | 65 (40‐80) | 71 (62‐84) |
| Gender | M/F | 18/7 | 11/4 | 12/4 |
| No. of tumors | Solitary/multiple | 15/10 | 14/1 | 13/3 |
| Stage | I/II/III | 9/14/2 | 11/3/1 | 6/5/5 |
| Tumor size (mm) | Median (range) | 30 (13‐130) | 21 (9‐110) | 39 (15‐105) |
| Vascular invasion | Negative/positive | 17/8 | 12/3 | 9/7 |
| ICGR15 (%) | Mean ± SD | 15.1 ± 8.5 | 12.0 ± 4.2 | 14.0 ± 4.4 |
| Liver condition | Normal/chronic hepatitis/cirrhosis | 0/20/5 | 0/15/0 | 3/11/2 |
| New Inuyama classification | 0/1/2/3/4 | 1/7/9/5/3 | 0/8/4/2/1 | 0/6/3/2/2 |
| Plasma GPC3 (pg/mL) | Median (range) | 9.9 (2.8‐273) | 2.6 (0.5‐384) | 3.0 (0.5‐22.1) |
| Proportion of GPC3+ cells (%) | Mean ± SD | 30.2 ± 22.5 | 24.0 ± 26.5 | 9.1 ± 12.7 |
| Median (range) | 26.2 (0.2‐83.3) | 11.1 (0.0‐84.8) | 4.2 (0.0‐41.4) |
Abbreviations: GPC3, glypican‐3; HBV, hepatitis B virus; HCV, hepatitis C virus; ICGR15, indocyanine green retention rate at 15 min.
Figure 2.
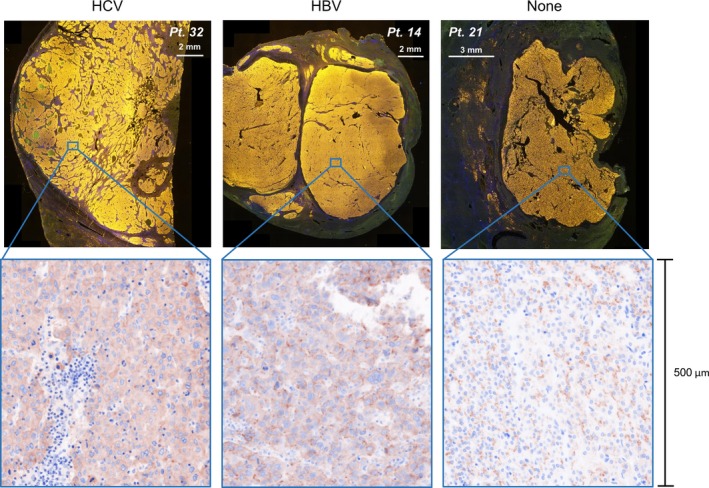
Evaluation of glypican‐3 (GPC3) expression in hepatocellular carcinoma (HCC) tissue. Upper photographs show representative images of fluorescence micrographs of HCC tissues among each virus group. GPC3 labeling appears as a yellow color. Lower photographs show 3,3′‐diaminobenzidine (DAB) single staining images. HBV, hepatitis B virus
Next, we analyzed correlation between plasma GPC3 concentration and the proportion of GPC3+ cells in the tumors. There was a significant positive correlation between these two factors in the HCV group (R = .66, P < .01) (Figure 1C), whereas no such correlation was observed in the HBV or None group (HBV, R = .35, P = .22; None, R = .26, P = .34) (Figure 1D). These results further suggested that the variation in GPC3 expression and secretion depended on virus type, with high secretion and expression in the HCV group, high expression and low secretion in the HBV group, and low secretion and expression in the None group. We also analyzed differences in the fluorescence intensity of GPC3+ cells among the three groups. Median fluorescence intensity of GPC3+ cells in each patient was measured, and mean expression intensity in each group was calculated. Mean expression intensity of HCC patients with HCV, HBV, and no viral infection was 33.0 ± 8.0, 15.2 ± 9.1, and 15.0 ± 8.5, respectively (P = .019 and P = .013, respectively) (Figure S2). We postulated that this difference in expression intensity was responsible for the difference in plasma GPC3 levels.
3.4. Plasma GPC3 levels enabled prediction of tumoral GPC3 expression in patients with HCV‐related HCC
We also examined the ability of plasma GPC3 levels to predict GPC3 expression in tumors using ROC curve analysis. ROC curves were created for the HCV group, which showed the highest correlation between the two factors, and the value that maximized the sum of sensitivity and specificity was determined using the Youden index. As a result, tumors with >10% GPC3+ cells could be predicted with 80% sensitivity and 100% specificity (AUC, 0.875; 95% confidence interval [CI], 0.726‐1.000) when the cut‐off GPC3 plasma value was set to 6.8 pg/mL (Figure 3). Similarly, when the cut‐off values were set to 8.7 and 9.2 pg/mL, a 20% GPC3+ cell proportion could be predicted with 77.8% sensitivity and 80% sensitivity (AUC, 0.793; 95% CI, 0.603‐0.982) and 30% GPC3+ could be predicted with 76.9% sensitivity and 91.0% sensitivity (AUC, 0.881; 95% CI, 0.722‐1.000) (Figure S3).
Figure 3.
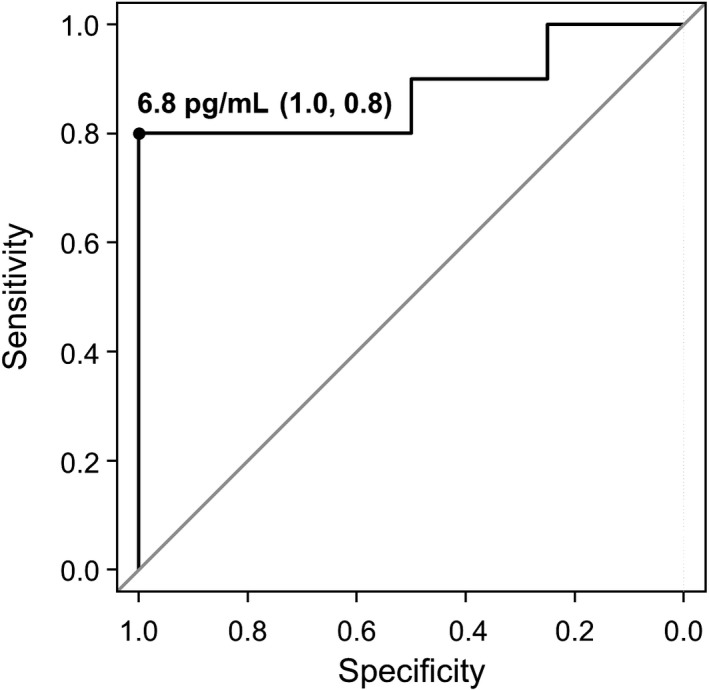
Receiver operating characteristic curve analysis of plasma glypican‐3 (GPC3) levels for predicting >10% GPC3+ cells. Area under the curve value is 0.875 (95% confidence interval 0.726‐1.000)
3.5. Validation of the cut‐off value for predicting tumoral GPC3 expression in other patients with HCV‐related HCC
For further confirmation of these prognostic associations, we also measured plasma GPC3 levels in a separate group of 248 patients with HCV‐related HCC in the OMH data set (Table S4). Samples from 105 patients were collected pretreatment, whereas samples from the other 143 patients were collected post‐treatment. There were no statistically significant differences between the two groups with respect to serum GPC3 concentration (40.1 ± 117.9 pg/mL vs 29.1 ± 48.6 pg/mL, P = .145). All patients were divided into two groups according to plasma GPC3 levels using a cut‐off value of 6.8 pg/mL, and the overall survival of each group was analyzed with Kaplan‐Meier curves (Figure 4). Overall, 40 patients (16%) were classified into the FL‐GPC3 ≤6.8 pg/mL group and their median overall survival (10.1 years) was significantly better than that of patients in the FL‐GPC3 >6.8 pg/mL group (3.6 years, P = .036). Given that GPC3 is expressed in over 80% of patients with HCC and is associated with poor prognosis,5, 6, 7 in the group with plasma GPC3 levels ≤6.8 pg/mL (about 20% of the total cases), expression of GPC3 in the tumor may also be low, resulting in a favorable prognosis.
Figure 4.
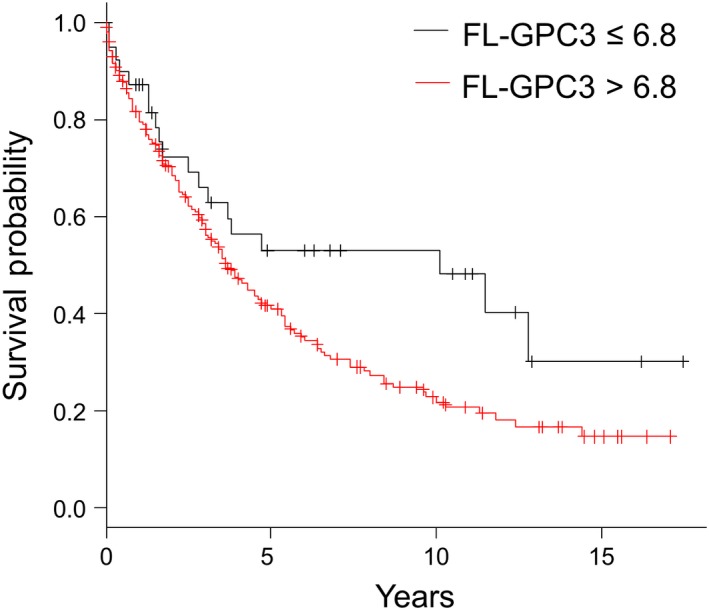
Kaplan‐Meier survival analysis showing significant differences between patients with ≤6.8 pg/mL plasma glypican‐3 (GPC3) levels and those with >6.8 pg/mL GPC3 levels
We also evaluated differences in patient characteristics between the two groups as shown in Table S5. In the FL‐GPC3 >6.8 pg/mL group, there were a greater number of patients with multiple tumors, tumors greater than 20 mm, or Child classification B or C. In addition, patients with Child classification B or C were in more advanced disease stages than those with classification A (Table S6). Taken together, these findings suggest that patients with higher plasma GPC3 levels are in more advanced stages of HCC. Indeed, it has been reported that the expression of tumoral GPC3 increases with tumor progression.14, 32, 33 These results seem to suggest that the cut‐off value of plasma GPC3 levels reflects tumoral GPC3 expression in patients with HCV‐related HCC. In addition, in the survival analysis, as expected, the prognosis of patients in advanced stages and with Child‐Pugh classification B or C was poorer (Table S7).
3.6. Plasma FL‐GPC3 may be a biomarker for the diagnosis of HCC
We compared plasma FL‐GPC3 levels between non‐carcinogenic patients with HCV‐related chronic hepatitis (HCV‐CH) (CH group) (n = 95) and patients with HCV‐related HCC whose samples were collected before treatment (HCC group) (n = 105) in the OMH data set. Mean plasma FL‐GPC3 levels of the CH and HCC groups were 19.2 ± 34.1 pg/mL versus 44.5 ± 120.0 pg/mL (P = .049), respectively. Mean alpha‐fetoprotein (AFP) levels of the CH and HCC groups were 11.7 ± 23.4 ng/mL versus 29 515.0 ± 154 986.8 ng/mL (P = .067), respectively. We summarized these values in Table S8.
Next, we examined the ability of plasma FL‐GPC3 and serum AFP levels to discriminate between the two groups using ROC curve analysis. In this analysis, patients with HCC could be identified with 47.4% sensitivity and 91.1% specificity (AUC, 0.723; 95% CI, 0.650‐0.795) when the plasma GPC3 cut‐off value was set to 6.6 pg/mL, and with 90.4% sensitivity and 76.2% specificity (AUC, 0.88; 95% CI, 0.830‐0.931) when the serum AFP cut‐off value was set to 24.0 ng/mL (Figure S4). Furthermore, when both cut‐off values were applied, HCC patients could be diagnosed with 68.3% sensitivity and 89.4% specificity (Figure 5). Although plasma FL‐GPC3 is thought to be a useful marker for the diagnosis of HCC, this should be confirmed in a prospective study.
Figure 5.
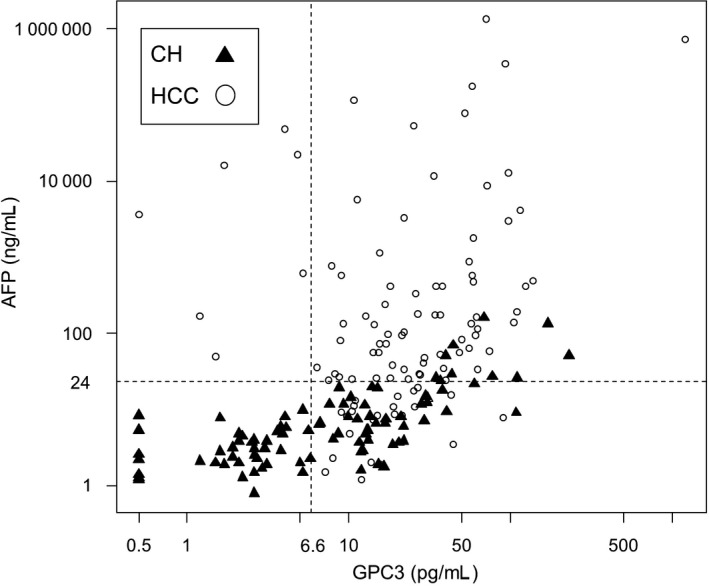
Correlation between plasma full‐length glypican‐3 (FL‐GPC3) and serum alpha fetoprotein (AFP) levels in patients with hepatocellular carcinoma (HCC; n = 105) and HCV‐related chronic hepatitis (CH; n = 95)
4. DISCUSSION
The present analysis showed that GPC3 expression in tumors was lower in HCC patients without hepatitis virus infection than in those with HCV‐ or HBV‐related HCC. The majority of all HCC cases occur as a result of chronic liver inflammation and subsequent cirrhosis, which is often caused by persistent infection with HCV and HBV.34 Although both virus infections had previously been the overwhelmingly dominant cause of HCC in Japan, the incidence of non‐virus‐related HCC has increased in recent years.35 Non‐alcoholic fatty liver disease and non‐alcoholic steatohepatitis, which result in progression to liver cirrhosis and HCC, are considered to be the most critical causes of the increase in non‐virus‐related HCC.36 Although novel antiviral agents against hepatitis viruses (ledipasvir/sofosbuvir for patients with HCV and tenofovir alafenamide for patients with HBV) have been developed with high efficacy reported,37, 38 the occurrence or recurrence of HCC after these treatments is often fatal and, thus, further improvement of the prognosis is desired.39 Immunotherapies targeting GPC3 are likely to be effective in this regard, and our results suggest that the presence of viral infection may be a useful indicator for patient selection for such treatments.
Indeed, we found a correlation between the levels of plasma and tumor GPC3 levels, and the possibility of predicting GPC3 expression in tumors from plasma GPC3 concentration showed higher specificity and sensitivity in HCC patients with HCV infection. Moreover, there seemed to be a discrepancy between patients with HCV and with HBV; that is, similar to the HCV group, tumors in patients with HBV‐related HCC showed high GPC3 expression but the plasma GPC3 levels were lower than those of patients with HCV‐related HCC. We used our newly developed measurement system of FL‐GPC3 in the blood.29 Although, to date, there have been several reports of measurement of either the N‐terminal or C‐terminal domain of plasma GPC3, only one report based on measurement of the N‐terminal domain showed the same tendency, namely that plasma GPC3 levels in patients with HCV‐related HCC tended to be higher than those with HBV‐related HCC.25 As previously described, there are several forms of plasma GPC3. Therefore, this discrepancy may be due to differences in the form of GPC3 present between patients with HCV‐ and HBV‐related HCC. However, this could not be addressed in the present study because of the limited sample size. Based on these findings, validation in a larger population is warranted.
Furthermore, we also observed elevation of plasma GPC3 levels in a few of the healthy donors, and in patients with chronic hepatitis and cirrhosis caused by HCV. Indeed, several studies have confirmed the expression of GPC3 in regenerative nodules, HCV samples, and even in normal liver tissues, suggesting that the elevation of GPC3 occurs during the early stage of liver carcinogenesis or that GPC3 could be produced by non‐malignant or pro‐malignant liver cells.11, 27, 40, 41, 42 We also believe that GPC3 is secreted from these GPC3‐positive cells into the blood.42 Despite previous efforts, insufficient evidence is available on whether the progression of chronic hepatitis to HCC could be detected or predicted based on the plasma GPC3 level.40, 42 In the present study, we attempted to diagnose HCC using a combination of FL‐GPC3 and AFP, and the diagnostic accuracy was similar to that in previous reports.43 We are now focusing on the correlation between FL‐GPC3 and GALAD score, an algorithm based on gender, age, AFP, AFP‐L3, and des‐γ‐carboxyprothrombin.44 The early diagnosis of carcinogenesis in patients with chronic hepatitis may contribute to the improvement of their prognosis, and thus further study is needed to confirm these findings.
In the present study, in contrast to patients with HCC, levels of plasma GPC3 in patients with other carcinomas were similar to those of healthy donors, with some individual exceptions. In addition, intratumoral expression of GPC3 was largely unconfirmed. In these cases, it may be secreted from hepatocytes expressing GPC3 or another tumor site that could not be evaluated with IHC analysis. Functional genomic mRNA profiling has been reported as an aid to diagnose intratumoral GPC3 expression for such cancers with a low frequency of GPC3 expression.45 Moek et al12 reported a relative difference of ≤10% in 28 of 34 tumor types for which functional genomic mRNA data could be compared with the results of IHC analysis. This is a promising result, suggesting a useful method as a biomarker for predicting GPC3 expression in various carcinomas.
In conclusion, levels of plasma FL‐GPC3 could enable predicting intratumoral GPC3 expression in patients with HCV‐related HCC. Moreover, plasma GPC3 might be an effective marker for selecting patients who are suitable candidates for cancer immunotherapies targeting GPC3. However, these results should be validated in a larger study including patients with HCC after HCV exclusion.
DISCLOSURE
This study was supported in part by joint research funding from Sysmex Co., Ltd.
Supporting information
ACKNOWLEDGMENTS
This study was supported in part by joint research funding from Sysmex Co., Ltd. The National Cancer Center Biobank is supported by the National Cancer Center Research and Development Fund, Japan.
Shimizu Y, Mizuno S, Fujinami N, et al. Plasma and tumoral glypican‐3 levels are correlated in patients with hepatitis C virus‐related hepatocellular carcinoma. Cancer Sci. 2020;111:334–342. 10.1111/cas.14251
Funding information
The National Cancer Center Research and Development Fund (Grant/Award Number: '(25‐A‐7), (28‐A‐8)'.
REFERENCES
- 1. Bray F, Ferlay J, Soerjomataram I, Siegel RL, Torre LA, Jemal A. Global cancer statistics 2018: GLOBOCAN estimates of incidence and mortality worldwide for 36 cancers in 185 countries. CA Cancer J Clin. 2018;68:394‐424. [DOI] [PubMed] [Google Scholar]
- 2. Llovet JM, Ricci S, Mazzaferro V, et al. Sorafenib in advanced hepatocellular carcinoma. N Engl J Med. 2008;359:378‐390. [DOI] [PubMed] [Google Scholar]
- 3. Kudo M, Finn RS, Qin S, et al. Lenvatinib versus sorafenib in first‐line treatment of patients with unresectable hepatocellular carcinoma: a randomised phase 3 non‐inferiority trial. Lancet. 2018;391:1163‐1173. [DOI] [PubMed] [Google Scholar]
- 4. Filmus J, Selleck SB. Glypicans: proteoglycans with a surprise. J Clin Invest. 2001;108:497‐501. [DOI] [PMC free article] [PubMed] [Google Scholar]
- 5. Nakatsura T, Yoshitake Y, Senju S, et al. Glypican‐3, overexpressed specifically in human hepatocellular carcinoma, is a novel tumor marker. Biochem Biophys Res Commun. 2003;306:16‐25. [DOI] [PubMed] [Google Scholar]
- 6. Capurro M, Wanless IR, Sherman M, et al. Glypican‐3: a novel serum and histochemical marker for hepatocellular carcinoma. Gastoroenterology. 2003;125:89‐97. [DOI] [PubMed] [Google Scholar]
- 7. Wang HL, Anatelli F, Zhai QJ, et al. Glypican‐3 as a useful diagnostic marker that distinguishes hepatocellular carcinoma from benign hepatocellular mass lesions. Arch Pathol Lab Med. 2008;132:1723‐1728. [DOI] [PubMed] [Google Scholar]
- 8. Ikeda H, Sato Y, Yoneda N, et al. α‐Fetoprotein‐producing gastric carcinoma and combined hepatocellular and cholangiocarcinoma show similar morphology but different histogenesis with respect to SALL4 expression. Hum Pathol. 2012;43:1955‐1963. [DOI] [PubMed] [Google Scholar]
- 9. Foda AA, Mohammad MA, Abdel‐Aziz A, et al. Relation of glypican‐3 and E‐cadherin expressions to clinicopathological features and prognosis of mucinous and non‐mucinous colorectal adenocarcinoma. Tumour Biol. 2015;36:4671‐4679. [DOI] [PubMed] [Google Scholar]
- 10. Yamanaka K, Ito Y, Okuyama N, et al. Immunohistochemical study of glypican 3 in thyroid cancer. Oncology. 2007;73:389‐394. [DOI] [PubMed] [Google Scholar]
- 11. Baumhoer D, Tornillo L, Stadlmann S, et al. Glypican 3 expression in human nonneoplastic, preneoplastic, and neoplastic tissues: a tissue microarray analysis of 4,387 tissue samples. Am J Clin Pathol. 2008;129:899‐906. [DOI] [PubMed] [Google Scholar]
- 12. Moek KL, Fehrmann RSN, van der Vegt B, et al. Glypican 3 overexpression across a broad spectrum of tumor types discovered with functional genomic mRNA profiling of a large cancer database. Am J Pathol. 2018;188:1973‐1981. [DOI] [PubMed] [Google Scholar]
- 13. Shirakawa H, Suzuki H, Shimomura M, et al. Glypican‐3 expression is correlated with poor prognosis in hepatocellular carcinoma. Cancer Sci. 2009;100:1403‐1407. [DOI] [PMC free article] [PubMed] [Google Scholar]
- 14. Xiao WK, Qi CY, Chen D, et al. Prognostic significance of glypican‐3 in hepatocellular carcinoma: a meta‐analysis. BMC Cancer. 2014;14:104. [DOI] [PMC free article] [PubMed] [Google Scholar]
- 15. Li J, Gao JZ, Du JL, et al. Prognostic and clinicopathological significance of glypican‐3 overexpression in hepatocellular carcinoma: a meta‐analysis. World J Gastroenterol. 2014;20:6336‐6344. [DOI] [PMC free article] [PubMed] [Google Scholar]
- 16. Nakatsura T, Komori H, Kubo T, et al. Mouse homologue of a novel human oncofetal antigen, glypican‐3, evokes T‐cell‐mediated tumor rejection without autoimmune reactions in mice. Clin Cancer Res. 2004;10:8630‐8640. [DOI] [PubMed] [Google Scholar]
- 17. Komori H, Nakatsura T, Senju S, et al. Identification of HLA‐A2‐ or HLA‐A24‐restricted CTL epitopes possibly useful for glypican‐3‐specific immunotherapy of hepatocellular carcinoma. Clin Cancer Res. 2006;12:2689‐2697. [DOI] [PubMed] [Google Scholar]
- 18. Sawada Y, Yoshikawa T, Nobuoka D, et al. Phase I trial of a glypican‐3‐derived peptide vaccine for advanced hepatocellular carcinoma: immunologic evidence and potential for improving overall survival. Clin Cancer Res. 2012;18:3686‐3696. [DOI] [PubMed] [Google Scholar]
- 19. Sawada Y, Yoshikawa T, Ofuji K, et al. Phase II study of the GPC3‐derived peptide vaccine as an adjuvant therapy for hepatocellular carcinoma patients. Oncoimmunology. 2016;5:e1129483. [DOI] [PMC free article] [PubMed] [Google Scholar]
- 20. Suzuki S, Sakata J, Utsumi F, et al. Efficacy of glypican‐3‐derived peptide vaccine therapy on the survival of patients with refractory ovarian clear cell carcinoma. Oncoimmunology. 2016;5:e1238542. [DOI] [PMC free article] [PubMed] [Google Scholar]
- 21. Tsuchiya N, Hosono A, Yoshikawa T, et al. Phase I study of glypican‐3‐derived peptide vaccine therapy for patients with refractory pediatric solid tumors. Oncoimmunology. 2017;7:e1377872. [DOI] [PMC free article] [PubMed] [Google Scholar]
- 22. Shimizu Y, Suzuki T, Yoshikawa T, et al. Cancer immunotherapy‐targeted glypican‐3 or neoantigens. Cancer Sci. 2018;109:531‐541. [DOI] [PMC free article] [PubMed] [Google Scholar]
- 23. De Cat B, Muyldermans SY, Coomans C, et al. Processing by proprotein convertases is required for glypican‐3 modulation of cell survival, Wnt signaling, and gastrulation movements. J Cell Biol. 2003;163:625‐635. [DOI] [PMC free article] [PubMed] [Google Scholar]
- 24. Ho M, Kim H. Glypican‐3: a new target for cancer immunotherapy. Eur J Cancer. 2011;47:333‐338. [DOI] [PMC free article] [PubMed] [Google Scholar]
- 25. Haruyama Y, Yorita K, Yamaguchi T, et al. High preoperative levels of serum glypican‐3 containing N‐terminal subunit are associated with poor prognosis in patients with hepatocellular carcinoma after partial hepatectomy. Int J Cancer. 2015;137:1643‐1651. [DOI] [PubMed] [Google Scholar]
- 26. Chen M, Li G, Yan J, et al. Reevaluation of glypican‐3 as a serological marker for hepatocellular carcinoma. Clin Chim Acta. 2013;423:105‐111. [DOI] [PubMed] [Google Scholar]
- 27. Hippo Y, Watanabe K, Watanabe A, et al. Identification of soluble NH2‐ terminal fragment of glypican‐3 as a serological marker for earlystage hepatocellular carcinoma. Cancer Res. 2004;64:2418‐2423. [DOI] [PubMed] [Google Scholar]
- 28. Anatelli F, Chuang ST, Yang XJ, et al. Value of glypican‐3 immunostaining in the diagnosis of hepatocellular carcinoma on needle biopsy. Am J Clin Pathol. 2008;130:219‐223. [DOI] [PubMed] [Google Scholar]
- 29. Miura M, Fujinami N, Shimizu Y, et al. Usefulness of plasma full‐length glypican‐3 as a predictive marker of hepatocellular carcinoma recurrence after radial surgery. Oncol Lett. 2019. in press. [DOI] [PMC free article] [PubMed] [Google Scholar]
- 30. Ofuji K, Saito K, Suzuki S, et al. Perioperative plasma glypican‐3 level may enable prediction of the risk of recurrence after surgery in patients with stage I hepatocellular carcinoma. Oncotarget. 2017;8(23):37835‐37844. [DOI] [PMC free article] [PubMed] [Google Scholar]
- 31. Sobin LH, Gospodarowicz MK, Wittekind C; International Union Against Cancer . TNM Classification of Malignant Tumors, 7th edn Chichester, UK: Wiley‐Blackwell; 2009. [Google Scholar]
- 32. Sun B, Huang Z, Wang B, et al. Significance of glypican‐3 (GPC3) expression in hepatocellular cancer diagnosis. Med Sci Monit. 2017;23:850‐855. [DOI] [PMC free article] [PubMed] [Google Scholar]
- 33. Zhang J, Zhang M, Ma H, et al. Overexpression of glypican‐3 is a predictor of poor prognosis in hepatocellular carcinoma: an updated meta‐analysis. Medicine (Baltimore). 2018;97:e11130. [DOI] [PMC free article] [PubMed] [Google Scholar]
- 34. Shlomai A, de Jong YP, Rice CM. Virus associated malignancies: the role of viral hepatitis in hepatocellular carcinoma. Semin Cancer Biol. 2014;26:78‐88. [DOI] [PMC free article] [PubMed] [Google Scholar]
- 35. Michitaka K, Nishiguchi S, Aoyagi Y, et al. Etiology of liver cirrhosis in Japan: a nationwide survey. J Gastroenterol. 2010;45:86‐94. [DOI] [PubMed] [Google Scholar]
- 36. Hashimoto E, Tokushige K. Prevalence, gender, ethnic variations, and prognosis of NASH. J Gastroenterol. 2011;46:62‐69. [DOI] [PubMed] [Google Scholar]
- 37. Ioannou GN, Beste LA, Chang MF, et al. Effectiveness of sofosbuvir, ledipasvir/sofosbuvir, or paritaprevir/ritonavir/ombitasvir and dasabuvir regimens for treatment of patients with hepatitis C in the Veterans Affairs National Health Care System. Gastroenterology. 2016;151(457–471):e5. [DOI] [PMC free article] [PubMed] [Google Scholar]
- 38. Buti M, Gane E, Seto WK, et al. Tenofovir alafenamide versus tenofovir disoproxil fumarate for the treatment of patients with HBeAg‐negative chronic hepatitis B virus infection: a randomised, double‐blind, phase 3, non‐inferiority trial. Lancet Gastroenterol Hepatol. 2016;1:196‐206. [DOI] [PubMed] [Google Scholar]
- 39. Yoshimasu Y, Furuichi Y, Kasai Y, et al. Predictive factors for hepatocellular carcinoma occurrence or recurrence after direct‐acting antiviral agents in patients with chronic hepatitis C. J Gastrointest Liver Dis. 2019;28:63‐71. [DOI] [PubMed] [Google Scholar]
- 40. Jia X, Gao Y, Zhai D, et al. Assessment of the clinical utility of glypican 3 as a serum marker for the diagnosis of hepatocellular carcinoma. Technol Cancer Res Treat. 2016;15:780‐786. [DOI] [PubMed] [Google Scholar]
- 41. Abdul‐Al HM, Makhlouf HR, Wang G, et al. Glypican‐3 expression in benign liver tissue with active hepatitis C: implications for the diagnosis of hepatocellular carcinoma. Hum Pathol. 2008;39:209‐212. [DOI] [PubMed] [Google Scholar]
- 42. Yasuda E, Kumada T, Toyoda H, et al. Evaluation for clinical utility of GPC3, measured by a commercially available ELISA kit with Glypican‐3 (GPC3) antibody, as a serological and histological marker for hepatocellular carcinoma. Hepatol Res. 2010;40:477‐485. [DOI] [PubMed] [Google Scholar]
- 43. Xu C, Yan Z, Zho L, et al. A comparison of glypican‐3 with alpha‐fetoprotein as a serum marker for hepatocellular carcinoma: a meta‐analysis. J Cancer Res Clin Oncol. 2013;139:1417‐1424. [DOI] [PubMed] [Google Scholar]
- 44. Johnson PJ, Pirrie SJ, Cox TF, et al. The detection of hepatocellular carcinoma using a prospectively developed and validated model based on serological biomarkers. Cancer Epidemiol Biomarkers Prev. 2014;23:144‐153. [DOI] [PubMed] [Google Scholar]
- 45. Fehrmann RS, Karjalainen JM, Krajewska M, et al. Gene expression analysis identifies global gene dosage sensitivity in cancer. Nat Genet. 2015;47:115‐125. [DOI] [PubMed] [Google Scholar]
Associated Data
This section collects any data citations, data availability statements, or supplementary materials included in this article.
Supplementary Materials


