

Abstract
Collective invasion of cancer cells is the key process of circulating tumor cell (CTC) cluster formation, and greatly contributes to metastasis. Cancer stem‐like cells (CSC) have a distinct advantage of motility for metastatic dissemination. To verify the role of CSC in the collective invasion, we performed 3D assays to investigate the collective invasion from cancer cell spheroids. The results demonstrated that CSC can significantly promote both collective and single‐cell invasion. Further study showed that CSC prefer to move outside and lead the collective invasion. More interestingly, approximately 60% of the leader CSC in collective invasion co–expressed both epithelial and mesenchymal genes, while only 4% co–expressed in single invasive CSC, indicating that CSC with hybrid epithelial/mesenchymal phenotype play a key role in cancer cell collective invasion.
Keywords: cancer stem‐like cells, collective invasion, hybrid epithelial/mesenchymal, leader, single invasion
To verify the role of CSC in the collective invasion, we performed 3D assays for investigating the collective invasion from cancer cell spheroids. The results demonstrated that CSC act as leaders to promote collective invasion with hybrid epithelial/mesenchymal phenotype. Our present observations may predict a new strategy for cancer metastasis, including interventions targeting CSC.
1. INTRODUCTION
Tumor metastasis, the movement of tumor cells from a primary site to progressively colonize distant organs, is responsible for more than 90% of deaths of cancer patients.1 The metastasis of cancerous tumors relies on the release of circulating tumor cells (CTC) that migrate to distant sites and form secondary tumors. Compared with single CTC, CTC clusters, arising from the fragmenting of primary tumor cell clumps into the vasculature in the circulation, have 23 ‐ 50‐fold increased metastatic potential,2 and dissociating CTC clusters into single cells can suppress metastasis.3 The fundamental process of CTC cluster formation is termed “collective invasion”: cancer cells invade the surrounding stroma as cohesive clusters.4, 5, 6 Unfortunately, this process, including collective cancer cell dissemination and invasion, is still not well understood.7, 8
One way for cancer cells to collectively invade is to rely upon the motility of migratory stromal cells, such as fibroblasts6, 9 and macrophages.10 In fact, tumors also contain multiple subpopulations of tumor cells with distinct genotypic and phenotypic characteristics.5 Importantly, this cellular heterogeneity is associated with differences in metastatic potential and therapeutic response.11, 12 It remains unclear how these subpopulations of cancer cells contribute to collective invasion.
Cancer stem‐like cells (CSC) are subpopulations in the tumor that are endowed with the ability to self‐renew and differentiate into non–stem cancer cells (NSCC) that comprise the bulk of the tumor.13, 14 Studies suggest that CSC not only have stem‐like cell characters but also demonstrate the potential of a distinct advantage for metastatic dissemination.13, 15, 16, 17, 18 An increased proportion of CSC in tumors correlated with the occurrence of metastasis and a reduced survival rate in patients.14, 19 Comparison of gene signatures in the primary tumor and metastatic cells showed that 1.4% of primary tumor cells and 16.7% of CTC possessed stem‐like signatures,20, 21 suggesting that CSC may participate in the initiation of metastasis. However, to our knowledge, there are no reports that shed light on the function of CSC in collective invasion.
Transitions between epithelial and mesenchymal phenotypes (the epithelial to mesenchymal transition [EMT] and its reverse, the mesenchymal to epithelial transition [MET]), are hallmarks of cancer metastasis.22 The connection among EMT, MET and stemness indicates that CSC come in two distinct states: “epithelial‐like” and “mesenchymal‐like.”23, 24 Recent studies have attempted to resolve this contradiction by suggesting that instead of the cells in pure epithelial (E) or pure mesenchymal (M) states, cells in hybrid E/M or partial EMT state (which express epithelial and mesenchymal markers concurrently) are most likely to gain stemness.25, 26 In fact, many CTC that survive in blood exhibit hybrid E/M phenotypes, become resistant to drugs and exit the bloodstream more efficiently.27, 28 Cells in the hybrid E/M phenotype have both epithelial (cell‐cell adhesion) and mesenchymal (migration) traits, and, hence, may avail collective cell invasion and migration.26
Here we hypothesized that CSC may play a key role in collective invasion. To test this hypothesis, we used 3D invasion assays with spheroids to identify the most invasive cancer cells in an unbiased fashion. The results demonstrated that the CSC promote collective invasion significantly by moving outside of the spheroids to lead the collective invasion. To further explore the properties of the leader CSC, cell lines with E‐cadherin, N‐cadherin and Nanog promoter labeling were generated. Co–expression of these genes in the leading CSC suggested that CSC is the leader, with hybrid E/M phenotype playing a key role in collective invasion.
2. MATERIALS AND METHODS
2.1. Cell culture
Human breast cancer cell lines MCF7 and MDA‐MB‐231 were purchased from ATCC. Cells were cultured at 37°C and 5% CO2 in DMEM high glucose medium (HyClone) with 10% FCS (HyClone) and 1% penicillin‐streptomycin (HyClone).
2.2. Cells sorting
Cells were trypsinized into single cell suspension and were counted. For staining, samples were incubated with antibodies for 30 minutes at 4°C. Unbound antibody was washed off and cells were sorted by flow cytometry for no longer than 30 minutes post–staining on a BD AriaIII. The antibodies used to obtain breast CSC were anti–CD44‐PE, anti–Nanog‐APC and anti–CD24‐FITC (BD Pharmingen). The purity of isolated breast CSC was determined by standard flow cytometry analysis. The purity of isolated CD44+CD24− CSC regularly exceeded 98%.
2.3. Cells spheroids formation and invasion assay
Cells were removed from the cell culture dishes with trypsin and resuspended in sterile 0.25% methylcellulose solution in DMEM. The cellulose solution contained cells with different ratios needed at a concentration of 104 cells per mL. Next, 20‐μL droplets were plated onto the underside of 10‐cm culture dishes or 24‐well plates (Corning) and inverted culture plates to form cell spheroids by gravity in a 37°C incubator in 4 days. Compacted spheroids were collected, then embedded in extracellular matrix (medium/Geltrex gel [BD Bioscience] mix at a concentration of 1.6 mg/mL) in 24‐well plates (Corning) at 37°C and 5% CO2. The gel was incubated for at least 30 min at 37°C before the spheroids were embedded. The spheroids were then imaged with Zeiss LSM710 at a magnification of ×10 and ×20 from 0‐96 h post–embedding. Z‐stack images spanning 100‐150 µm were collected and image stacks were processed by ZEN software (Carl Zeiss) to yield maximum‐intensity projections.
2.4. Cell tracker
Cells were harvested by removing culture media from cells after centrifugation, and then suspended gently in pre–warmed CellTracker (Thermo Fisher)(1:1000 dilution) staining solution with culture medium, and incubated at 37°C for 20 minutes. After that, cells were centrifuged to remove the CellTracker solution and then added with culture medium for use.
2.5. Immunofluorescence Staining
MCF7 cells were plated onto glass coverslips for 4 hours, fixed in 4% paraformaldehyde for 15 minutes at room temperature and then washed with PBS. Then, cells were incubated with E‐cadherin‐FITC‐antibody and N‐cadherin Alexa Fluor 350 Antibody (1:200, BioLegend) overnight at 4°C. After washing with PBS, cells were monitored using a confocal microscope (Zeiss, LSM710).
2.6. Western blot
Cells were washed with PBS three times and scraped into a lysis buffer (Beyotime, Shanghai, China) with proteinase inhibitor (Beyotime). After centrifugation, the supernatant was collected. The concentration was determined using a bicinchoninic acid protein assay (Beyotime). Equal amounts of proteins were electrophoresed on a 6% or 8% Bis–Tris gel and transferred to nitrocellulose membranes (Beyotime). After being blocked by 5% skim milk in Tris‐buffered saline, membranes were incubated with primary antibodies of rabbit anti–Zeb1 (1:200, Abcam, USA), mouse anti–twist (1:500, Abcam, USA), mouse anti–vimentin (1:500, Abcam, USA), mouse anti–Nanog (1:500, Abcam, USA), rabbit anti–Snail (1:500, Abcam, USA) or polyclonal anti–β‐actin (1:1000, Abcam, USA) overnight at 4°C, followed by incubation with corresponding secondary antibodies at 37°C for 1 hour. The blot signal was detected using an ECL detection system (Amersham, USA).
2.7. Spheroid image analysis
The invasive distance was defined as the mean distance of all points on the cells to the centroid of spheroid minus the radius. Distribution of different cells in spheroids was quantified by measuring both the total spheroid area around the outer perimeter and the inner spheroid core in ImageJ.
2.8. Stable cell lines labeling
pE‐cad‐Ctrine, pN‐cad‐mCherry and pNanog‐CFP expressing plasmids which comprises specific gene promoter (promoter information in supporting information) and a fluorescent label were transfected into MCF7 cells using Lipofectamine 2000 according to the manufacturer’s instructions. Forty‐eight hours after transfection, cells started to be selected by G418. After 2 weeks of selection, cells with signals were sorted and collected by FACS. Insertion of the target sites was analyzed by sequencing of genomic DNA using the following primers: E‐cadherin sequence 1: AGACATTTCTGATCATTATTCCC, E‐cadherin sequence 2: ATGGTGAGCAAGGGCGAGGAG; N‐cadherin sequence 1: CCCCCGCTC‐CATTCCACA, N‐cadherin sequence 2: ATGGTGAGCAAGGGCGAGGAG. Nanog sequence 1: AAAAGGAAATGGCTGGTTTAATTAT, Nanog sequence 2: ATGGTGAGCAAGGGCGAGGAG.
2.9. Time‐lapse image
To observe the E‐cadherin/N‐cadherin dynamics at the spheroid edges, spheroids cells expressing E‐cad‐Ctrine and pN‐cad‐mCherry, pNanog‐CFP were prepared as described above. Leader and follower spheroids were imaged using a confocal microscope. Images were collected every 4 hours beginning at 20 hours post–embedding for 40 hours. To observe the cell spheroid assay with salinomycin added, spheroids were imaged using a Nikon inverted microscope with a live cell chamber at ×10 objective; images were captured every hour from beginning of embedding for 72 hours.
2.10. In vivo experiments
Mice were purchased from the Beijing Laboratory Animal Center of China and maintained in the Animal Resources Center of the China Agriculture University. The protocol was approved by the Committee on the Ethics of Animal Experiments of the China Agriculture University (permit number: 2019‐009‐012). Nude mice were maintained in a specific pathologic‐free environment. A specified number of NSCC or hybrid epithelial/mesenchymal CSC suspended in total 100‐μL serum‐free medium and Matrigel (1:1) were inoculated subcutaneously on the left and right side separately (5 animals per experimental group). For the in vivo tumorigenic assay, tumor incidence was monitored after cells were inoculated for 4 weeks. In addition, 1 × 10⁶ cells were intravenously injected into the tail vein of BALB/c mice (n = 5 for each group) to analyze the tumor cell metastasis ability. Mice were imaged by bioluminescence imaging (BLI).
2.11. Statistics and reproducibility
The experimental data were analyzed using OriginLab. To exclude the influence of cell spheroid size on invasion, the cell spheroids with radius of 10‐15 μm were counted and normalized. The results were shown as mean ± SD. Statistical differences were performed using the t test. When representative images are shown, the representatives are from at least three independent samples.
3. RESULTS
3.1. Different invasion types of cells on spheroid
CD44+CD24− and Nanog+ cell subpopulations are two kinds of commonly studied CSC.29, 30, 31, 32 Many studies have shown that the subpopulations have stronger abilities in spheroid formation and tumorigenesis.31, 33, 34 In MCF7 cells, the average proportion of CD44+CD24− CSC was 1.49% (Figure S1); meanwhile, our results showed that 95.2% of the CD44+CD24− CSC were Nanog+ cells (Figure 1A). Within this proportion, cells can invade the surrounding environment (Figure S2C). To probe the different types of invasion present in the total invasive population over time, we performed an invasion assay of tumor cells as reported previously.6, 9 As illustrated in Figure S2A, tumor spheroids were embedded in a 3D matrix and imaged over time. There were 2 types of cell invasion observed. As shown in Figure S1B and S1C, cells in spheroids showed phenotypically heterogeneous invasions including single‐cell invasion and collective invasion. We analyzed the cell number in different invasive types, and the results showed that the cell number for collective invasion was more than that of single invasion (Figure S2D).
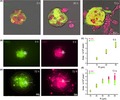
Figure 1.
The different collective invasive ability of cancer stem‐like cells (CSC) and non–stem cancer cells (NSCC). A, Flow cytometry of CD44+CD24− MCF7 cells stained with Nanog‐APC antibody; 95.2% CD44+CD24− CSC are Nanog+ cells. Three independent samples are all above 95%. B, Three group invasion. Spheroids were formed from pure CD44−CD24+ or Nanog− NSCC (0% CSC), pure CD44+CD24− or Nanog+ CSC (100% CSC) and 1:1 mixed (50% CSC), with 200 cells in each spheroid, and then embedded in extracellular matrix for 72 h. C, Quantification of the percentage of spheroids with collective invasion in the experiment from B. D, Quantification of the number of collective cells per spheroid from the experiment in B. E, Quantification of the number of single and collective invasion cells per spheroid from the experiment in B. n = 72 spheroids for C, D, E statistics. Data are presented as the means ± SD (n = 3). All P‐values were determined using Student’s t test. *P < 0.05. **P < 0.01. ***P < 0.001
3.2. The different collective invasive ability of cancer stem‐like cells and non–stem cancer cells
To study the difference between CSC and NSCC in the collective invasion, spheroids made by pure CSC, pure NSCC, as well as a 50% mixture of CSC and NSCC at 1:1 were used for invasion assay experiments (Figure 1B). In the pure NSCC group, there is scarcely any invasion post–72 h (Figure 1B‐D). While in the 50% CSC group, the probability of collective invasion is 49.4%, which is 19 times higher than that of the pure NSCC group (Figure 1C). The number of collective invasion cells per spheroid is 6.1, approximately 21 times more than that of the pure NSCC group (Figure 1D), and the number of single invasive cells is also more than that of the NSCC group (Figure 1E). In addition to breast cancer cell line MCF7, conducted the same research with triple‐negative breast cancer cell line MDA‐MB‐231(Figure S3A‐C). In the pure CSC group, the probability and the number of collective invasion cells were both higher than those in the other two groups (Figure 1C,D). The results were similar for both Nanog+ and CD44+CD24– CSC for collective invasion (Figure 1C,D). With the CSC proportion increased, there were more collective invasive cells than single invasion cells exhibited (Figure 1E). In addition, the average invasion distance of cells increased in direct proportion to the CSC ratio (Figure S3D).
3.3. More cancer stem‐like cells distributed in the outer layer of cell spheroids
To explore how CSC enhanced collective invasion of the cells, and to determine the difference between CSC and NSCC in invasive behavior, we labeled CSC and NSCC in red and green with a cell tracker, respectively. In spheroids with mixed CSC and NSCC at 1:1, the red CSC gradually diffused to the outer layer of the spheroids during the invasion process (Figure 2A). The distributions of CSC and NSCC on the cell spheroids were counted by using circles with a radius which increased by 10 μm in turn from the center of spheroids at different time points (Figure 2B,D). The results showed that CSC were significantly more distributed in the outer layer of the spheroids than NSCC 72 h post–invasion, while there was no difference in the distribution at the beginning (Figure 2C,E). The same phenomenon was also found in the MDA‐MB‐231 cell spheroids (FigureS4D‐F). Meanwhile, there was no difference between the size of single CSC and NSCC, eliminating the disturbance of the size of CSC and NSCC on the distribution (FigureS4A‐C).
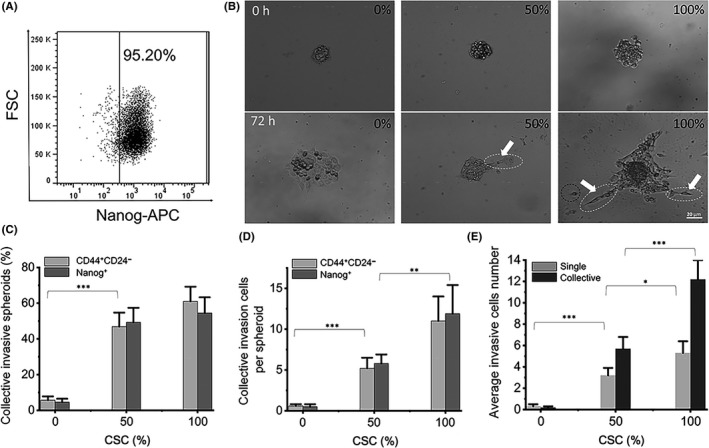
Figure 2.
Distribution of cancer stem‐like cells (CSC) in the layers of the spheroids. A, In the spheroids with mixed CSC and NSCC at 1:1, the red CSCs gradually diffused to the outer layer of the spheroids during the invasion process. B and D, The yellow circles in the 0 h and 72 h figures were several circles with radius of which increased by 10 μm in turn from the center. The image is representative of 72 samples. C and E, The area of pixels occupied by cell distribution in enlarged ring at 0 h and 72 h. n = 30
3.4. Cancer stem‐like cells acted as leaders to drive collective invasion
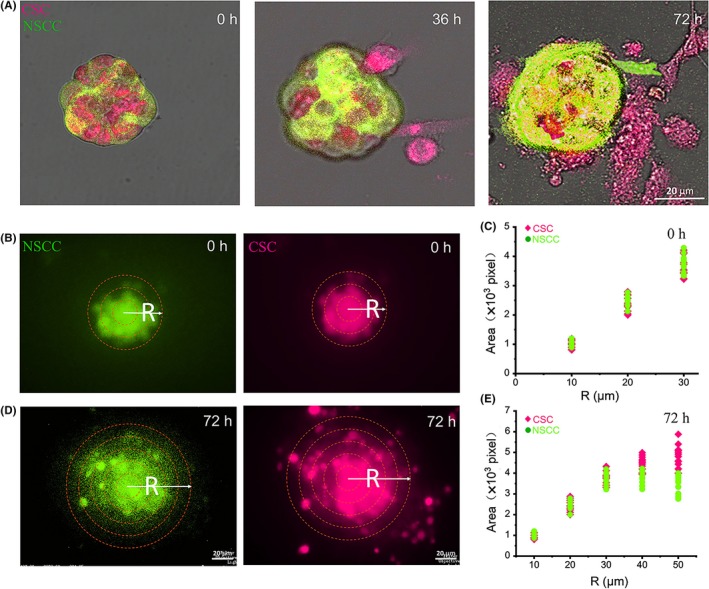
Invading cells displayed phenotypically heterogeneous, collective chain invasion with leader cells defined as the first cell of a chain with trailing follower cells.35 Moreover, from the invaded cells, the CSC, either Nanog+ or CD44+CD24–, were mostly located in the leader position of the invading chain, leading the collective invasions (Figure 3A,B and Figure S4G,H). By counting all invasive chains, the results showed that 81% and 85% of the leader cells were CD44+CD24– CSC or Nanog+, respectively (Figure 3C and Figure S4I), suggesting that CSC led the collective invasion.
Figure 3.
Cancer stem‐like cells (CSC) led collective or single invasion. A and B, Confocal magnified view of the collective strand. The white arrow points to the leader cell in the circle. C, Percentage of CD44+CD24− and Nanog+ cells in leader position of collective strands. D, Percentage of single and collective invasive cells in CSC. n = 72 spheroids. Data are presented as the means ± SD (n = 3). All P‐values were determined by Student’s t test. *P < 0.05. **P < 0.01. ***P < 0.001
To verify the impact of CSC proportion on collective invasion, we increased the proportion of CSC in cell spheroids, from 10% to 50% to 90% in total cell content (Figure S5A), respectively. In all groups, CSC were found at the leading tip of invasive chains, followed by other CSC and/or NSCC, to invade surrounding extracellular matrix collectively (Figure S5B). With the increase in the proportion of CSC, the relative number of NSCC in collective invasion also increased (Figure S5D). At the same time, we found that adding salinomycin could reduce the outer distribution of CSC on the cell spheroids and also reduce the collective invasion of cells (Figure S6).
The results showed that CSC and NSCC can have both collective and single‐cell invasions (Figure S5C,D). From spheroids with 50% CSCs group, CSCs account for 57% in single invasive cells and 74% in collective invasive cells (Figure 3D). As CSC are involved in both single and collective invasion, we further explored the difference in the CSC contributing to the two distinct invasion patterns.
3.5. Hybrid E/M phenotype in invasive leaders
Previous studies have shown that there are epithelial and mesenchymal cells in metastatic cancer cells.36, 37 We labeled epithelial marker E‐cadherin promoter in pE‐cad‐Ctrine and mesenchymal marker N‐cadherin promoter in pN‐cad‐mCherry. In addition, pNanog‐CFP was used for labeling the Nanog promoter (Figure S7). To verify the consistency of fluorescence and native expression, Native E‐cadherin and N‐cadherin protein expression in cells were confirmed by immunofluorescence using their antibodies (Figure S8). Nanog was confirmed by western blot using their antibodies (Figure S9). In the collective invasion, we found that most leaders expressed all of the three markers simultaneously (Figure 4A‐C). Western blot results using their antibodies show that the hybrid epithelial/mesenchymal CSC also express ZEB1, Snail, Twist and vimentin (Figure S9). In the follower cells, it was rare for all three markers to be expressed at the same time (Figure 4D). Most follower cells only expressed E‐cadherin alone. For single cell invasion, most single invasion CSC only expressed N‐cadherin alone (Figure 4E); few cells expressed all three markers at the same time (Figure 4F).
Figure 4.
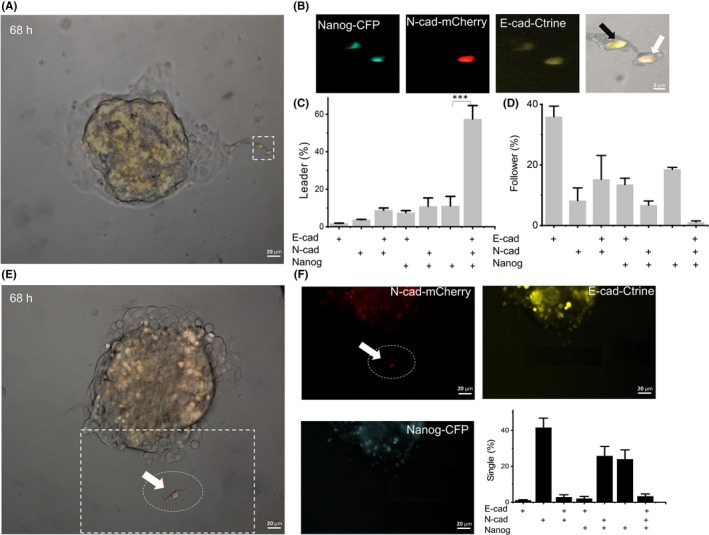
The collective invasive leader cells showed hybrid E/M expression characteristics. A, After 68 h, collective invasion with pE‐cad‐Ctrine, pN‐cad‐mCherry and pNanog‐CFP labeled cells. B, The pictures show the magnified picture in the white box of (A), which is collective invasion. The white arrow indicates the leader and the black arrow indicates the follower. C and D, Dhta show the percentage of positive expression of different genes in leader cells and follower cells. + is positive for relative gene expression; n = 200 cells from 72 spheroids. E, After 68 h, single invasion with pE‐cad‐Ctrine, pN‐cad‐mCherry and pNanog‐CFP labeled cells. F, The pictures show the white box in (E), which is the single invasion. The white arrow indicates the N‐cadherin+ of single invasive cells. Data show that the percentage of positive expression of different genes in single invasive cells. n = 200 cells from 72 spheroids. Data are presented as the means ± SD (n = 3). All P‐values were determined by Student’s t test. *P < 0.05. **P < 0.01. ***P < 0.001
Based on the time‐lapse results, we further recalled the differences in the starting cells of different cell invasion patterns (Figure 5A,B). Results showed that 59.6% of starting collective invasion cells expressed all of the E‐cadherin, N‐cadherin and Nanog simultaneously (Figure 5D), and evolved into the leader cells. After 40 h of continuous observation of the invasion process, we found that the leader cells continued to express three genes from the beginning, driving follower cells to invade from cells spheroids. While in single cell invasions, few cells expressed all three markers at the same time, with approximately 23% of cells expressing Nanog alone and approximately 26% of cells expressing both Nanog and N‐cadherin (Figure 5C).
Figure 5.
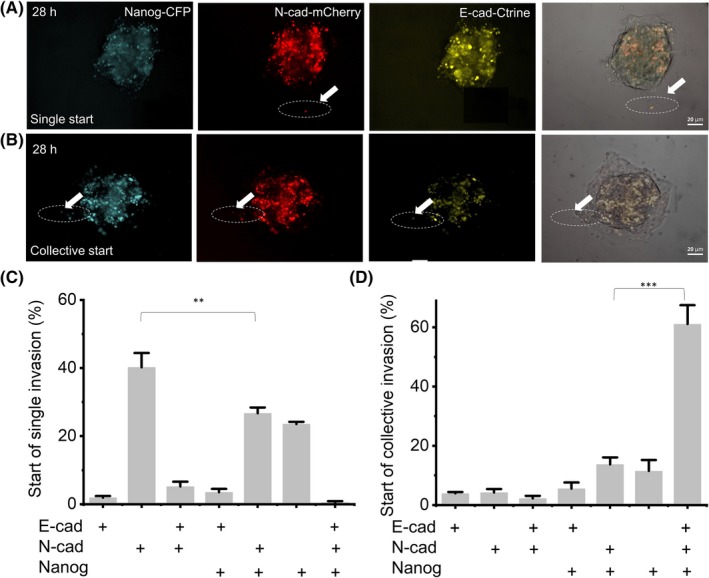
The difference of E/M phenotype expression varies at the beginning of different invasive behaviors. A and B, At 28 h, single invasion (A) and collective invasion (B) with pE‐cad‐Ctrine, pN‐cad‐mCherry and pNanog‐CFP labeled cells. The white arrow indicates the starting cell of invasion. C and D, + is positive gene expression in invasive leader cells. Data show the percentage of positive expression of different genes in starting cells of single (C) and collective (D) invasion; n = 200 cells from 72 spheroids of three independent experiments. Data are presented as the means ± SD (n = 3). All P‐values were determined by Student’s t test. *P < 0.05. **P < 0.01. ***P < 0.001
Since finding the collective invasion led by CSC with hybrid E/M phenotype, we have been exploring the tumorigenesis of hybrid epithelial/mesenchymal CSC. Cultured NSCC and hybrid epithelial/mesenchymal CSC were serially transplanted into the mammary fat pad (MFP) of immunocompromised mice. The enhanced tumorigenic capacity with hybrid epithelial/mesenchymal CSC was assessed by tumorigenesis rate. The tumorigenesis rate of the side inoculated with hybrid epithelial/mesenchymal CSC was higher than that of the side inoculated with NSCC (Figure S10A). In addition, 1 × 10⁶ cells were intravenously injected into the tail vein of BALB/c mice to analyze the tumor cell metastasis ability. Tumor growth and metastatic burden are the BLI value of signals from metastatic tissues; CSC also resulted in improved tumor growth and metastatic burden (Figure S10B).
4. DISCUSSION
Circulating tumor cell cluster formation involves collective cancer cell invasion, which has been the focus of many studies.5, 11, 12, 38, 39 Why do cancer cells collectively invade as a strand? One possible reason that has been proposed is that cells cooperate to promote survival.2, 35 Multicellular packages may provide survival or invasion advantages to escape; studies have shown that metastasis is supported by the polyclonal metastasis of tumor clusters rather than single cell seeds.2, 35 Compared with single CTC, CTC clusters, as a group of invasive cells, often show a greater survival rate and are accompanied by poor clinical prognosis.40 Previous studies have shown that the keratin‐14 positive subpopulation plays a pioneering role in the collective invasion of breast cancer cells.11, 41 Our results showed that breast CSC can augment the probability of collective invasions occurring and make the invasion distance longer, which may increase the probability of metastasis of a tumor.
As the exact markers could be cell line‐dependent, numerous studies have shown that CSC have stronger migration and invasion ability, as well as the ability to differentiate into many different subpopulation of tumor cells.13, 16, 18, 42, 43, 44, 45 In the mammary epithelial cell (HMEC)‐derived HMLER cells, CD44+CD24+ cells with hybrid E/M cells have mammosphere‐forming capacity and exhibit stem‐like characteristics.46 In human breast carcinoma tissue, CD44+CD24− cells (mesenchymal CSC) were present at the tumor invasive edge, while an ALDH1 + epithelial‐like and hybrid E/M BCSC population was localized in the interior close to the tumor stroma.47 In MCF7 and MDA‐MB‐231, CD44+CD24− has classically been defined as belonging to the cancer stem cell population that has the ability of metastasis initiation and tumor formation, as well as, according to many studies, higher drug and radiation resistance.30, 32, 48, 49, 50, 51, 52, 53 Presently, the experimental data showed that CD44+CD24− CSC are gradually distributed in the outer layer of the MCF7 and MDA‐MB‐231 cell spheroids during the process, which makes it easier for CSC to become leaders. An increase in the CD44+CD24+ population was also observed in taxanem, and anthracycline induced a chemotherapy‐tolerant state, which explains a new mechanism of CSC against specific drugs.54 Salinomycin can selectively reduce the CD44+CD24− CSC population.32, 55, 56 We used Salinomycin to treat cell spheroids and found that the outer distribution of CSC could be reduced. This result suggested that eliminating CSC can block the collective invasion, suggesting a new idea for suppressing cancer metastasis. Our results also provide a basis for the study of CSC in collective invasion and new evidence for the role of CSC in tumor metastasis.
The most significant differences between single and clustered CTC involve the expression of cell‐cell junction components, and stemness‐related transcription factor networks being accessible in CTC clusters.3 We found that this difference may be due to the differential expression of invasive cells. The heterophilic junction between E‐cadherin expressed by cancer cells and N‐cadherin expressed by CAF enables cancer cell adhesion, migration and collective invasion.9 Recent studies have found that the specific epigenetic phenotype of the breast cancer cell subpopulation promotes the transition to a more aggressive cell state, in which typical mesenchymal markers are insufficient to mark leading cells.57 Similarly, the leading cells here lack complete EMT characteristics, supporting the notion that invasive cancer cells have partial EMT phenotypes.58 In the present study, more than half of the leader cells expressed both E‐cadherin and N‐cadherin; they also have the characteristics of stem cells with Nanog expression.
The connection of hybrid E/M cells to collective motility has been shown previously in 2D tissue culture motility.59 We further verified that CSC can, indeed, act as leaders to promote collective invasion without complete loss of epithelial morphology and complete acquisition of mesenchymal morphology caused effective metastasis (Figure 4); it is hard to see three positive co–expressions simultaneously in followers and in single invasion cells. In Ewald’s group findings, E‐cad functions as an invasion suppressor, survival factor and promoter of metastasis, but cells can continue to express E‐Cadherin in a hybrid state to invade the ECM, so the balance E‐cad protein level dynamics or a partial‐or‐hybrid EMT state may be particularly important during systemic dissemination, invasion and early seeding.60 By acquiring partial EMT, cancer cells with hybrid E/M phenotypes can undergo collective invasion through their remaining epithelial character4, 11 and enhance motility by achieving mesenchymal character.61, 62, 63 In addition, with stem cell characteristics, they have a stronger viability;43, 64 this makes the collective invasion led by CSC with hybrid E/M phenotype more aggressive.
Together, our study provides key insights into the biology of cancer cell invasion and metastasis. CSC are actively involved in the progression of cancer and provide a new concept for the collective cancer invasion model. Through co–expression of E‐cadherin and N‐cadherin, CSC promoted collective cancer invasion and metastasis as leaders. Our present observations may predict a new strategy for cancer metastasis, including interventions targeting CSC.
DISCLOSURE
The authors have no competing interests to declare.
Supporting information
ACKNOWLEDGEMENT
The work is supported by the National Natural Science Foundation of China (11875079, 11434001, 31872792 and 31571540) and the Project of State Key Laboratory of Agrobiotechnology (2016SKLAB‐1). We would like to thank Luo lab (Center for Quantitative Biology at Peking University) for technical support and helpful discussions.
Quan Q, Wang X, Lu C, et al. Cancer stem‐like cells with hybrid epithelial/mesenchymal phenotype leading the collective invasion. Cancer Sci. 2020;111:467–476. 10.1111/cas.14285
Funding information
Project of State Key Laboratory of Agrobiotechnology (Grant/Award Number: 2016SKLAB‐1) and National Natural Science Foundation of China (Grant/Award Numbers: 11434001, 11875079, 31571540 and 31872792).
Contributor Information
Chao Wang, Email: wangcam@126.com.
Gen Yang, Email: gen.yang@pku.edu.cn.
DATA AVAILABILITY STATEMENT
Data that support the findings of this study have been deposited in [figshare] with the identifier https://doi.org/10.6084/m9.figshare.9118976.v1 and https://doi.org/10.6084/m9.figshare.9116705.v1
REFERENCES
- 1. Steeg PS. Targeting metastasis. Nat Rev Cancer. 2016;16:201‐218. [DOI] [PMC free article] [PubMed] [Google Scholar]
- 2. Aceto N, Bardia A, Miyamoto D, et al. Circulating tumor cell clusters are oligoclonal precursors of breast cancer metastasis. Cell. 2014;158:1110‐1122. [DOI] [PMC free article] [PubMed] [Google Scholar]
- 3. Gkountela S, Castro‐Giner F, Szczerba BM, et al. Circulating tumor cell clustering shapes DNA methylation to enable metastasis seeding. Cell. 2019;176:98‐112.e14. [DOI] [PMC free article] [PubMed] [Google Scholar]
- 4. Bazellieres E, Conte V, Elosegui-Artola A, et al. Mechanical control of collective cell migration by the intercellular adhesome. Mol Biol Cell. 2013;24:2. [Google Scholar]
- 5. Cheung KJ, Ewald AJ. A collective route to metastasis: Seeding by tumor cell clusters. Science. 2016;352:167‐169. [DOI] [PMC free article] [PubMed] [Google Scholar]
- 6. Miron‐Mendoza M, Graham E, Kivanany P, Quiring J, Petroll WM. The role of thrombin and cell contractility in regulating clustering and collective migration of corneal fibroblasts in different ECM environments. Invest Ophthalmol Vis Sci. 2015;56:2079‐2090. [DOI] [PMC free article] [PubMed] [Google Scholar]
- 7. Attar MKA, Anwar MA, Eskian M, Keshavarz‐Fathi M, Choi S, Rezaei N. Basic understanding and therapeutic approaches to target toll‐like receptors in cancerous microenvironment and metastasis. Med Res Rev. 2018;38:1469‐1484. [DOI] [PubMed] [Google Scholar]
- 8. Spill F, Reynolds DS, Kamm RD, Zaman MH. Impact of the physical microenvironment on tumor progression and metastasis. Curr Opin Biotechnol. 2016;40:41‐48. [DOI] [PMC free article] [PubMed] [Google Scholar]
- 9. Labernadie A, Kato T, Brugués A, et al. A mechanically active heterotypic E‐cadherin/N‐cadherin adhesion enables fibroblasts to drive cancer cell invasion. Nat Cell Biol. 2017;19:224‐237. [DOI] [PMC free article] [PubMed] [Google Scholar]
- 10. Condeelis J, Pollard JW. Macrophages: obligate partners for tumor cell migration, invasion, and metastasis. Cell. 2006;124:263‐266. [DOI] [PubMed] [Google Scholar]
- 11. Cheung KJ, Gabrielson E, Werb Z, Ewald AJ. Collective invasion in breast cancer requires a conserved basal epithelial program. Cell. 2013;155:1639‐1651. [DOI] [PMC free article] [PubMed] [Google Scholar]
- 12. Kim YH, Choi YW, Lee J, Soh EY, Kim J‐H, Park TJ. Senescent tumor cells lead the collective invasion in thyroid cancer. Nat Commun. 2017;8:14. [DOI] [PMC free article] [PubMed] [Google Scholar]
- 13. Visvader JE, Lindeman GJ. Cancer stem cells in solid tumours: accumulating evidence and unresolved questions. Nat Rev Cancer. 2008;8:755‐768. [DOI] [PubMed] [Google Scholar]
- 14. Batlle E, Clevers H. Cancer stem cells revisited. Nat Med. 2017;23:1124‐1134. [DOI] [PubMed] [Google Scholar]
- 15. Cazet AS, Hui MN, Elsworth BL, et al. Targeting stromal remodeling and cancer stem cell plasticity overcomes chemoresistance in triple negative breast cancer. Nat Commun. 2018;9. [DOI] [PMC free article] [PubMed] [Google Scholar]
- 16. Krause M, Dubrovska A, Linge A, Baumann M. Cancer stem cells: Radioresistance, prediction of radiotherapy outcome and specific targets for combined treatments. Adv Drug Deliv Rev. 2017;109:63‐73. [DOI] [PubMed] [Google Scholar]
- 17. Peng F, Wang J‐H, Fan W‐J, et al. Glycolysis gatekeeper PDK1 reprograms breast cancer stem cells under hypoxia. Oncogene. 2018;37:1062‐1074. [DOI] [PMC free article] [PubMed] [Google Scholar]
- 18. Wang TY, Fahrmann JF, Lee H, et al. JAK/STAT3‐regulated fatty acid beta‐oxidation is critical for breast cancer stem cell self‐renewal and chemoresistance. Cell Metab. 2018;27:1357. [DOI] [PMC free article] [PubMed] [Google Scholar]
- 19. Reya T, Morrison SJ, Clarke MF, Weissman IL. Stem cells, cancer, and cancer stem cells. Nature. 2001;414:105‐111. [DOI] [PubMed] [Google Scholar]
- 20. Lawson DA, Bhakta NR, Kessenbrock K, et al. Single‐cell analysis reveals a stem‐cell program in human metastatic breast cancer cells. Nature. 2015;526: 131‐135. [DOI] [PMC free article] [PubMed] [Google Scholar]
- 21. Bredemeier M, Edimiris P, Mach P, et al. Gene expression signatures in circulating tumor cells are prognostic for metastatic lesions in breast cancer patients and correlate with response to therapy. Can Res. 2016;76:4. [DOI] [PubMed] [Google Scholar]
- 22. Jeon H‐M, Lee J. MET: roles in epithelial‐mesenchymal transition and cancer stemness. Ann Transl Med. 2017;5. [DOI] [PMC free article] [PubMed] [Google Scholar]
- 23. Xing J, Tian X. Investigating epithelial‐to‐mesenchymal transition with integrated computational and experimental approaches. Phys Biol. 2019;16:031001. [DOI] [PMC free article] [PubMed] [Google Scholar]
- 24. Lo HC, Zhang X‐F. EMT in metastasis: finding the right balance. Dev Cell. 2018;45:663‐665. [DOI] [PubMed] [Google Scholar]
- 25. Floor S, van Staveren WCG, Larsimont D, Dumont JE, Maenhaut C. Cancer cells in epithelial‐to‐mesenchymal transition and tumor‐propagating‐cancer stem cells: distinct, overlapping or same populations. Oncogene. 2011;30:4609‐4621. [DOI] [PubMed] [Google Scholar]
- 26. Saitoh M. Involvement of partial EMT in cancer progression. J Biochem. 2018;164:257‐264. [DOI] [PubMed] [Google Scholar]
- 27. Jolly MK. Implications of the hybrid epithelial/mesenchymal phenotype in metastasis. Front Oncol. 2015;5. [DOI] [PMC free article] [PubMed] [Google Scholar]
- 28. Sotgia F, Fiorillo M, Lisanti MP. Hallmarks of the cancer cell of origin: comparisons with "energetic" cancer stem cells (e‐CSCs). Aging‐US. 2019;11:1065‐1068. [DOI] [PMC free article] [PubMed] [Google Scholar]
- 29. Lun SW‐M, Cheung ST, Cheung PFY, et al. CD44+ cancer stem‐like cells in EBV‐associated nasopharyngeal carcinoma. PLoS ONE. 2012;7:e52426. [DOI] [PMC free article] [PubMed] [Google Scholar]
- 30. Kim D‐H, Yoon H‐J, Cha Y‐N, Surh Y‐J. Role of heme oxygenase‐1 and its reaction product, carbon monoxide, in manifestation of breast cancer stem cell‐like properties: Notch‐1 as a putative target. Free Radical Res. 2018;52:1336‐1347. [DOI] [PubMed] [Google Scholar]
- 31. Li CW, Heidt DG, Dalerba P, et al. Identification of pancreatic cancer stem cells. Can Res. 2007;67:1030‐1037. [DOI] [PubMed] [Google Scholar]
- 32. An H, Kim JY, Oh E, Lee N, Cho Y, Seo JH. Salinomycin promotes anoikis and decreases the CD44(+)/CD24(−) stem‐like population via inhibition of STAT3 activation in MDA‐MB‐231 cells. PLoS ONE. 2015;10:e0141919. [DOI] [PMC free article] [PubMed] [Google Scholar]
- 33. Li C, Lee CJ, Simeone DM. Identification of human pancreatic cancer stem cells. Methods Mol Biol. 2009;568:161‐173. [DOI] [PubMed] [Google Scholar]
- 34. Gwak JM, Kim HJ, Kim EJ, et al. MicroRNA‐9 is associated with epithelial‐mesenchymal transition, breast cancer stem cell phenotype, and tumor progression in breast cancer. Breast Cancer Res Treat. 2014;147:39‐49. [DOI] [PubMed] [Google Scholar]
- 35. Konen J, Summerbell E, Dwivedi B, et al. Image‐guided genomics of phenotypically heterogeneous populations reveals vascular signalling during symbiotic collective cancer invasion. Nat Commun. 2017;8:15. [DOI] [PMC free article] [PubMed] [Google Scholar]
- 36. Zheng X, Carstens JL, Kim J, et al. Epithelial‐to‐mesenchymal transition is dispensable for metastasis but induces chemoresistance in pancreatic cancer. Nature. 2015;527:525–530. [DOI] [PMC free article] [PubMed] [Google Scholar]
- 37. Fischer KR, Durrans A, Lee S, et al. Epithelial‐to‐mesenchymal transition is not required for lung metastasis but contributes to chemoresistance. Nature. 2015;527:472–476. [DOI] [PMC free article] [PubMed] [Google Scholar]
- 38. Grasset EM, Bertero T, Bozec A, et al. Matrix stiffening and EGFR cooperate to promote the collective invasion of cancer cells. Can Res. 2018;78:5229‐5242. [DOI] [PubMed] [Google Scholar]
- 39. Haeger A, Krause M, Wolf K, Friedl P. Cell jamming: collective invasion of mesenchymal tumor cells imposed by tissue confinement. Biochim Biophys Acta Gen Subj. 2014;1840:2386‐2395. [DOI] [PubMed] [Google Scholar]
- 40. Hou JM, Krebs MG, Lancashire L, et al. Clinical significance and molecular characteristics of circulating tumor cells and circulating tumor microemboli in patients with small‐cell lung cancer. J Clin Oncol. 2012;30:525‐532. [DOI] [PubMed] [Google Scholar]
- 41. Cheung KJ, Padmanaban V, Silvestri V, et al. Polyclonal breast cancer metastases arise from collective dissemination of keratin 14‐expressing tumor cell clusters. Proc Natl Acad Sci USA. 2016;113:E854‐E863. [DOI] [PMC free article] [PubMed] [Google Scholar]
- 42. Driessens G, Beck B, Caauwe A, Simons BD, Blanpain C. Defining the mode of tumour growth by clonal analysis. Nature. 2012;488: 527–530. [DOI] [PMC free article] [PubMed] [Google Scholar]
- 43. Patel S, Rawal R. Role of miRNA dynamics and cytokine profile in governing CD44v6/Nanog/PTEN axis in oral cancer: modulating the master regulators. Tumor Biol. 2016;37:14565‐14575. [DOI] [PubMed] [Google Scholar]
- 44. Singh SK, Hawkins C, Clarke ID, et al. Identification of human brain tumour initiating cells. Nature. 2004;432:396‐401. [DOI] [PubMed] [Google Scholar]
- 45. Wang W‐J, Wu S‐P, Liu J‐B, et al. MYC Regulation of CHK1 and CHK2 promotes radioresistance in a stem cell‐like population of nasopharyngeal carcinoma cells. Can Res. 2013;73:1219‐1231. [DOI] [PubMed] [Google Scholar]
- 46. Grosse‐Wilde A, Fouquier d’Hérouël A, McIntosh E, et al. Stemness of the hybrid epithelial/mesenchymal state in breast cancer and its association with poor survival. PLoS ONE. 2015;10. [DOI] [PMC free article] [PubMed] [Google Scholar]
- 47. Bocci F, Gearhart‐Serna L, Boareto M, et al. Toward understanding cancer stem cell heterogeneity in the tumor microenvironment. Proc Natl Acad Sci USA. 2019;116:148‐157. [DOI] [PMC free article] [PubMed] [Google Scholar]
- 48. Sun X, Jiang S, Liu J, et al. MiR‐208a stimulates the cocktail of SOX2 and beta‐catenin to inhibit the let‐7 induction of self‐renewal repression of breast cancer stem cells and formed miR208a/let‐7 feedback loop via LIN28 and DICER1. Oncotarget. 2015;6:32944‐32954. [DOI] [PMC free article] [PubMed] [Google Scholar]
- 49. Patrawala L, Calhoun T, Schneider‐Broussard R, Zhou J, Claypool K, Tang DG. Side population is enriched in tumorigenic, stem‐like cancer cells, whereas ABCG2(+) and ABCG2(−) cancer cells are similarly tumorigenic. Can Res. 2005;65:6207‐6219. [DOI] [PubMed] [Google Scholar]
- 50. Okuda H, Xing F, Pandey PR, et al. miR‐7 suppresses brain metastasis of breast cancer stem‐like cells by modulating KLF4. Can Res. 2013;73:1434‐1444. [DOI] [PMC free article] [PubMed] [Google Scholar]
- 51. Liang Y, Quan YI, Fu Q, et al. Dynamics between cancer cell subpopulations reveals a model coordinating with both hierarchical and stochastic concepts. PLoS ONE. 2014;9:e84654. [DOI] [PMC free article] [PubMed] [Google Scholar]
- 52. Liu Y, Kobayashi A, Fu Q, et al. Rescue of targeted nonstem‐like cells from bystander stem‐like cells in human fibrosarcoma HT1080. Radiat Res. 2015;184:334‐340. [DOI] [PubMed] [Google Scholar]
- 53. Quan Y, Yan Y, Wang X, et al. Impact of cell dissociation on identification of breast cancer stem cells. Cancer Biomarkers. 2012;12:125‐133. [DOI] [PubMed] [Google Scholar]
- 54. Goldman A, Majumder B, Dhawan A, et al. Temporally sequenced anticancer drugs overcome adaptive resistance by targeting a vulnerable chemotherapy‐induced phenotypic transition. Nat Commun. 2015;6. [DOI] [PMC free article] [PubMed] [Google Scholar]
- 55. Gupta P. Transcription profiling of human HMLER breast cancer cells treated with paclitaxel and salinomycin‐treated HMLER breast cancer cells. ArrayExpress Archive. 2009. [Google Scholar]
- 56. Huang X, Borgström B, Kempengren S, et al. Breast cancer stem cell selectivity of synthetic nanomolar‐active salinomycin analogs. BMC Cancer. 2016;16. [DOI] [PMC free article] [PubMed] [Google Scholar]
- 57. Westcott JM, Prechtl AM, Maine EA, et al. An epigenetically distinct breast cancer cell subpopulation promotes collective invasion. J Clin Invest. 2015;125:1927‐1943. [DOI] [PMC free article] [PubMed] [Google Scholar]
- 58. Tam WL, Weinberg RA. The epigenetics of epithelial‐mesenchymal plasticity in cancer. Nat Med. 2013;19:1438‐1449. [DOI] [PMC free article] [PubMed] [Google Scholar]
- 59. Jolly MK, Tripathi SC, Jia D, et al. Stability of the hybrid epithelial/mesenchymal phenotype. Oncotarget. 2016;7:27067‐27084. [DOI] [PMC free article] [PubMed] [Google Scholar]
- 60. Padmanaban V, Krol I, Suhail Y, et al. E‐cadherin is required for metastasis in multiple models of breast cancer. Nature. 2019;573:439‐444. [DOI] [PMC free article] [PubMed] [Google Scholar]
- 61. Etienne‐Manneville S. Polarity proteins in migration and invasion. Oncogene. 2008;27:6970‐6980. [DOI] [PubMed] [Google Scholar]
- 62. Yang MH, Chen C‐L, Chau G‐Y, et al. Comprehensive analysis of the independent effect of Twist and Snail in promoting metastasis of hepatocellular carcinoma. Hepatology. 2009;50:1464‐1474. [DOI] [PubMed] [Google Scholar]
- 63. Son H, Moon A. Epithelial‐mesenchymal transition and cell invasion. Toxicol. Res. 2010;26:245‐252. [DOI] [PMC free article] [PubMed] [Google Scholar]
- 64. Eppert K, Takenaka K, Lechman ER, et al. Stem cell gene expression programs influence clinical outcome in human leukemia. Nat Med. 2011;17:1086‐1093. [DOI] [PubMed] [Google Scholar]
Associated Data
This section collects any data citations, data availability statements, or supplementary materials included in this article.
Supplementary Materials
Data Availability Statement
Data that support the findings of this study have been deposited in [figshare] with the identifier https://doi.org/10.6084/m9.figshare.9118976.v1 and https://doi.org/10.6084/m9.figshare.9116705.v1