Abstract
O-(2-[18F]fluoroethyl)-l-tyrosine positron-emission tomography/computed tomography (18F-FET PET/CT) is well known in brain tumor management. Our study aimed to identify the prognostic value of 18F-FET PET/CT in high-grade gliomas (HGG) according the current 2016 World Health Organization (WHO) classification.
Patients with histologically proven WHO 2016 HGG were prospectively included. A dynamic 18F-FET PET/CT was performed allowing to obtain 2 static PET frames (static frame 1: 20–40 minutes and static frame 2: 2–22 minutes). We analyzed static parameters (standard uptake value [SUV]max, SUVmean, SUVpeak, TBRmax, TBRmean, tumoral lesion glycolysis, and metabolic tumoral volume) for various isocontours (from 10% to 90%). PET parameters, clinical features, and molecular biomarkers were compared with progression-free survival (PFS) and overall survival (OS) in univariate and multivariate analysis.
Twenty-nine patients were included (grade III n = 3, grade IV n = 26). Mean PFS and OS were, respectively, 8.8 and 13.9 months. According to univariate analysis, SUVmean, SUVpeak, TBRmax, and TBRmean were significantly correlated with OS. In static 1 analysis, TBRmax seemed to be the best OS prognostic parameter (P = .004). In static 2 analysis, TBRmean was the best parameter (P = .01). In static 1 analysis, only SUVpeak was significant (P = .05) for PFS. Good performance status (PS < 2; P < .0001) and extent of resection (P = .019) identified the subgroup of patients with the best OS. Only TBRmax (P = .026) and extent of resection (P = .025) remained significant parameters in multivariate analysis.
Our data suggested that high TBRmax seemed to be the most significant OS independent prognostic factor in patients with newly diagnosed HGG.
Keywords: amino acid, O-(2-[18F]fluoroethyl)-l-tyrosine positron-emission tomography, high-grade glioma, glioblastoma, prognostic value, tumor background ratio
1. Introduction
Glioblastomas (GBMs) are the 3rd most frequently reported histology of primary brain and other central nervous system (CNS) tumors and represent 56.6% of gliomas. Incidence rate is 3.21 per 100,000 population with a median age of diagnostic about 65 years old and GBM are 1.58 times more common in males.[1] Median survival of GBM is 16 months in patients treated with maximum safe resection, radiotherapy (RT), and temozolomide (TMZ).[2,3] Most of the studies have included gliomas categorized according to the World Health Organization (WHO) 2007 classification modified recently in 2016 and which has implemented molecular features for gliomas subdivision.[4] Prognostic value of molecular parameters is important for overall survival (OS). For example, in a retrospective review of GBM between 2006 and 2012 with 330 patients, OS of isocitrate dehydrogenase 1 (IDH1)-muted GBM was 83 months vs 22 months for wild-type GBM (P = .0005).[5] This new molecular profiling allowed to separate GBM into prognostic groups. Magnetic resonance imaging (MRI) is the gold standard and noninvasive method for GBM diagnostic. Although morphologic assessment by MRI is precise, it lacks specificity and does not allow determining the tumor activity and metabolism. Moreover, the MRI ability to evaluate a prognosis can depend of the contrast enhancement of the tumor.[6,7] Nevertheless, recurrence can occur at distance from the contrast-enhancing margin of the initial tumor as highlighted by Wallner et al.[8]
Molecular imaging with positron-emission tomography/computed tomography (PET/CT) allows information on tumor metabolism, identifying zones of highest activity.[9] This imaging test has already proven its value in brain tumor management including grading,[10–12] tumor extent delineation,[13] and biopsy guidance.[14,15] Radiolabeled amino tracers for PET has constituted an innovative class of tumor-imaging agents.[16] One of the most promising tracers is the O-(2-[18F]fluoroethyl)-l-tyrosine (18F-FET), which has already showed its potential interest for diagnosis.[13,17] The latest guidelines from European Association of Nuclear Medicine (EANM)/European Association of Neuro-Oncology (EANO)/Response Assessment in Neuro-Oncology (RANO) published in 2019 help nuclear medicine practitioners in recommending, performing, interpreting, and reporting the results of brain PET imaging. Prognostic value of 18F-FET PET/CT[18,19] was evaluated for gliomas categorized according to the WHO 2007 classification. In this context, the aim of this study was to investigate the prognostic value of the 18F-FET PET/CT in high-grade gliomas (HGGs) according the current WHO 2016 classification.
2. Materials and methods
2.1. Trial design
This was a prospective monocentric study (NTC03370926). The study protocol was approved by the institutional review board. There was no conflict with the Declaration of Helsinki. Written informed consent for study participation was obtained from all patients before initiation of PET investigations and the use of the data for scientific evaluations.
2.2. Inclusion criteria
Patients were eligible if they were older than 18 years old, HGG (grade 3 or 4 WHO 2016) diagnosed with histology proven by stereotactic biopsy or open tumor resection.
2.3. Exclusion criteria
Performance status (PS) > 2, previous encephalic RT, pregnancy, breast feeding, inability to undergo MRI or 18F-FET PET/CT for any reason.
After histology confirmation, all patients were scheduled to undergo radiochemotherapy (RCx) with TMZ according to the Stupp protocol.[20]
We collected clinical data including age, sex, date of diagnosis, PS, treatments, and tolerance. We also reported biologic and genetic features: histology, MGMT (O-6-methylguanine-DNA methyltransferase) promoter methylation status, IDH1/2 mutation.
2.4. Magnetic resonance imaging
All patients underwent MRI using a 1.5 MR scanner (Magnetom Avanto Fit Siemens, Siemens healthineers, Erlangen, Germany; 31/5/2016).
The standardized sequence protocol comprised axial diffusion-weighted, an axial T2-weighted, an axial fluid attenuation inversion recovery (FLAIR) sequence, 3D T1-weighted gradient-echo enhanced by gadolinium-chelate contrast sequences, axial T2∗. For dynamic susceptibility contrast gradient-echo planar imaging, an echo time of 30 milliseconds, a repetition time of 2290 milliseconds, and a flip angle of 90° were chosen based on our past experience with optimizing the perfusion sequence. Thirty sections (5 mm thick, 0 gap) were acquired over 100 times points.
Perfusion parameters processing was performed using Olea Sphere software (v3.0 Olea Medical, la Ciotat, France) to generate relative cerebral blood volume corrected for contrast leakage and to generate a permeability estimation map (K2).
2.5. 18F-FET PET/CT imaging
According to the EANM/EANO/RANO practice guidelines for brain tumor imaging, the radiolabeled amino acid 18F-FET was produced by qualified personnel.[21] The radiopharmaceutical was delivered ready to use. A minimum 4-hour fast was recommended for all patients before PET acquisition. PET imaging was performed on 2 PET/CT systems (biograph mCT40 Flow and biograph mCT64; Siemens, Siemens Healthineers, Knoxville, TN). For attenuation correction, a low-dose CT scan was performed without injection of contrast product. CT acquisition parameters were 16 × 1.2 mm pitch 0.55 with automatic kVp and mAs modulation. CT reconstruction parameters were slice thickness 3/3 mm, convolution kernel H31s, field of view 500 mm for attenuation correction, and slice thickness 2/1.2 mm, convolution kernel J30s, safire 3, field of view 300 mm for reading. After CT examination, the acquisition was centered on the head and consisted of a 40-minute dynamic acquisition after the intravenous injection of 3 MBq/kg. PET dynamic reconstructions were performed with 10 × 4 minute frames, the reconstruction algorithm was 3DOSEM + TOF+PSF (TrueX) with 2002 matrix, zoom2, 2 iterations, 21 subsets, Gaussian postfilter 2 mm. A single static FET PET frame was obtained by sum 20 to 40 minutes (static frame 1) and an early other static frame (static frame 2) by sum 2 to 22 minutes.
2.6. Data analysis
Images were 1st analyzed visually by only 1 person. Upon identification of the axial PET image slice displaying the maximum tumor uptake, volume of interest (VOI) was selected. This region was based on the summed PET data from 20 to 40 minutes after injection.
Static frame 1 (20–40 minutes) and static frame 2 (2–22 minutes) images were transferred to a MIM workstation (MiM, software Inc., v6.8.3, Cleveland, Ohio, USA) to calculate different PET/CT parameters: Standard uptake value (SUV)mean, SUVmax, SUVpeak, total lesion glycolysis (TLG). TLG was calculated by multiplying the SUVmean by the metabolic tumor volume (MTV). A 2nd region of reference (background activity) was selected in an area of normal brain tissue including white and gray matter on the contralateral hemisphere. It was defined by drawing a crescent-shaped VOI (called “banana”) resulting from the summation of 6 subsequent region of interest 20 to 25 mm in diameter.[22] Therefore, mean and max tumor to background ratios (TBRmean and TBRmax) were calculated by dividing the mean and max SUV of the tumor by the mean background.
The 18F-FET uptake in the tumor was determined by a 3-dimensional auto-contouring process using several isocontours between 10% and 90% (I10, I20, I30, I40, I50, I60, I70, I80, and I90). These detailed parameters were calculated for various isocontours (from 10% to 90%) as illustrated in Figure 1.
Figure 1.
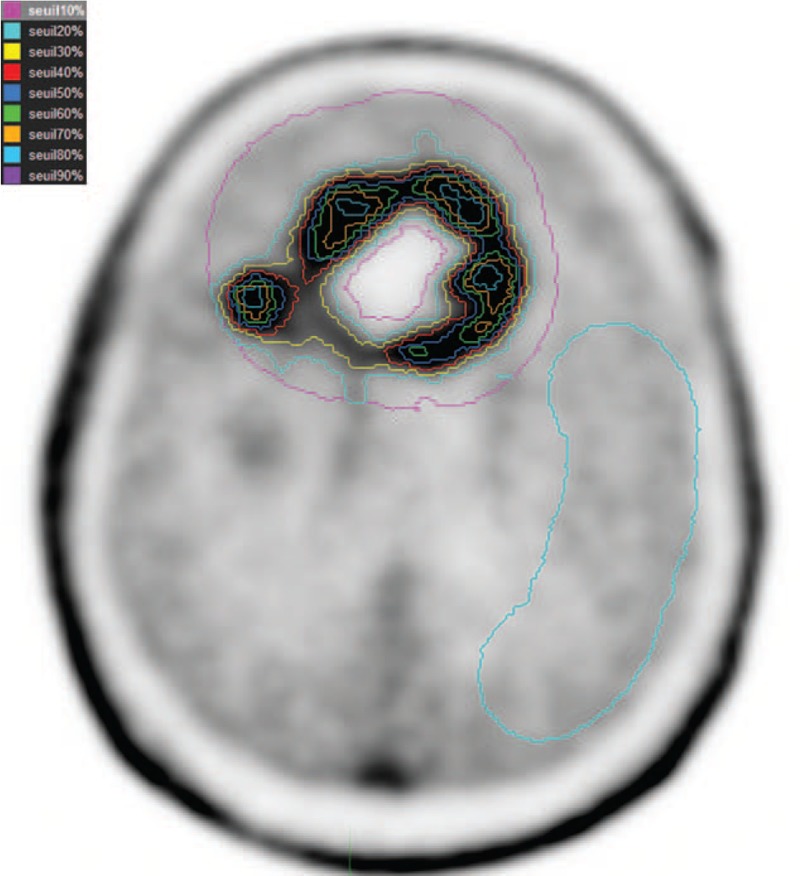
Various isocontours (from 10% to 90%) located on glioma and a 2nd region of reference (background activity) in an area of normal brain tissue including white and gray matter have been illustrated.
2.7. Histopathology, WHO classification, and molecular genetic markers
All patients underwent either stereotactic biopsy or surgery for histopathologic analysis. Histologic classification, molecular genetic analysis, and tumor grading were accomplished by an experienced neuropathologist.
All samples were histologically assessed and graded using hematoxylin and eosin according to the 2016 WHO criteria.[4] Immunohistochemistry for detection of the IDH1 R132H was performed using monoclonal antibody. For IDH2 mutations, pyrosequencing was performed. In addition, determination of MGMT promoter methylation was performed using methylation-specific pyrosequencing.[23]
2.8. Treatment and follow-up
According to neurosurgical reports, 7 surgical interventions were rated as total, 4 as subtotal, 3 as partial and 15 as simple biopsy. Surgery was followed by RT with concomitant TMZ. RT planning was done using slices in thickness and spacing of 2.5 mm acquired throughout the entire head. Patients were simulated and treated in the same immobilized thermoplastic mask system. Radiation treatment planning was performed with Pinnacle TPS (Philips Healthcare, Fitchburg, WI). Radiation therapy was prescribed to 60 Gy in 30 fractions, where the 95% isodose contour encompassed the planning target volume (PTV) according to EORTC guidelines.[20] The gross tumor volume (GTV) was defined as the contrast enhanced tumor postcontrast T1 image on the baseline MRI scan. The clinical target volume (CTV) was defined as the GTV + 2 cm margin. The PTV was defined as the CTV + 0.4 cm margin for patient setup inconsistencies.
2.9. Statistical analysis
Study endpoints were OS and progression-free survival (PFS). OS was defined as time from the date of surgery/biopsy until death. PFS was defined as time from the date of surgery/biopsy until disease progression. Disease progression was determined by 1 radiologist on MRI according to RANO criteria. Seven 18F-FET PET/CT parameters were recorded according to the 2 static frames (static frames 1 and 2) acquisition (SUVmax, SUVmean, SUVpeak, TBRmax, TBRmean, TLG, and MTV). Due to our little cohort, we decided to take the median for each parameter to separate 2 groups.
Statistical analyses were performed using XLStat life software (Addinsoft, Paris, France). OS or PFS were analyzed by the Kaplan–Meir method. A P-value ≤.05 was considered statistically significant. As general prognostic factors, the extent of resection, MGMT status, PS, age, and sex were considered. Parameters which were significant in univariate analysis (including clinical data, PET parameters, treatments, immunohistochemistry, and genetic molecular features) were included in multivariate models. Indeed, we know that covariates can potentially affect patient prognosis. For this multivariate analysis, we used Cox model which is the most commonly used multivariate approach for analysis survival time data in medical research. No correction of P-values was applied to adjust for multiple test.
3. Results
3.1. Patients and treatments
Twenty-nine patients with newly diagnosed HGG and treated with radiochemotherapy were included between November 2016 and December 2018. Patients’ characteristics are summarized in Table 1.
Table 1.
Characteristics of patients.
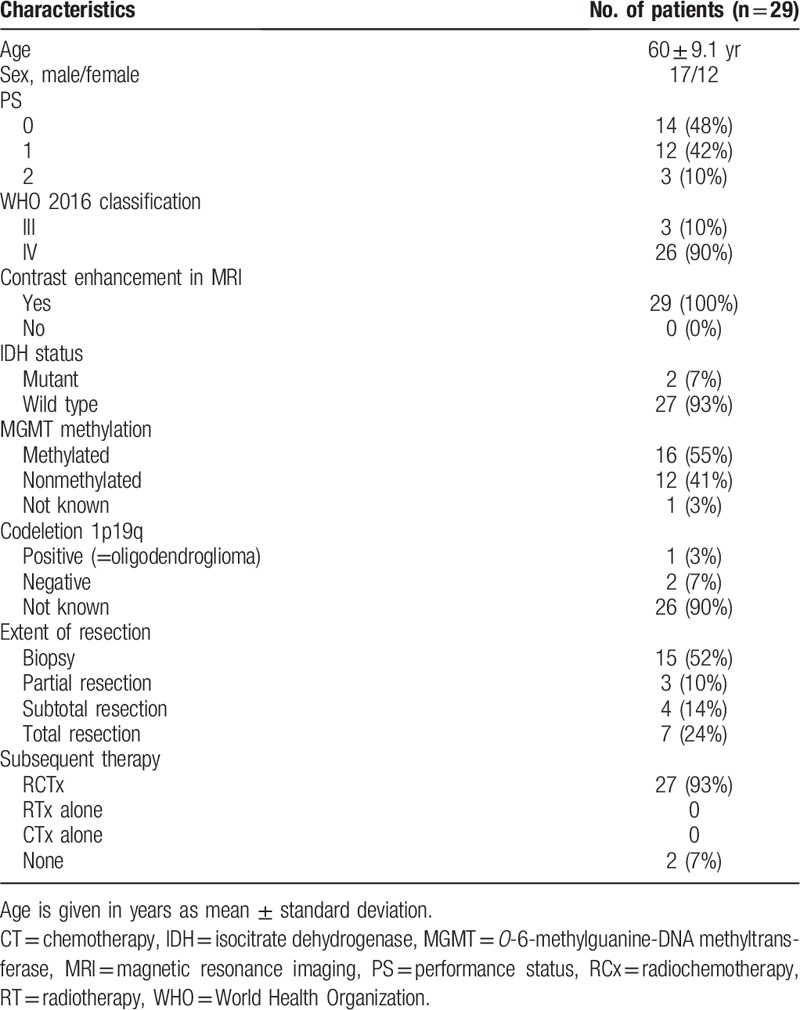
Twenty-six were GBM and 3 grades III (2 anaplastic astrocytoma and 1 anaplastic oligodendroglioma) according to the WHO 2016 classification. PS was well preserved, with a median PS = 0.5. Mean follow-up time was 13.9 ± 7.2 months. On the date of last follow-up, 13 patients died (12 GBM, 1 grade III astrocytoma). All deaths were tumor associated. None was lost to follow-up. Sixteen patients are still alive whose 7 patients without any tumor progression. Twenty-seven patients underwent a complete course of RCx, 2 patients did not undergo RCx because of clinical progression with rapid deterioration of the general condition. Twenty patients have received adjuvant TMZ whose 8 had 6 cycles at least and others had progression. Among those who did not have adjuvant TMZ, it was due to grade III hematologic toxicities, grade III cytolysis hepatic during the concomitant protocol or disease progression. Many patients have benefited from 2nd-line treatment as follows: 15 patients benefited from Bevacizumab in 2nd line (Bevacizumab alone [n = 8], association with TMZ [n = 1], with Irinotecan [n = 5], with Belustine [n = 1]). The other patients were treated by TMZ (n = 1), carmustine implant with surgery (n = 1), Depatuxizumab Mafodotine with TMZ (n = 1), association Procarbazine, Lomustine, Vincristine (n = 1).
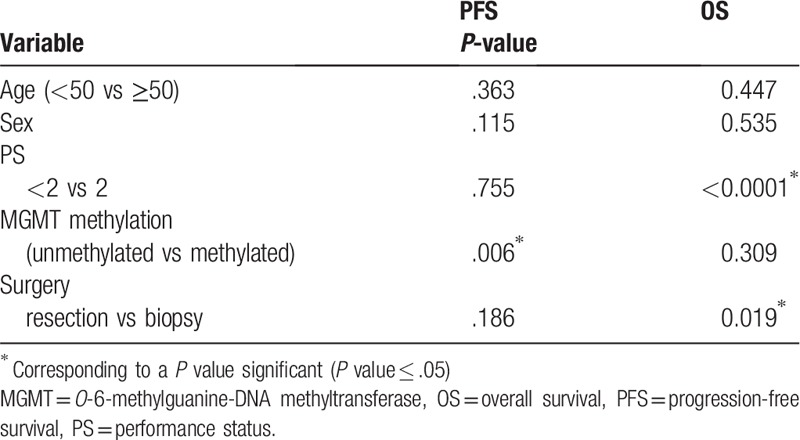
Every patient had 18F-FET PET/CT according to the standardized acquisition protocol after injection of 209 MBq ± 34 MBq of 18F-FET (Fig. 2). The median time between surgery/biopsy and PET/CT was 34 days (range, 12–60 days). Genomic status was available for most of the patients: MGMT methylation (28 of 29 patients), IDH mutation (29/29), 1p19q (3/29). The codeletion 1p19q was only obtained if the histology was grade III. Mean PFS and OS (N = 29) were 8.8 ± 5.5 months (median 6.5; range, 3–25.1) and 13.9 ± 7.2 months (median 12.2; range, 3–28.9), respectively. Prognostic factors such as extent of surgery/biopsy and PS were associated with OS while MGMT status was correlated with PFS (Table 2).
Figure 2.
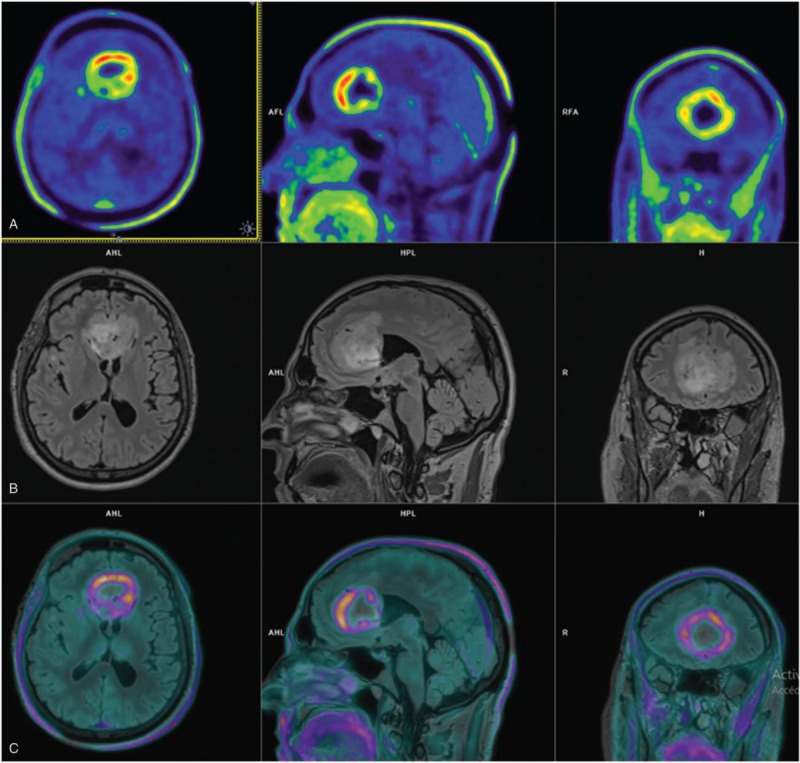
Comparison of O-(2-[18F]fluoroethyl)-l-tyrosine positron-emission tomography (18F-FET PET) and T2 fluid attenuation inversion recovery (FLAIR) magnetic resonance images (MRIs) of 1 patient. (A) 18F-FET PET/computed tomography (CT) shows metabolically active bifrontal tumor mass. (B) MRI shows T2 FLAIR-hyperintense tumor and perifocal edema. (C) MRI and 18F-FET PET/CT image fusion reveal complementary information with inconsistent overlap of hypersignal in T2 and 18F-FET uptake.
Table 2.
Univariate survival analysis according to clinical and biologic factors.
3.2. Univariate survival analysis according to 18F-FET PET/CT parameters (OS and PFS) (Table 3)
Table 3.
Univariate survival analysis for different 18F-FET PET-based parameters.
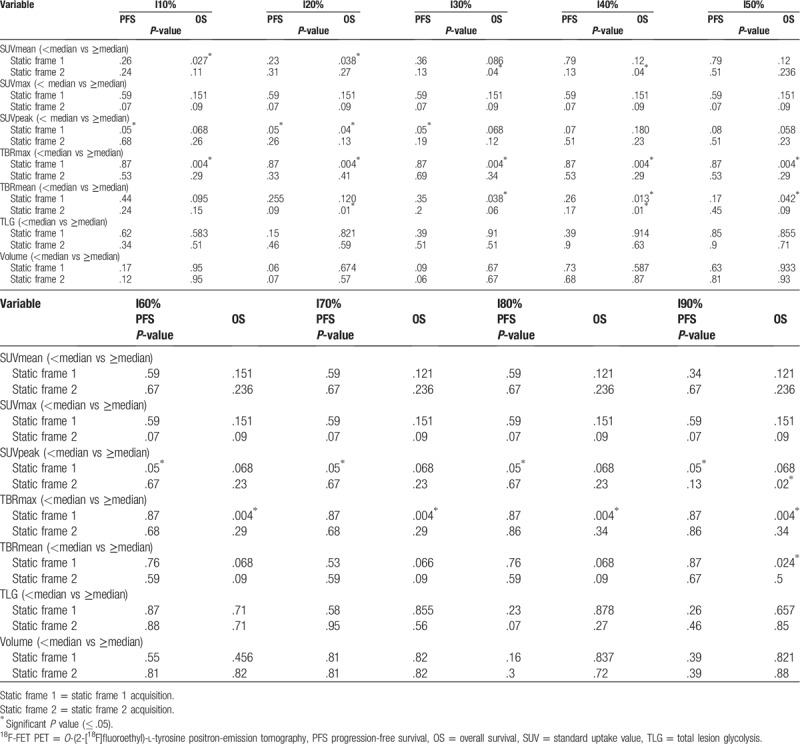
3.2.1. Static frame 1 analysis of 18F-FET tracer uptake in univariate analysis
According to the OS: OS were significantly different between the 2 groups dichotomized according to the median of SUVmean with I10 isocontour (median 1.98): mean ± standard deviation [SD] 21.5 ± 2.4 m (95% confidence interval [CI] 14–26) vs 14 ± 2.1 m (95% CI 10–18) (P = .027) and I20 isocontour (median 2.2): mean ± SD 21.5 ± 2.4 (95% CI 16.7–26.3) vs 14.4 ± 2 (95% CI 10.5–18.4) (P = .04).
The OS were significantly different between the 2 groups dichotomized according to the median of SUVpeak with I20 isocontour (median 4.19): mean ± SD 20.5 ± 2.3 m (95% CI 15.9–25.13) vs 14 ± 1.9 (95% CI 10.6–18.2) (P = .04).
The OS were significantly different between the 2 groups dichotomized according to the median of TBRmax (median 5.03): mean ± SD 22.4 ± 1.79 (95% CI 19.0–25.8) vs 10.7 ± 1.3 (95% CI 8.1–13.3) (P = .004) as illustrated in Figure 3.
Figure 3.
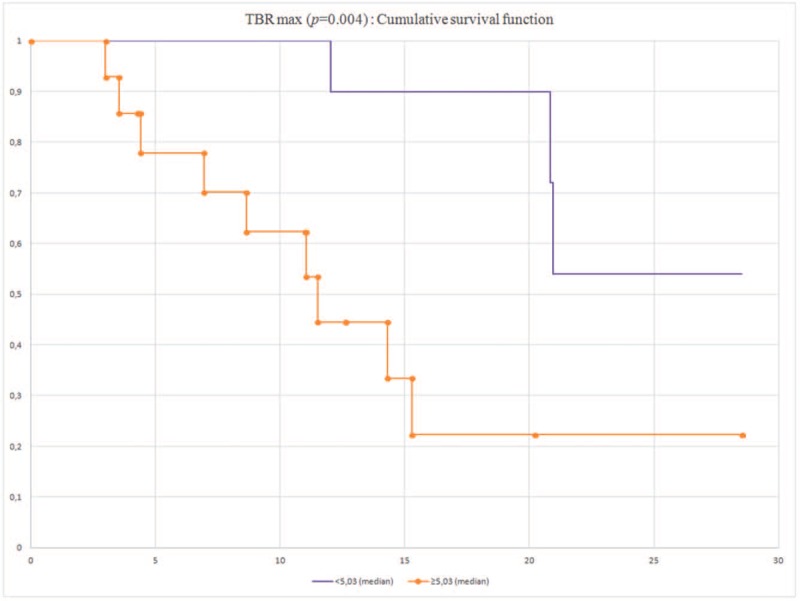
Cumulative overall survival according to TBRmax.
The OS were significantly different between the 2 groups dichotomized according to the median of TBRmean with I30 (median 2.26): mean ± SD 19.1 ± 1.4 (95% CI 16.4–21.7) vs 13.2 ± 1.9 (95% CI 9.3–17) (P = .0038), with I40 (median 2.66): mean ± SD 19.8 ± 1.3 (95% CI 17.3–22.4) vs 12.9 ± 1.8 (95% CI 9.3–16.5) (P = .013), with I50 (median 3.04): mean ± SD 19.1 ± 1.4 (95% CI 16.4–21.8) vs 13.3 ± 1.9 (95% CI 9.4–17.1) (P = .042), with I90 (median 4.67): mean ± SD 19.9 ± 1.4 (95% CI 17.7–22.2) vs 13.8 ± 2.4 (95% CI 9.1–18.6) (P = .02).
According to the PFS: PFSs were significantly different between the 2 groups dichotomized according to the median of SUV peak with I10, I20, I30, I60, I70, I80, I90 (median 4.21): mean ± SD 13.3 ± 2.5 (95% CI 8.5–18.1) vs 8.1 ± 1.5 (95% CI 5.3–11.1) (P = .05).
3.2.2. Static frame 2 of 18F-FET tracer uptake in univariate analysis
According to the OS: OS were significantly different between the 2 groups dichotomized according to the median of SUV mean with I30 (median 2.24): mean ± SD 21.5 ± 2.4 (95% CI 16.8–26.1) vs 14 ± 1.9 (95% CI 10.2–17.9) (P = .04), with I40 (median 2.57): mean ± SD 21.5 ± 2.3 (95% CI 16.8–26.1) vs 14 ± 1.9 (95% CI 10.2–17.9) (P = .04).
The OS were significantly different between the 2 groups dichotomized according to the median of TBR mean with I20 (median 1.93): mean ± SD 19.9 ± 1.2 (95% CI 17.4–22.3) vs 13 ± 1.8 (95% CI 9.5–16.6) (P = .01), with I40 (median 2.75): mean ± SD 20.1 ± 0.9 (95% CI 18.1–22) vs 11 ± 1.3 (95% CI 8.5–13.6) (P = .01) (Fig. 4)
Figure 4.
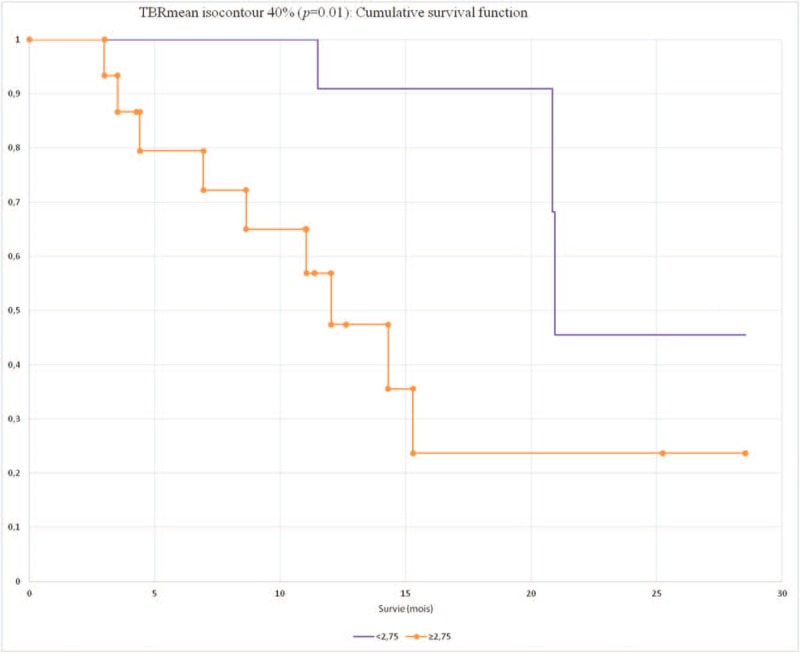
Cumulative overall survival according to TBRmean.
The OS were significantly different between the 2 groups dichotomized according to the median of SUVpeak with I90 (median 3.44): mean ± SD 21.28 ± 2.4 (95% CI 16.5–26) vs 14.2 ± 1.9 (95% CI 10.3–18) (P = .02)
The other parameters were not significant.
According to the PFS, no parameters were significant.
3.2.3. Multivariate survival analysis
Only clinical and 18F-FET PET significant parameters according to the univariate analysis were tested in multivariate analysis. Moreover, we selected I20 because it appeared the best isocontour in univariate analysis (Table 4).
Table 4.
Multivariate analysis for OS.
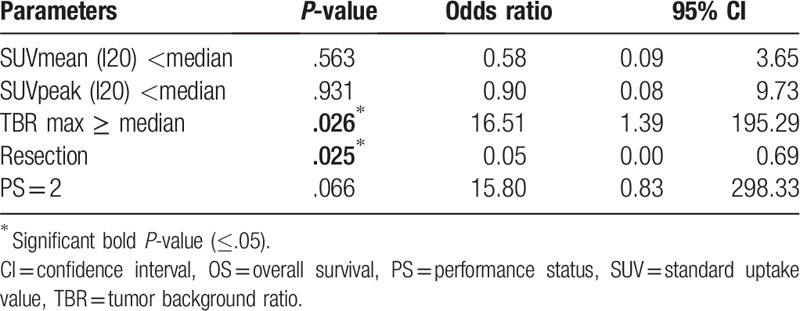
A TBRmax higher than median and surgery rather biopsy was associated with longer OS. The other parameters were not significant. We did not practice multivariate analysis on PFS because only SUV peak was significant.
4. Discussion
This current prospective study confirms that 18F-FET PET/CT is a noninvasive read-out for prognostication in patients with newly diagnosed HGG according to the current WHO 2016 classification for CNS tumors. Thanks to the new WHO 2016 classification, we already know that clinical factors, immunohistochemistry analysis, and molecular parameters are good prognostic factors.
As described in the literature, good PS and GBM resection identified the subgroup of patients with the best OS. However, the age was not correlated with OS or PFS. We noticed in the subgroup with an age <50 years old (n = 6) that population had unfavorable characteristics like PS = 2 (1/6), biopsy (2/6), incomplete resection (1/6), and incomplete treatment (3/6). It could explain why this subgroup had not better prognosis. MGMT promoter methylation (N = 16) was significantly associated with longer PFS but not with OS. This result could be linked to patients who did not benefit from adjuvant treatment by TMZ (5/16). In Kertels trial, age and MGMT status were correlated with outcome. Nevertheless, grade II gliomas were included unlike our study. Moreover repartition of population according age is unknown and more MGMT methylated patients were included.[24] We could not test IDH status due to only 2 patients with mutation (7%). However, this percentage is representative of GBM repartition according WHO 2016 classification (90% of GBMs are IDH wild type).[4]
According to univariate analysis, we showed that SUVmean, SUVpeak, TBRmax, and TBRmean were correlated with better OS. In static 1 analysis, TBRmax seemed to be the best OS prognostic parameter with P = .004 confirming findings of previous studies.[18,25] In static 2 analysis, TBRmean appeared to be the best parameter (TBRmean with I20 [P = .01] and with I40 [P = .01]). To our knowledge, our study is the 1st one which analyzed SUV, TBR, volume, and TLG on early acquisition to evaluate various prognostic factors for 2 frames. For PFS, only SUVpeak in static acquisition was significant (P = .005) for main isocontours. Our population was not large enough to discriminate 1 isocontour better than the others. In OS analysis, I20 seemed to be slightly better with 3 significant different parameters while in PFS analysis none showed at least 2 significant parameters. In literature, the calculation of SUV and TBR was based on 1 single isocontour.[26–29] This is the 1st study to our knowledge assessing every isocontour trying to discover which one was the best to determine the most efficient SUV and/or TBR.
Many little studies tried to demonstrate the prognostic interest of 18F-FET in HGG. Hutterer et al showed that 18F-FET seemed to be predictive for treatment failure[30] (N = 11). Galldiks et al demonstrated also that standard and kinetic imaging parameters seemed to predict Bevacizumab treatment failure[31] (N = 10). Nevertheless, it is interesting to have as soon as possible a maximum of prognostic data in particular with amino acid PET/CT. Most of studies about 18F-FET in gliomas analyzed the tumor grading, or tumor progression but this examination is still not an ubiquitously diagnostic method, or follow-up imaging of brain tumors. Therefore, there is few data about prognostic value of 18F-FET PET/CT.
The results of our study are in the line with observations of several studies that evaluated the role of amino acid PET using 18F-FET to find prognostic factors of newly diagnosed HGG. Kertels et al showed in his small retrospective study with 35 newly diagnosed WHO 2016 grades II and III that negative 18F-FET PET/CT inferred significantly better outcome in terms of PFS and trended toward longer OS.[24] Gempt et al showed predictive value of tracer uptake regarding survival but they did not find significant cut-off value of TBR within the group of HGG.[32]
However, the following limitations need to be considered: firstly, it was a monocentric study with a small cohort (N = 29). Secondly, delay between histologic assessment and 18F-FET PET/CT was a quietly heterogenous (median 34 days; range 12–60 days). Nevertheless, the population is quietly homogeneous (27/29 IDH wild-type patients) according to the WHO 2016 classification. Thirdly, 18F-FET PET parameters were analyzed by a single reader.
5. Conclusion
Our data suggested that 18F-FET PET/CT is a useful noninvasive tool for prognosis. TBRmax, parameter which is independent from isocontouring and operator, seems to be the most significant OS independent prognostic factor for newly HGG. Future multicenter trials are needed to validate our preliminary data. It would be pertinent to elucidate whether PET parameters are also associated with histo-molecular factors of GBMs.
Author contributions
PY Salaun participated to the study design and to the correctionof the manuscript.
Pierre-Yves Salaun orcid: 0000-0002-3899-2135.
Footnotes
Abbreviations: CNS = central nervous system, CT = computed tomography, CTV = clinical tumor volume, EANM = European Association of Nuclear Medicine, EANO = European Association of Neuro-Oncology, EORTC = European Organisation for Research and Treatment for Cancer, 18F-FET PET/CT = O-(2-[18F]fluoroethyl)-l-tyrosine positron-emission tomography/computed tomography, FLAIR = fluid attenuation inversion recovery, GBM = glioblastoma, GTV = gross tumor volume, HGG = high-grade glioma, IDH = isocitrate dehydrogenase, K2 = permeability estimation map, MGMT = O-6-methylguanine-DNA methyltransferase, MRI = magnetic resonance imaging, MTV = metabolic tumor volume, OS = overall survival, PCV = procarbazine lomustine vincristine, PFS = progression-free survival, PS = performance status, PTV = planning target volume, RANO = response assessment in neuro-oncology, RCx = radiochemotherapy, RT = radiotherapy, SUV = standard uptake value, TBR = tumor background ratio, TLG = total lesion glycolysis, TMZ = temozolomide, VOI = volume of interest, WHO = World Health Organization.
How to cite this article: Dissaux G, Basse V, Schick U, EL Kabbaj O, Auberger B, Magro E, Kassoul A, Abgral R, Salaun PY, Bourhis D, Querellou S. Prognostic value of 18F-FET PET/CT in newly diagnosed WHO 2016 high-grade glioma. Medicine. 2020;99:5(e19017).
GD and VB contributed equally to the work.
The authors have no funding and conflicts of interest to disclose.
References
- [1].Ostrom QT, Gittleman H, Truitt G, et al. CBTRUS statistical report: primary brain and other central nervous system tumors diagnosed in the United States in 2011-2015. Neuro Oncol 2018;20:iv1–86. [DOI] [PMC free article] [PubMed] [Google Scholar]
- [2].Stupp R, Hegi ME, Mason WP, et al. Effects of radiotherapy with concomitant and adjuvant temozolomide versus radiotherapy alone on survival in glioblastoma in a randomised phase III study: 5-year analysis of the EORTC-NCIC trial. Lancet Oncol 2009;10:459–66. [DOI] [PubMed] [Google Scholar]
- [3].Weller M, van den Bent M, Hopkins K, et al. EANO guideline for the diagnosis and treatment of anaplastic gliomas and glioblastoma. Lancet Oncol 2014;15:e395–403. [DOI] [PubMed] [Google Scholar]
- [4].Louis DN, Perry A, Reifenberger G, et al. The 2016 World Health Organization classification of tumors of the central nervous system: a summary. Acta Neuropathol 2016;131:803–20. [DOI] [PubMed] [Google Scholar]
- [5].Mandel JJ, Cachia D, Liu D, et al. Impact of IDH1 mutation status on outcome in clinical trials for recurrent glioblastoma. J Neuro Oncol 2016;129:147–54. [DOI] [PMC free article] [PubMed] [Google Scholar]
- [6].Pope WB, Sayre J, Perlina A, et al. MR imaging correlates of survival in patients with high-grade gliomas. AJNR Am J Neuroradiol 2005;26:2466–74. [PMC free article] [PubMed] [Google Scholar]
- [7].Chaichana KL, Kosztowski T, Niranjan A, et al. Prognostic significance of contrast-enhancing anaplastic astrocytomas in adults. J Neurosurg 2010;113:286–92. [DOI] [PubMed] [Google Scholar]
- [8].Wallner KE, Galicich JH, Krol G, et al. Patterns of failure following treatment for glioblastoma multiforme and anaplastic astrocytoma. Int J Radiat Oncol Biol Phys 1989;16:1405–9. [DOI] [PubMed] [Google Scholar]
- [9].la Fougere C, Suchorska B, Bartenstein P, et al. Molecular imaging of gliomas with PET: opportunities and limitations. Neuro Oncol 2011;13:806–19. [DOI] [PMC free article] [PubMed] [Google Scholar]
- [10].Chen W. Clinical applications of PET in brain tumors. Soc Nucl Med 2007;48:1468–81. [DOI] [PubMed] [Google Scholar]
- [11].Popperl G, Kreth FW, Herms J, et al. Analysis of 18F-FET PET for grading of recurrent gliomas: is evaluation of uptake kinetics superior to standard methods? J Nucl Med 2006;47:393–403. [PubMed] [Google Scholar]
- [12].Albert NL, Winkelmann I, Suchorska B, et al. Early static (18)F-FET-PET scans have a higher accuracy for glioma grading than the standard 20-40 min scans. Eur J Nucl Med Mol Imaging 2016;43:1105–14. [DOI] [PubMed] [Google Scholar]
- [13].Pauleit D, Floeth F, Hamacher K, et al. O-(2-[18F]fluoroethyl)-L-tyrosine PET combined with MRI improves the diagnostic assessment of cerebral gliomas. Brain 2005;128:678–87. [DOI] [PubMed] [Google Scholar]
- [14].Pauleit D, Stoffels G, Bachofner A, et al. Comparison of (18)F-FET and (18)F-FDG PET in brain tumors. Nucl Med Biol 2009;36:779–87. [DOI] [PubMed] [Google Scholar]
- [15].Plotkin M, Blechschmidt C, Auf G, et al. Comparison of F-18 FET-PET with F-18 FDG-PET for biopsy planning of non-contrast-enhancing gliomas. Eur Radiol 2010;20:2496–502. [DOI] [PubMed] [Google Scholar]
- [16].Jager PL, Vaalburg W, Pruim J, et al. Radiolabeled amino acids: basic aspects and clinical applications in oncology. J Nucl Soc Nucl Med 2001;42:432–45. [PubMed] [Google Scholar]
- [17].Floeth FW, Pauleit D, Wittsack HJ, et al. Multimodal metabolic imaging of cerebral gliomas: positron emission tomography with [18F]fluoroethyl-L-tyrosine and magnetic resonance spectroscopy. J Neurosurg 2005;102:318–27. [DOI] [PubMed] [Google Scholar]
- [18].Suchorska B, Jansen NL, Linn J, et al. Biological tumor volume in 18FET-PET before radiochemotherapy correlates with survival in GBM. Neurology 2015;84:710–9. [DOI] [PubMed] [Google Scholar]
- [19].Jansen NL, Suchorska B, Wenter V, et al. Prognostic significance of dynamic 18F-FET PET in newly diagnosed astrocytic high-grade glioma. J Nucl Med 2015;56:9–15. [DOI] [PubMed] [Google Scholar]
- [20].Stupp R, Mason WP, van den Bent MJ, et al. Radiotherapy plus concomitant and adjuvant temozolomide for glioblastoma. N Engl J Med 2005;352:987–96. [DOI] [PubMed] [Google Scholar]
- [21].Law I, Albert NL, Arbizu J, et al. Joint EANM/EANO/RANO practice guidelines/SNMMI procedure standards for imaging of gliomas using PET with radiolabelled amino acids and [(18)F]FDG: version 1.0. Eur J Nucl Med Mol Imaging 2019;46:540–57. [DOI] [PMC free article] [PubMed] [Google Scholar]
- [22].Unterrainer M, Vettermann F, Brendel M, et al. Towards standardization of (18)F-FET PET imaging: do we need a consistent method of background activity assessment? EJNMMI Res 2017;7:48. [DOI] [PMC free article] [PubMed] [Google Scholar]
- [23].Brandner S, von Deimling A. Diagnostic, prognostic and predictive relevance of molecular markers in gliomas. Neuropathol Appl Neurobiol 2015;41:694–720. [DOI] [PubMed] [Google Scholar]
- [24].Kertels O, Kessler AF, Mihovilovic MI, et al. Prognostic value of O-(2-[(18)F]fluoroethyl)-L-tyrosine PET/CT in newly diagnosed WHO 2016 grade II and III glioma. Mol Imaging Biol 2019;21:1174–81. [DOI] [PubMed] [Google Scholar]
- [25].Suchorska B, Unterrainer M, Biczok A, et al. (18)F-FET-PET as a biomarker for therapy response in non-contrast enhancing glioma following chemotherapy. J Neuro Oncol 2018;139:721–30. [DOI] [PubMed] [Google Scholar]
- [26].Ceccon G, Lohmann P, Stoffels G, et al. Dynamic O-(2-18F-fluoroethyl)-L-tyrosine positron emission tomography differentiates brain metastasis recurrence from radiation injury after radiotherapy. Neuro Oncol 2017;19:281–8. [DOI] [PMC free article] [PubMed] [Google Scholar]
- [27].Lohmann P, Herzog H, Rota Kops E, et al. Dual-time-point O-(2-[(18)F]fluoroethyl)-L-tyrosine PET for grading of cerebral gliomas. Eur Radiol 2015;25:3017–24. [DOI] [PubMed] [Google Scholar]
- [28].Rapp M, Heinzel A, Galldiks N, et al. Diagnostic performance of 18F-FET PET in newly diagnosed cerebral lesions suggestive of glioma. J Nucl Med 2013;54:229–35. [DOI] [PubMed] [Google Scholar]
- [29].Dunet V, Pomoni A, Hottinger A, et al. Performance of 18F-FET versus 18F-FDG-PET for the diagnosis and grading of brain tumors: systematic review and meta-analysis. Neuro Oncol 2016;18:426–34. [DOI] [PMC free article] [PubMed] [Google Scholar]
- [30].Hutterer M, Nowosielski M, Putzer D, et al. O-(2-18F-fluoroethyl)-L-tyrosine PET predicts failure of antiangiogenic treatment in patients with recurrent high-grade glioma. J Nucl Med 2011;52:856–64. [DOI] [PubMed] [Google Scholar]
- [31].Galldiks N, Rapp M, Stoffels G, et al. Response assessment of bevacizumab in patients with recurrent malignant glioma using [18F]Fluoroethyl-L-tyrosine PET in comparison to MRI. Eur J Nucl Med 2013;40:22–33. [DOI] [PubMed] [Google Scholar]
- [32].Gempt J, Bette S, Ryang YM, et al. 18F-fluoro-ethyl-tyrosine positron emission tomography for grading and estimation of prognosis in patients with intracranial gliomas. Eur J Radiol 2015;84:955–62. [DOI] [PubMed] [Google Scholar]


