Abstract
Introduction:
Spinal muscular atrophy (SMA) was the second most fatal autosomal recessive hereditary disease in clinic. There had been no detailed study to characterize the prevalence of SMA carrier among people in China. So, we conducted a systematic review and meta-analysis to obtain a reliable estimation of the prevalence of SMA carrier to characterize its epidemiology for the first time.
Methods:
We systematically searched for articles in kinds of important electronic databases, including PubMed, Embase, Wanfang Database and China National Knowledge Infrastructure (CNKI) to identify all relevant literatures about carrier rates of SMA in China. The prevalence was performed by forest plot choosing random effect models. The publication bias was evaluated by means of funnel plots and Egger test. The sensitivity analysis was carried out by the method of omitting any literature at a time. Combined with the results of subgroup analysis, the source of heterogeneity was also discussed absolutely.
Results:
A total of 10 studies published between 2005 and 2016 were included in our analysis at last. The sample size ranged from 264 to 107,611 in included studies. The random effect models of meta-analysis showed that the overall carrier rate of SMA was 2.0% (95% confidence interval [CI], 1.7%–2.3%) in a heterogeneous set of studies (I2 = 64%). There was a gradual rise trend observed in the SMA carrier rate during the study period. The funnel plots and Egger test (Coef = 0.02, t = −0.45, P = .667 > .05) showed no obvious potential risk of publication bias.
Conclusion:
The overall carrying rate of SMA was high as 2.0% and may be on a slow upward trend. So it was recommended that the countries should take active and effective measures to roll out routine prenatal screening and health genetic counseling for SMA as early as possible. What is more, further studies also need to be conducted to explore the etiology and epidemic factors of SMA to better control the risk of this common birth defect.
Keywords: birth defects, meta-analysis, overall rate, prevalence, spinal muscular atrophy
1. Introduction
Spinal muscular dystrophy (SMA) was an autosomal recessive hereditary neuromuscular disease characterized by degenerative, symmetrical myasthenia and muscular atrophy with anterior spinal cord cell degeneration, which was the second most fatal autosomal recessive hereditary disease in clinical practice.[1] The expression of survival motor neuron (SMN) decreased by virtue of the homozygous deletion or tiny mutation of SMN1 gene, and the current study showed that SMN protein played an important role in the growth of neuronal axons, the formation of neuromuscular joints and the axial slurry transport of RNA.[2] The decrease of SMN protein expression leaded to the degeneration of alpha motor neurons in the anterior angle of spinal cord. SMA was exactly caused by the degeneration of anterior horn cells of the spinal cord, which leads to symmetric proximal muscle weakness and atrophy.[3] The SMN2 gene was highly homologous with the SMN1 gene that could encode some normal functional SMN protein to relieve the clinical symptoms of SMA disease.[4]
At present, the standard of clinical diagnosis of SMA was based on gene diagnosis. Of the about 96% SMA patients whose disorder was linked to chromosome 5q13, were characterized by a homozygous deletion of SMN1 exon 7, which resulted from unequal crossover or SMN1-to-SMN2 conversion events, and the other patients were most caused by point mutations in the SMN1 gene.[5] Therefore, by detecting the SMN1 gene whether existing homozygous deletion or happening point mutations affecting biological function, the population could be screened and diagnosed for SMA. Thus, through genetic counseling, prenatal diagnostic techniques were used to decrease the birth defect of SMA children in the population. The American College of Medical Genetics had recently recommended routine carrier screening for SMA disease. The American College of Obstetricians and Gynecologists also recommended all people thinking of becoming pregnant should be detected to see if they were a carrier. However, studies on the carrier rates of SMA present inconsistent results in China. The overall prevalence and geographic distribution of SMA was also very poorly described in the country even the world. There had also been no systematic pooled analysis of research articles published. Thus, we conducted a systematic review and meta-analysis to estimate the carrier rate of SMA for the first time. In this study, the significance was to incorporate the documentary evidence existed to grasp the epidemiological characteristic of SMA more accurately in China; the final aim was to strengthen the prevention and control of birth defects of SMA and further promote the screening and genetic counseling of the disease in prenatal diagnosis.
2. Methods
We conducted this meta-analysis and systematic review in accordance with the PRISMA (Preferred Reporting Items for Systematic Reviews and Meta-Analyses) 2009 checklists.[6] The systematic review and meta-analysis were conducted on the basis of an established protocol (PROSPERO 2019: CRD42019139218). No ethical approval was needed for this manuscript.
2.1. Search strategy
We searched for all available articles in four important electronic databases systematically, including PubMed, Embase, Wanfang Database and China National Knowledge Infrastructure (CNKI). Search strategy wasn’t limited by the publication year. The search process was performed by two reviewers in parallel. The retrieval strategies for PubMed and Embase databases were: ((Spinal muscular atrophy[Title/Abstract]) AND carrier[Title/Abstract]) AND (China[Affiliation] OR Chinese[Affiliation]). Free text words were applied to Wanfang Database and CNKI, which belong to Chinese databases. Search terms included “Spinal muscular atrophy” and “carrier” limited in Abstract. We also retrieved the reference lists of included articles to identify potential studies as comprehensively as possible by Google scholar. The search time was updated in June 2018.
2.2. Inclusion and exclusion criteria
The studies were included in the analysis if they met the following criteria:
One diagnostic or screening technique was used at least; the study provided epidemiological indicators such as the number of carrier that the prevalence could be calculated; the research was mainly carried out in China; the results of published articles were written in English or Chinese; and the literature was a baseline data for cross-sectional surveys or a longitudinal study.
The studies were excluded based on the following criteria:
Exactly the same literature, or the subjects and data in the literature, had been published by other similar research institutes; academic lectures; reviews or interviews; sample size of literature survey was less than 200 cases; obviously irrelevant to SMA; study of non-cross-sectional surveys or sample population wasn’t with good representative; quality evaluation of literature was confirmed bad.
2.3. Data extraction
Based on the above inclusion and exclusion criteria, literature screening and data extraction were independently completed and cross-checked by 2 researchers. When happening to the disagreement in the event, it would be handed over to a third researcher for adjudication. The specific methods were as follows: First, reading the topic and abstract for the initial sieve, and further screening the literature that may conform to the standard. Second, the Excel table was used to extract and record the research data, including: first author, publication time, province, sample number, design type, carrier, diagnostic criteria and other indicators. When the information for analysis was missing from the original studies, the corresponding author would be contacted by emails once a week. If the author didn’t reply to us after sending the second email, the study was excluded from the related analysis. The outcome of interest was the carrier rate of SMA in different settings.
2.4. Quality assessment
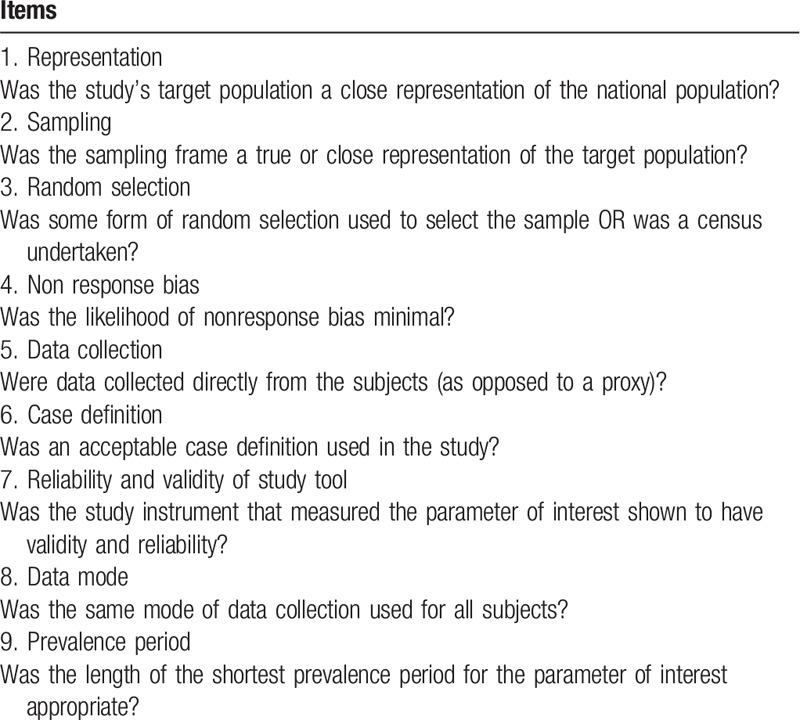
The quality of each included study was assessed using the quality assessment criteria checklist with nine items adapted from an assessment tool for prevalence studies (supporting as Table 1), which was originally developed by Damian Hoy et al from Leboeuf-Yde and Lauritsen tool.[7] Each item was assessed as low or high risk of quality according to the criteria. For each item, if the article met the criteria, it was defined as low risk and one point was scored, otherwise it was defined as high risk and zero point was scored. The point for each item added up to a total score. Articles were defined as high quality with total score being at least seven points; total score of four to six points or zero to three points was defined as medium quality or low quality, respectively.
Table 1.
Risk of bias assessment tool.
2.5. Statistical analysis
The meta-analysis was conducted for the pooled estimates. We carried out meta-analyses using RStudio Version 1.1.456 to achieve the progress. The random effect model and Q test based on the Chi-square test was adopted to evaluated the heterogeneity between the studies.[8] What is more, percentages of around 25% (I2 = 25), 50% (I2 = 50), and 75% (I2 = 75) would mean low, medium, and high heterogeneity, respectively.[9] Sensitivity analysis was carried out by omitting each study at a time, and the results of meta-analysis combined effect test were shown and calculated by forest plot, including the 95% confidence interval (95% CI). At the same time, funnel plot and Egger test regression were used to evaluated the publication bias,[10] which was statistically significant when P < .05.
The subgroup analysis was conducted based on predefined variables such as diagnostic methods to explore possible sources of heterogeneity among different studies, and the geographic regions was divided according to the authoritative province level in China. The graph of risk of quality assessment was conducted with Review Manager Version 5.2. The time-year point diagram of SMA carrier in Chinese different regions was drawn through ggplot2 functions in R language.
3. Results
3.1. General information about included studies
The 185-research literature were founded based on the efficient search strategy established. Through Endnote X7 program and initial browsing to find and remove duplicate literature, reading the full text of the remaining literature and eventually 10 studies were included that met the inclusion criteria (as Fig. 1). The inclusion studies were published from 2005 to 2016, with sample sizes ranging from 264 to 107611 cases. Two of these studies were outside mainland China, belonging to Hong Kong and Taiwan region of China. All the studies covered 7 provinces, municipalities or autonomous regions in China, and the corresponding geographical regions to which they belong were also listed (as Table 2). The time-year point diagram of rate in Chinese different regions was shown as Figure 2.
Figure 1.
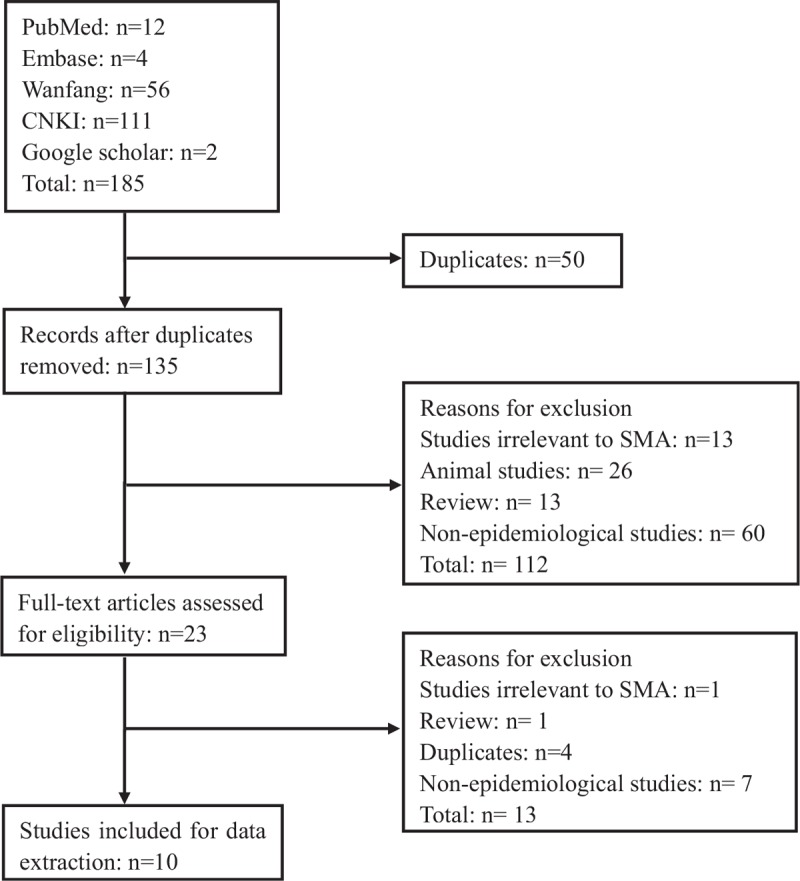
Flow chart of included/excluded studies.
Table 2.
The basic features of the studies included.
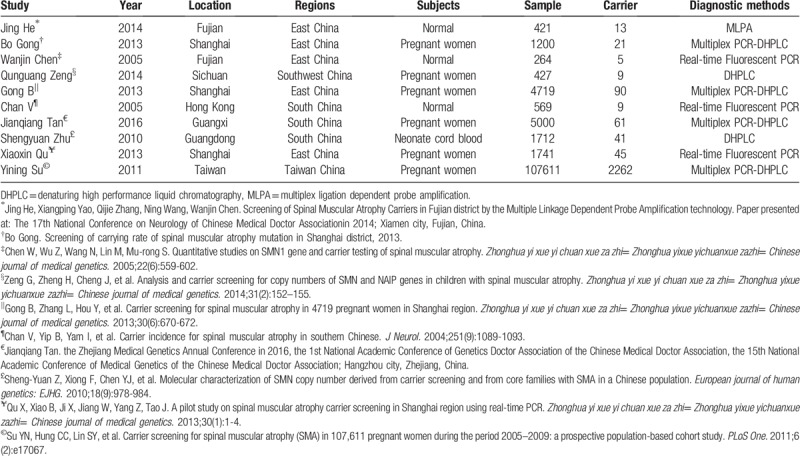
Figure 2.
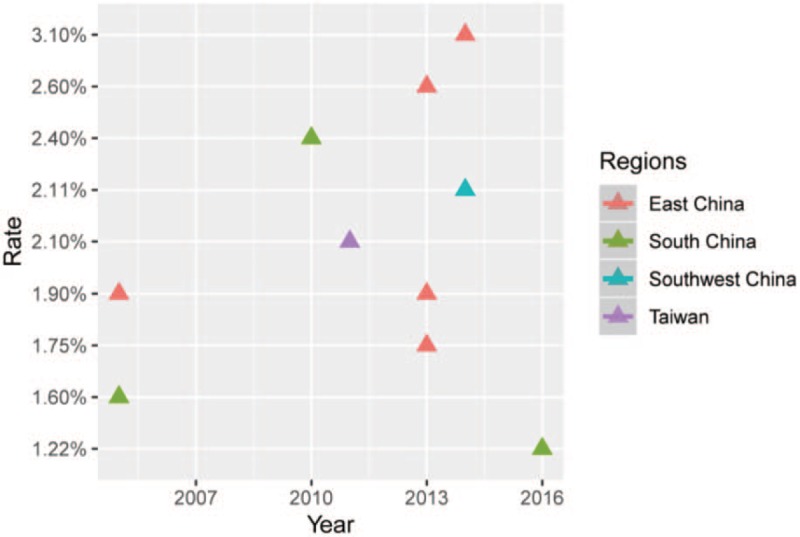
Time-year point diagram of SMA carrier in Chinese different regions; drawn through ggplot2 functions in R language.
3.2. Risk of quality assessment
The risk assessment tool showed that all studies had better quality scores and fluctuated at 5–8 points. Figure 3 summarized and showed the percentage of the included studies for each item of the assessment tool.
Figure 3.
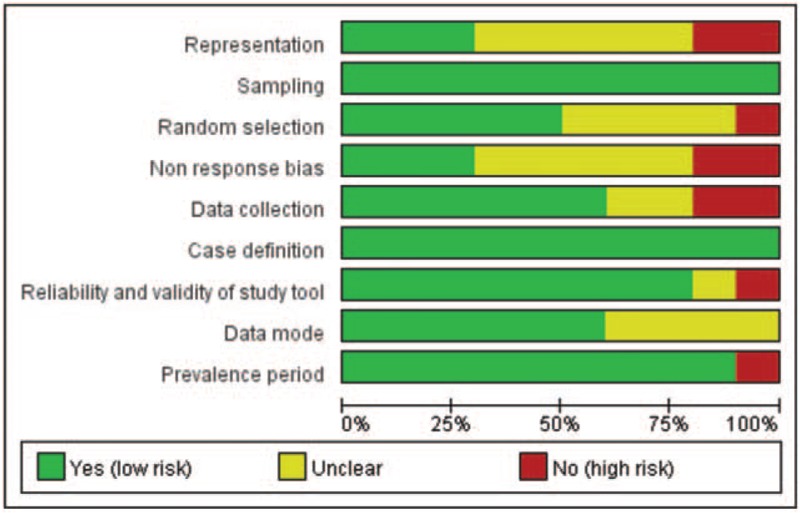
Risk of quality assessment for all included studies.
3.3. Overall prevalence and publication bias
In this meta-analysis, as Figure 4, the overall prevalence of SMA carrier was 2.0% (95% CI: 1.7%–2.3%). Considering I2 = 64% (P < .01), existing medium degree of heterogeneity, the results of random-effect model was adopted in our study. As shown in the Figure 5, the funnel plot demonstrated that the scatter points of 10 studies included showed a symmetric distribution nearly, suggesting that there was no obvious publication bias existing, and Egger test (Coef = 0.02, t = −0.45, P = .667 > .05) also showed no obvious potential risk of publication bias (as Fig. 6). The result of forest plot suggested that there was moderate heterogeneity and the source of heterogeneity need to be further explored.
Figure 4.
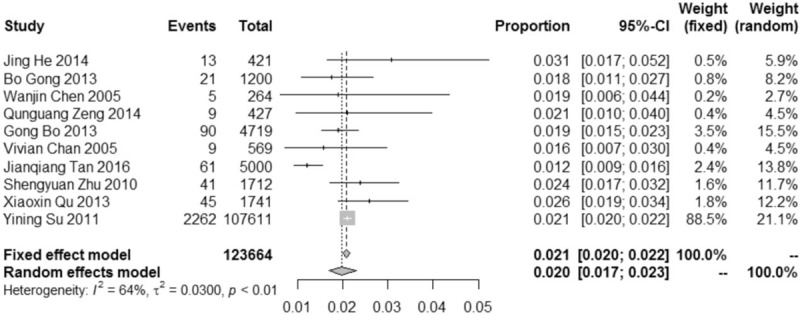
Forest plot of overall prevalence of SMA carrier among people in China with corresponding 95% confidence intervals (95% CI).
Figure 5.
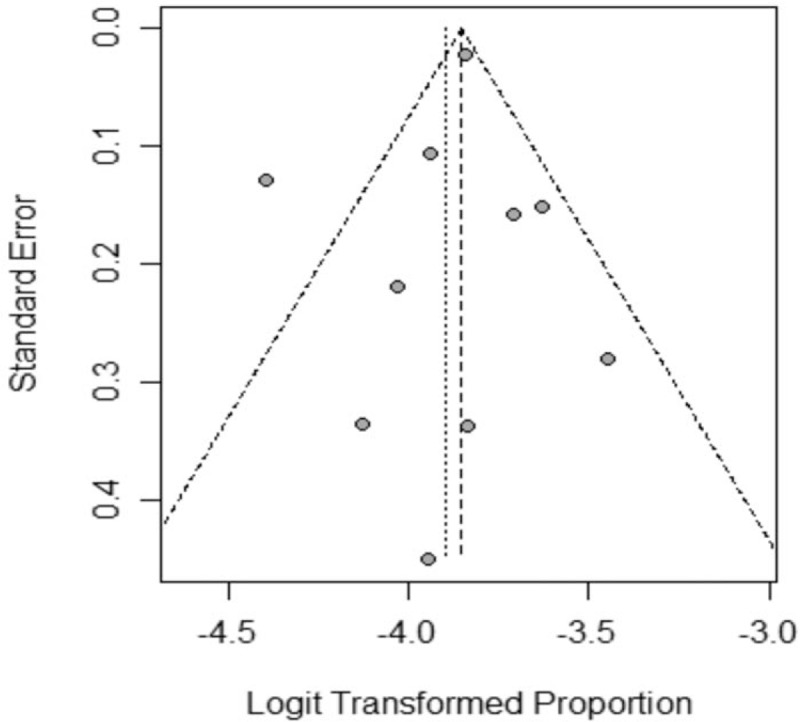
Funnel plot of the studies included in the meta-analysis.
Figure 6.
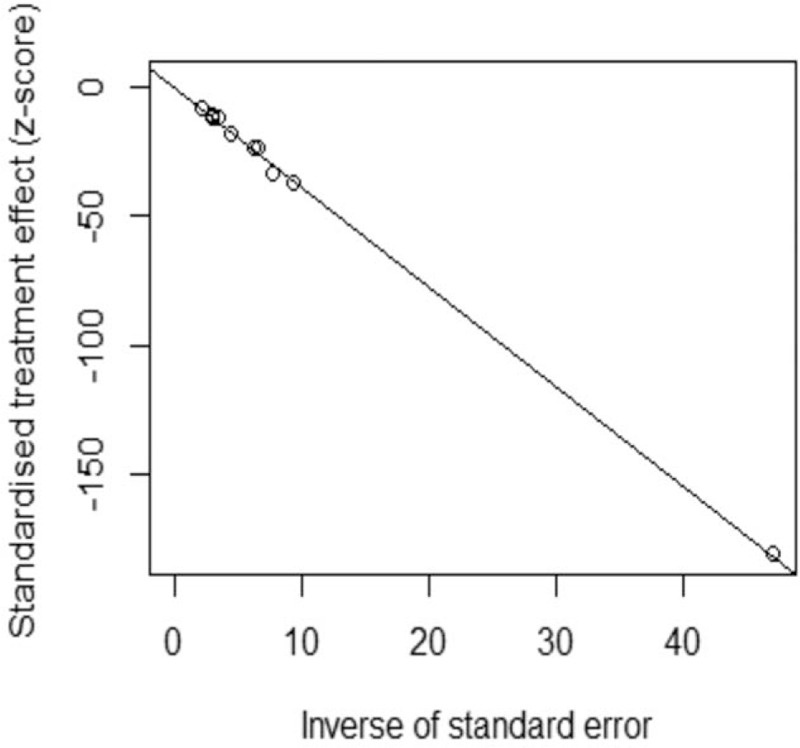
Egger's test of the studies included in the meta-analysis. (Coef = 0.02, t = -0.45, P = .667 > .05).
3.4. Subgroup and sensitivity analysis
Subgroup analysis was based on the most likely source factors of heterogeneity. These studies were divided into different subgroups by diagnostic methods. The results of subgroup analysis were summarized in Figure 7. The pooled prevalence of studies diagnosed by DHPLC method was 23 per 1000 people (2.3%, 95% CI: 1.8%–3.1%, I2 = 0%), which was almost same with the studies in the group of Real-time Fluorescent PCR method (2.3%, 95% CI: 1.8%–3.0%, I2 = 5%). The pooled prevalence of the group named Multiplex PCR-DHPLC was 17 per 1000 people (1.7%, 95% CI: 1.4%–2.2%, I2 = 84%), lower than the other methods’. There was need to explore the possible sources of heterogeneity by the right way. Sensitivity analysis was carried out by omitting each study at a time, and the results showed that the heterogeneity would be 0 after omitting the study of Jianqiang Tan 2016 (as Table 3), suggesting that the literature was the most important reason for the heterogeneity of this meta-analysis. At this point, the pooled effect value recalculated was 2.1% (95% CI: 2.0%–2.2%, I2 = 0). The literature's effect on the original results was not enough significant, which also reflected that the meta-analysis and original results were stable and the literature was no need to be eliminated.
Figure 7.
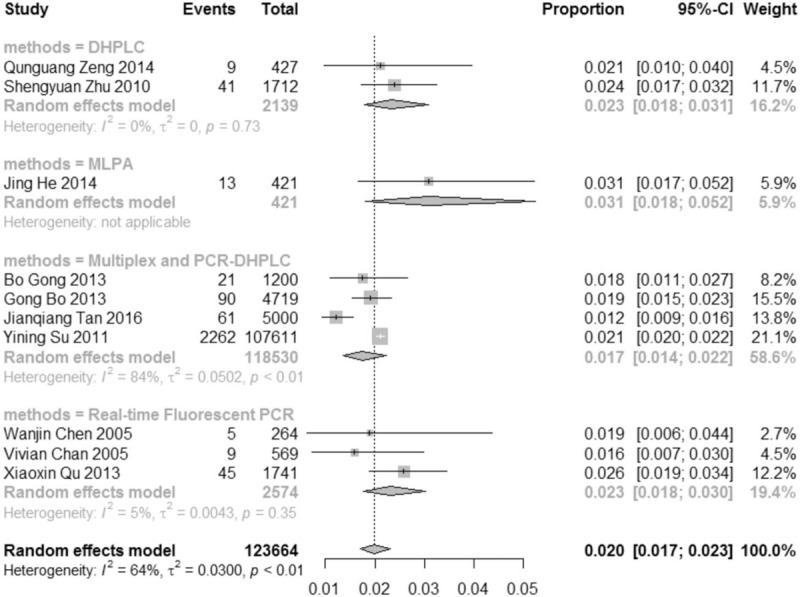
Results of carrier rate of SMA in China by subgroup analysis, based on diagnostic methods.
Table 3.
Influential analysis (Random effects model).

4. Discussion
Meta-analysis, as an analytical method in system evaluation, was a systematic and objective comprehensive summary of multiple independent research results using appropriate statistical methods on the basic of strict design.[11] Through increasing the sample quantity to improve the statistical efficiency and effect estimation, the inconsistency in the research results could be solved.[12] Under the actual situation at present, due to the complexity of implementation and data management later of large-scale epidemiology, there also being many circulation links and uncontrollable factors, the design of each study wasn’t all comprehensive in terms of gender, age, regional cultural background, economic conditions and risk factors.[12] Furthermore, there were differences in laboratory conditions and personnel levels of various research institutions. To some extent, all together, these would affect the results of individual studies as well as the final meta-analysis conclusions.
In our study, through the comprehensive and efficient system search and literature screening, a total of 10 studies were included, all which were from high-quality epidemiological survey data. The total sample amount exceeded 120,000. For the first time, meta-analysis was used to report the prevalence of SMA carrier in China as the pooled rate of 2.0% (95% CI: 1.7%–2.3%), which was closer to the results of foreign surveys 1/40–1/60.[13–15] From the view of literatures source included, the latest literature research was 2016 year, with timeliness. From the view of space, the literatures were centered on South China and east China districts, of which were exactly located on developed economic areas, reflecting that the epidemiology study of SMA was only in the preliminary stage in China. It was an urgent need to invest more financial resources and workforce to cover less developed areas in aim to obtain more comprehensive epidemiological data of SMA disease. In addition, taking into account that the use of different diagnostic method on the same population may lead to difference in prevalence, but the diagnostic technology and criteria weren’t yet uniform in China. Therefore, the relevant departments need to work together to make unified norms of epidemiological research of SMA, which also should be performed by the professionals. This would be a useful revelation for the prevention and control cause of the whole birth defects.
According to our study, in this meta-analysis, forest plot showed a moderate degree of heterogeneity in the studies included. So, we adopted the random effect model to merge the results, funnel plot and Egger test suggesting no significant publication bias. As for the heterogeneity, we adopted the subgroup analysis and omitting each study at a time to explore and solve the problem successfully. The reliability of system evaluation and meta-analysis was guaranteed. The final pooled results showed that the carrying rate of SMA population was up to 2.0%. Based on this, we recommended that all women who were ready to have children take the SMA-screening detection before pregnancy or in the early pregnancy period.[16] If a woman was a carrier, her husband would be detected, and if the couples were both carrier, they had to be offered the genetic counseling to guide fertility.[17]
However, there were some limitations in the analysis of our study. First, although the carrying rate of SMA was high, the actual incidence wasn’t really high right now. So, the SMA-screening detection wasn’t routinely carried out in China, the number of literatures meeting the inclusion criteria was limited and didn’t cover all provinces in the country. Second, the basic information of the survey subjects wasn’t recorded comprehensively, resulting that the possible influencing factors of SMA prevalence couldn’t be explored from the epidemiological perspective. Finally, also on account of no sufficient literatures, it wasn’t possible to further construct the predictive model with equation according to the time-year trend by the RStudio program.
5. Conclusions
To sum up, the SMA carrying rate of 2% of the population could no longer be neglected, both domestically and globally. Considering that the prevalence may be on a slow upward trend, the authorities should take active and effective measures to conduct routine prenatal screening and health genetic counseling as early as possible to guide people to develop healthy lifestyle behaviors and reduce the occurrence of birth defect of SMA disease eventually.
Acknowledgments
All authors have sufficiently contributed to manuscript preparation, and approve the submission of this manuscript. The authors are grateful to all colleagues of Department of Prenatal Diagnosis Center of Southern Medical University Affiliated Maternity & Child Care Hospital of Foshan for their co-operation and technical help.
Author contributions
The research idea was derived from XL Guo and CL Xia, and C Li designed the study. LH Zhang, ZT Hong and XD Zhu participated in data collection and analyzed the data. C Li wrote the paper and YF Geng revised it. All the authors helped with article review, and they had read and approved the final manuscript.
Footnotes
Abbreviations: CI = confidence interval, CNKI = China National Knowledge Infrastructure, DHPLC = denaturing high performance liquid chromatography, MLPA = multiplex ligation dependent probe amplification, PRISMA = Preferred Reporting Items for Systematic Reviews and Meta-Analyses, SMA = spinal muscular atrophy, SMN = survival motor neuron.
How to cite this article: Li C, Geng Y, Zhu X, Zhang L, Hong Z, Guo X, Xia C. The prevalence of spinal muscular atrophy carrier in China: Evidences from epidemiological surveys. Medicine. 2020;99:5(e18975).
CL and YG contributed equally to this paper.
All data generated or analyzed during this study are included in this published article (Additional file 1: PRISMA 2009 checklist.doc).
This study was funded with the operating grant No. FS0AA-KJ218-1301-0008, the genetic disease program of the sample information and resource pool, by the Science and Technology Bureau of Foshan, China.
The authors have no conflicts of interest to disclose.
References
- [1].Kissel JT, Elsheikh B, King WM, et al. SMA valiant trial: a prospective, double-blind, placebo-controlled trial of valproic acid in ambulatory adults with spinal muscular atrophy. Muscle Nerve 2014;49:187–92. [DOI] [PMC free article] [PubMed] [Google Scholar]
- [2].Fallini C, Bassell GJ, Rossoll W. Spinal muscular atrophy: the role of SMN in axonal mRNA regulation. Brain Res 2012;1462:81–92. [DOI] [PMC free article] [PubMed] [Google Scholar]
- [3].Monani UR. Spinal muscular atrophy: a deficiency in a ubiquitous protein; a motor neuron-specific disease. Neuron 2005;48:885–96. [DOI] [PubMed] [Google Scholar]
- [4].Jedrzejowska M, Milewski M, Zimowski J, et al. Phenotype modifiers of spinal muscular atrophy: the number of SMN2 gene copies, deletion in the NAIP gene and probably gender influence the course of the disease. Acta Biochim Pol 2009;56:103. [PubMed] [Google Scholar]
- [5].Wirth B. An update of the mutation spectrum of the survival motor neuron gene (SMN1) in autosomal recessive spinal muscular atrophy (SMA). Hum Mutat 2000;15:228–37. [DOI] [PubMed] [Google Scholar]
- [6].Moher D, Liberati A, Tetzlaff J, et al. Preferred reporting items for systematic reviews and meta-analyses: the PRISMA statement. Ann Int Med 2009;151:264–9. [DOI] [PubMed] [Google Scholar]
- [7].Hoy D, Brooks P, Woolf A, et al. Assessing risk of bias in prevalence studies: modification of an existing tool and evidence of interrater agreement. J Clin Epidemiol 2012;65:934–9. [DOI] [PubMed] [Google Scholar]
- [8].Souza JP, Pileggi C, Cecatti JG. Assessment of funnel plot asymmetry and publication bias in reproductive health meta-analyses: an analytic survey. Reprod Health 2007;4:3. [DOI] [PMC free article] [PubMed] [Google Scholar]
- [9].Huedo-Medina TB, Sánchez-Meca J, Marín-Martínez F, et al. Assessing heterogeneity in meta-analysis: Q statistic or I2 index? Psychol Methods 2006;11:193. [DOI] [PubMed] [Google Scholar]
- [10].Sterne JA, Gavaghan D, Egger M. Publication and related bias in meta-analysis: power of statistical tests and prevalence in the literature. J Clin Epidemiol 2000;53:1119–29. [DOI] [PubMed] [Google Scholar]
- [11].Fenton T, Fenton C. Evidence does not support the alkaline diet. Osteop Int 2016;27:2387–8. [DOI] [PubMed] [Google Scholar]
- [12].Walker E, Hernandez AV, Kattan MW. Meta-analysis: Its strengths and limitations. Cleve Clin J Med 2008;75:431. [DOI] [PubMed] [Google Scholar]
- [13].Smith M, Calabro V, Chong B, et al. Population screening and cascade testing for carriers of SMA. Eur J Hum Genet 2007;15:759. [DOI] [PubMed] [Google Scholar]
- [14].Ogino S, Wilson RB, Gold B. New insights on the evolution of the SMN1 and SMN2 region: simulation and meta-analysis for allele and haplotype frequency calculations. Eur J Hum Genet 2004;12:1015–23. [DOI] [PubMed] [Google Scholar]
- [15].Cusin V, Clermont O, Gerard B, et al. Prevalence of SMN1 deletion and duplication in carrier and normal populations: implication for genetic counselling. J Med Genet 2003;40:e39–139. [DOI] [PMC free article] [PubMed] [Google Scholar]
- [16].Feng Y, Ge X, Meng L, et al. The next generation of population-based spinal muscular atrophy carrier screening: comprehensive pan-ethnic SMN1 copy-number and sequence variant analysis by massively parallel sequencing. Genet Med 2017;19:936–44. [DOI] [PubMed] [Google Scholar]
- [17].Prior TW. Carrier screening for spinal muscular atrophy. Genet Med 2008;10:840. [DOI] [PMC free article] [PubMed] [Google Scholar]


