

Abstract
To evaluate the risk of first upper gastrointestinal bleeding by computerized tomoscanning (CT) for esophageal varices patients with cirrhotic portal hypertension.
One hundred thirty two esophageal varices patients with cirrhotic portal hypertension who are also complicated with gastrointestinal bleeding were recruited as bleeding group, while another 132 patients without bleeding as non-bleeding group. The diameter of esophageal varices, number of vascular sections, and total area of blood vessels were measured by CT scanning. The sensitivity and specificity of these indicators were calculated, and Youden index was adjusted with the critical point.
The diameter of esophageal varices was 7.83 ± 2.76 mm in bleeding group, and 6.57 ± 3.42 mm in non-bleeding group. The Youden index was 0.32 with the critical point 5.55 mm. The area under the receiver operating characteristics (AUROC) was 0.72. The number of venous vessels was 4.5 ± 2 in bleeding group, whereas being 4 ± 2 in non-bleeding group. The Youden index was 0.35 with a critical point 4, and the area under the curve (AUC) was 0.68. The blood vessel area was 1.73 ± 1.15 cm2 in bleeding group, and 1.12 ± 0.89 cm2 in non-bleeding group. The Youden index was 0.48 with the critical point being 1.03 cm2, and corresponding AUC was 0.82.
Among all 3 indicators of the total area, diameter, and number of sections of the esophageal varices, the total area of esophageal varices showed more accuracy as a potential and novel indicator for bleeding prediction.
Keywords: computerized tomoscanning, esophageal varices, hepatocirrhosis, the receiver operating characteristics curve
1. Introduction
Esophageal varices bleeding (EVB) is one of the serious complications of portal hypertension in cirrhosis, typically with acute onset and high mortality. Rupture bleeding occurs in about 10% to 30% of cirrhotic varices each year.[1,2] Esophageal varices bleeding caused mortality is relatively higher than gastric varices.[3,4] Drug and endoscopic treatment, as non-surgical treatments, is the first-priority option for treating portal hypertension caused esophageal variceal bleeding.[5,6] Today, there's a predilection to determine the extent of esophageal varices using gastroscope and further assess whether bleeding exists.[7] Conventional upper endoscopy with moderate to deeper sedation is universally available throughout the western world, Europe, and most of Asia which have been considered safe and secure. It's application in the clinic may be far more popular than computerized tomoscanning (CT) scans which requires administration of multiphasic sequencing and interpretations from qualified radiologists.
The purpose of finding a non-invasive method for predicting esophageal varices bleeding is of urgent needs. Our study utilizes CT scanning to measure and analyze the diameter, number of sections, and area of esophageal varices with portal hypertension. We aimed to determine the sensitivity, specificity, and bleeding threshold of the above esophageal varice indicators, so as to predict their value in esophageal variceal hemorrhage, and evaluate whether they could serve as an early warning signal in upper gastrointestinal bleeding.
2. Materials and methods
2.1. Study subjects
Patients with cirrhosis and portal hypertension were recruited in our hospital from May 2015 to August 2018. Patients were included under the criteria of: patients diagnosed with cirrhosis and portal hypertension based on the results of clinical, biochemical, imaging, and histopathological examination; patients who had undergone gastroscopy, diagnosed as esophagogastric varices with upper gastrointestinal bleeding, and been followed up for 6 months. Exclusion criteria: patients who also had cardiovascular disease, hematologic disease, renal insufficiency, or malignant tumor; patients who had undergone shunt, devascularization, endoscopic esophageal variceal sclerosis, or ligation; patients who had used pituitary vasopressin, growth hormone releasing inhibitory hormone or propranolol within 1 week before hospitalization; patients with upper gastrointestinal bleeding caused by ulcers, gastric mucosal lesions, benign or malignant tumors of stomach; patients who showed upper gastrointestinal bleeding. The study protocol was approved by the ethics committee of the Fourth People's Hospital of Huai’an. The study was carried out in accordance with the approved guidelines.
Two hundred sixty four cases with complete clinical data, liver CT scan, together with enhanced scan were selected. Among them, the bleeding group with 132 cases (112 men and 20 women, aged 30–76 years old) were diagnosed as esophageal varices hemorrhage by clinical and digestive endoscopy, with an average age of 54 years old. There were 115 cases of hepatitis B cirrhosis, 14 cases of alcoholic cirrhosis, and 3 cases of hepatitis C cirrhosis within the bleeding group. Meanwhile, a total of 132 cases in non-bleeding group (116 men and 16 women, aged 25–79 years old) were not complicated with esophageal variceal bleeding, with an average age of 54 years old. Accordingly, the non-bleeding group included 125 cases of hepatitis B cirrhosis, 2 cases of alcoholic cirrhosis, and 5 cases of hepatitis C cirrhosis.
2.2. Inspection method
The patient had been on fasting for 6 to 12 hours before SIEMENS Spirit spiral CT scanning was performed. During the examination, the patient was placed in supine position, and parallel liver CT scan was performed first under breath. The scanning range was from 5 cm on the top of the diaphragm to the lower edge of liver and pancreas. The layer thickness was 5 mm. Afterwards, an enhanced scanning was performed: multi-phase scan of arterial phase (23–28 seconds), portal vein phase (60–65 seconds), and delayed phase (180–240 seconds), and the contrast agent was iodized alcohol (300 mg/mL). The total amount of injection was 100 mL with injection rate as 3 mL/s.
2.3. Measurement of indicators
After CT scanning of esophageal varices, measurement of the diameter of esophageal varices, number of esophageal varices, and total area of the section were implemented. The normal movement of diaphragm exerts negative pressure during inhalation, which is a factor in the onset of varicose veins from the upper part of the diaphragm hiatus.[8] Moreover, the esophageal varices caused by portal hypertension extends from lower segment to the upper. Therefore, images of the esophageal disruption area about 2 to 5 cm above the esophageal hiatus were adopted. Two experienced radiologists in diagnosing liver disease read the film through workstation image processor using double-blind method. The diameter of blood vessels, number of vascular sections in the portal vein, and cross-sectional area were measured. The area of each blood vessel was added up to obtain the total area of the blood vessel. However, shortest diameter and area in the cross-section of twisted and skewed blood vessels were measured instead. The sensitivity, specificity, and Youden value (Youden index = sensitivity + specificity – 1) of the above indicators were calculated.
2.4. Statistical methods
Statistical analysis was performed by SPSS 21.0 statistical software (IBM Corp, Armonk, NY, USA). The data between 2 groups were analyzed by t test. The difference was statistically significant with P < .05. According to the method of diagnostic test in clinical research, the sensitivity and specificity of the esophageal variceal section diameter, number of esophageal varices, and total area of the section were calculated, and the receiver operating characteristics (ROC) curve was generated accordingly. The area under the ROC curve, Youden value, and the highest critical point of the Youden index were also determined.
3. Results
3.1. CT findings
Esophageal varices CT exhibited the shape of esophageal varices, which were round, long, and earthworm-like. The shape of the esophagus was irregular, and the wall of esophagus was thickened in a circular manner. The obviously enhanced blood vessels were protruding into the lumen in a nodular fashion.
3.2. Indicators of esophageal varices
The diameter of esophageal varices was 4.6 to 10.8 mm in bleeding group, being 3 to 6 mm in 26 cases (19.7%), and 6.1 to 10.8 mm in 106 cases (80.3%) (Fig. 1). The diameter of esophageal varices in non-bleeding group was 3.1 to 9.8 mm. Sixty three cases were within 3 to 6 mm (47.7%), while the other 69 cases were 6.1 to 10 mm (52.3%) (Fig. 2).
Figure 1.

It showed that the esophageal veins in bleeding group were obviously tortuous and dilated, and were nodular and striped protruding into the lumen. The diameter of the vessels increases, with an average diameter of about 7.83 ± 2.76 mm.
Figure 2.

The average diameter of esophageal varices was 6.57 ± 3.42 mm in non-bleeding group.
The cross-sectional numbers of esophageal varices were 2 to 7 in bleeding group, 2 in 8 cases (6.1%), 3 in 28 cases (21.2%), 4 in 47 cases (35.6%), and 5 to 7 in 49 cases (37.1%) (Fig. 3). Among non-bleeding group, the cross-sectional numbers of esophageal varices were 2 to 7, 2 in 11 cases (8.3%), 3 in 68 cases (51.5%), 4 in 26 cases (19.7%), and 5 to 7 in 27 cases (20.5%) (Fig. 4).
Figure 3.

The number of esophageal varices in bleeding group was significantly increased. The esophageal varices were dilated to protrude into the lumen and the average number of vessels was 4.5 ± 2.
Figure 4.

The average number of esophageal varices in non-bleeding group was 4 ± 2.
The total cross-sectional area of esophageal varices was 0.34 to 2.93 cm2 in bleeding group, with 0.3 to 1.0 cm2 in 33 cases (25.0%), and 1.1 to 3.0 cm2 in 99 cases (75.0%) (Fig. 5). In non-bleeding group, it was 0.15 to 1.86 cm2, while 96 cases were 0.1 to 1.0 cm2 (72.7%), and 36 cases were 1.1 to 1.9 cm2 (27.3%) (Fig. 6).
Figure 5.

The esophageal varices of bleeding group were with tortuous dilatation, prominent protrusion, narrowed lumen, increased number and diameter of blood vessels, and significantly increased total area of blood vessel section. The average area of blood vessel section was 1.73 ± 1.15 cm2.
Figure 6.

The total area of the cross-section of esophageal varices in non-bleeding group was1.12 ± 0.89 cm2.
Table 1 showed the comparisons of diameter of esophageal varices, number of cross-sectional esophageal varices, and total cross-sectional area of esophageal varices between the bleeding and non-bleeding group.
Table 1.
The comparisons of diameter of esophageal varices, number of cross-sectional esophageal varices, and total cross-sectional area of esophageal varices between the bleeding and non-bleeding groups.

3.3. Sensitivity, specificity, and critical point of indicators
We generated the ROC curve, using sensitivity as ordinate, and 1-specificity as abscissa of the measured 3 indicators. We further calculated the AUC and find the cut-off value according to the Youden index. The sensitivity of esophageal vein diameter was 0.8 (106/[106 + 26]), with specificity being 0.52 (69/[63 + 69]), Youden index being 0.32, AUC 0.72 (Fig. 7), and a 5.55 mm critical point. The sensitivity of the number of vessels was 0.73 (96/[96 + 36]), with specificity being 0.6 (79/[53 + 79]), Youden index as 0.35, AUC 0.68 (Fig. 8), and critical point being 4. The sensitivity of vascular area was 0.75(99/[99 + 33]), with specificity in 0.73(96/[36 + 96]), Youden index as 0.48, AUC 0.82 (Fig. 9), and the critical point is 1.03 cm2.
Figure 7.

ROC curve of the diameter of esophageal varices. ROC = the receiver operating characteristics.
Figure 8.
ROC curve of the number of cross-sectional esophageal varices. ROC = the receiver operating characteristics.
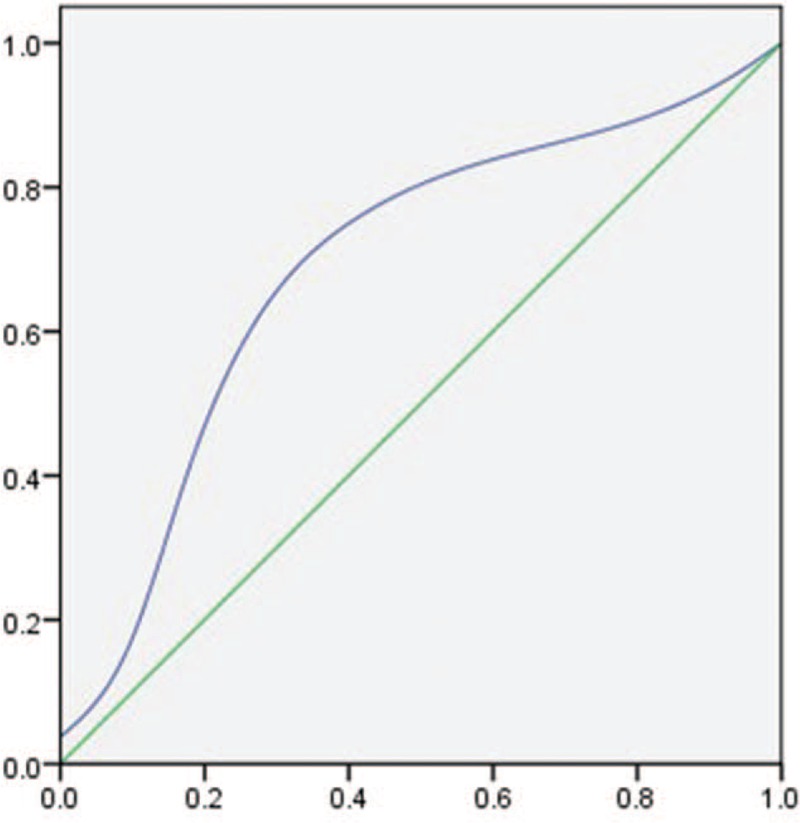
Figure 9.

ROC curve of the total cross-sectional area of esophageal varices. ROC = the receiver operating characteristics.
4. Discussion
Esophageal and gastric variceal bleeding are common complications of liver cirrhosis.[9] The mortality of primary bleeding is as high as 30% to 50%.[10] About 5% of cirrhotic patients develop esophageal varices every year, 10% to 20% of them progress from small varices to large varices 1 year later, and the risk of bleeding within 2 years is 20% to 30%.[11–13] Zoli et al[14] suggested that the incidence of severe esophageal varices in patients with cirrhosis in the second and fourth years were 21% and 45%, respectively. Therefore, early diagnosis and timely prevention of bleeding from esophagogastric varices is of paramount significance.[15,16]
Today, endoscopy continues to be the gold standard for diagnosing esophagogastric varices. However, endoscopy is hard to be accepted by patients and it might also increase the possibility of bleeding. Recently, comparing to endoscopy, the application of CT diagnosis of esophageal varices in foreign countries is increasing, it can not only identify submucosal varices, but also find varices around the esophagus. Studies have shown that multi-slice spiral CT display of esophageal varices is highly consistent with gastroscopy, and even superior to gastroscopy in exhibiting gastric varices.[17–19] CT has become an important tool for evaluating esophageal varices and its hemodynamics.[20,21]
The diameter of esophageal varices can predict potential upper gastrointestinal bleeding. There will be higher risk of bleeding with higher pressure in varices, larger diameter of esophageal varices and thinner wall. According to the American guidelines for the treatment of esophageal varices with portal hypertension, prophylactic treatment such as endoscopic ligation or non-selective B-blockers is recommended for patients with large esophageal varices (EV) (>5 mm), while prophylactic treatment is not required for patients without or with small EV.[22,23] In our study, the critical value of esophageal varices diameter was 5.5 mm, indicating that the diagnostic coincidence rate of this index with gold standard endoscopy was 90%, which was a good diagnostic index. The AUCROC of esophageal varices diameter was 0.72 mm, with sensitivity being 0.8, and specificity 0.52, indicating high specificity and low sensitivity with 80% diagnostic accuracy and 48% misdiagnosis rate.
We also predicted the upper gastrointestinal bleeding by the number of cross-sectional esophageal varices. In this study, the critical number of vessels was 4, with sensitivity being 0.73, and specificity 0.6. This indicated CT can predict 73% of hemorrhagic patients when the number of cross-sectional esophageal varices was >4, and 40% patients without bleeding may be misdiagnosed as bleeding. The number of cross-sectional esophageal varices in bleeding group was significantly larger than that in bleeding group (P < .01). The major reason was that some small vessels were dilated, or some closed vessels were reopened which enabled the CT section easier to display the blood vessels, so the number of vessel sections of bleeding group was much more than that of non-bleeding group.
We predicted the upper gastrointestinal bleeding by the cross-sectional area of esophageal varices. The threshold of the cross-sectional area of esophageal varices was 1.03 cm2. The sensitivity and specificity were 0.75 and 0.73, respectively, which indicated that the area of esophageal varices could predict accurate diagnosis of 75% of hemorrhagic patients, whereas 27% of non-hemorrhagic patients might be misdiagnosed as bleeding. Miller et al[24] proved that there was a positive correlation between the total cross-sectional area of esophageal/gastric varices and the risk of bleeding by ultrasound. Being consistent with their findings, we observed the total area of bleeding group was significantly larger than that of non-bleeding group (P < .01). Moreover, the more obvious larger area of the deviation of veins, the more serious of esophageal varices.
Our study has its limitations. It would be better to include a larger sample size with more detailed phenotypic information in future studies, such as size of varices, varying stages of liver disease, hepatic venous pressure gradient, which may portent risks with variceal bleeding.
In conclusion, our study find the diagnostic criteria for upper gastrointestinal bleeding in portal hypertension as follows: 0.82 cm2 of the total cross-sectional area of esophageal varices, 0.72 mm of the diameters of esophageal varices, and 0.68 of the cross-sectional number of esophageal varices. Collectively, the total cross-sectional area of esophageal varices can serve as an accurate and efficient predictor of first upper gastrointestinal bleeding in patients with cirrhosis and portal hypertension.
Author contributions
Data curation: Wei Xie, Fa-xiang Chen, Li-Yao Zhu.
Supervision: Xin Zhang, Cheng-Cai Wen.
Writing – original draft: Xin Zhang, Li-Yao Zhu.
Footnotes
Abbreviations: AUC = the area under the curve, AUROC = the area under the receiver operating characteristics, CT = computerized tomoscanning, EV = esophageal varices, EVB = esophageal varices bleeding, ROC = the receiver operating characteristics.
How to cite this article: Xie W, Chen Fx, Zhu LY, Wen CC, Zhang X. Risk assessment of first upper gastrointestinal bleeding using computerized tomoscanning in esophageal varices patients with cirrhosis and portal hypertension. Medicine. 2020;99:5(e18923).
WX and F-xC have contributed equally to this work.
This study was performed with individual resources.
The authors have no conflicts of interest to disclose.
References
- [1].Vorobioff JD, Groszmann RJ. Prevention of portal hypertension: from variceal development to clinical decompensation. Hepatology 2015;61:375–81. [DOI] [PMC free article] [PubMed] [Google Scholar]
- [2].Rifai G, Akras Z, Hanouneh IA. Bleeding esophageal varices: who should receive a shunt? Cleve Clin J Med 2017;84:199–201. [DOI] [PubMed] [Google Scholar]
- [3].Mehta G, Abraldes JG, Bosch J. Developments and controversies in the management of oesophageal and gastric varices. Gut 2010;59:701–5. [DOI] [PubMed] [Google Scholar]
- [4].Lee EW, Shahrouki P, Alanis L, et al. Management options for gastric variceal hemorrhage. JAMA Surg 2019;154:540–8. [DOI] [PubMed] [Google Scholar]
- [5].Abraldes JG, Villanueva C, Bañares R, et al. Hepatic venous pressure gradient and prognosis in patients with acute variceal bleeding treated with pharmacologic and endoscopic therapy. J Hepatol 2008;48:229–36. [DOI] [PubMed] [Google Scholar]
- [6].Triantos C, Kalafateli M. Endoscopic treatment of esophageal varices in patients with liver cirrhosis. World J Gastroenterol 2014;20:13015–26. [DOI] [PMC free article] [PubMed] [Google Scholar]
- [7].Chen TW, Yang ZG, Li X, et al. Evaluation of entire gastric fundic and esophageal varices secondary to posthepatitic cirrhosis: portal venography using 64-row MDCT. Abdom Imaging 2010;35:1–7. [DOI] [PubMed] [Google Scholar]
- [8].Thapa BR, Mehta S. Endoscopic sclerotherapy of esophageal varices in infants and children. J Pediatr Gastroenterol Nutr 1990;10:430–4. [DOI] [PubMed] [Google Scholar]
- [9].Garcia-Tsao G, Abraldes JG, Berzigotti A, et al. Portal hypertensive bleeding in cirrhosis: Risk stratification, diagnosis, and management: 2016 practice guidance by the American Association for the study of liver diseases. Hepatology 2017;65:310–35. [DOI] [PubMed] [Google Scholar]
- [10].Garrett KO, Reilly JJ, Jr, Schade RR, et al. Bleeding esophageal varices: treatment by sclerotherapy and liver transplantation. Surgery 1988;104:819–23. [PubMed] [Google Scholar]
- [11].North Italian Endoscopic Club for the S. and V. Treatment of Esophageal, Prediction of the first variceal hemorrhage in patients with cirrhosis of the liver and esophageal varices. A prospective multicenter study. N Engl J Med 1988;319:983–9. [DOI] [PubMed] [Google Scholar]
- [12].Merli M, Nicolini G, Angeloni S, et al. Incidence and natural history of small esophageal varices in cirrhotic patients. J Hepatol 2003;38:266–72. [DOI] [PubMed] [Google Scholar]
- [13].Groszmann RJ, Garcia-Tsao G, Bosch J, et al. Beta-blockers to prevent gastroesophageal varices in patients with cirrhosis. N Engl J Med 2005;353:2254–61. [DOI] [PubMed] [Google Scholar]
- [14].Zoli M, Merkel C, Magalotti D, et al. Natural history of cirrhotic patients with small esophageal varices: a prospective study. Am J Gastroenterol 2000;95:503–8. [DOI] [PubMed] [Google Scholar]
- [15].Chen YI, Ghali P. Prevention and management of gastroesophageal varices in cirrhosis. Int J Hepatol 2012;2012:750150. [DOI] [PMC free article] [PubMed] [Google Scholar]
- [16].Park Y, et al. A novel model to predict esophageal varices in patients with compensated cirrhosis using acoustic radiation force impulse elastography. PLoS One 2015;10:e0121009. [DOI] [PMC free article] [PubMed] [Google Scholar]
- [17].Nakayama Y, Imuta M, Funama Y, et al. CT portography by multidetector helical CT: comparison of three rendering models. Radiat Med 2002;20:273–9. [PubMed] [Google Scholar]
- [18].Perri RE, Chiorean MV, Fidler JL, et al. A prospective evaluation of computerized tomographic (CT) scanning as a screening modality for esophageal varices. Hepatology 2008;47:1587–94. [DOI] [PubMed] [Google Scholar]
- [19].Kim H, Choi D, Gwak GY, et al. Evaluation of esophageal varices on liver computed tomography: receiver operating characteristic analyses of the performance of radiologists and endoscopists. J Gastroenterol Hepatol 2009;24:1534–40. [DOI] [PubMed] [Google Scholar]
- [20].Ronot M, Calame P, Vilgrain V. Predictive value of CT for first esophageal variceal bleeding in patients with cirrhosis: score calibration and prediction. Eur J Radiol 2017;93:289. [DOI] [PubMed] [Google Scholar]
- [21].Calame P, Ronot M, Bouveresse S, et al. Predictive value of CT for first esophageal variceal bleeding in patients with cirrhosis: value of para-umbilical vein patency. Eur J Radiol 2017;87:45–52. [DOI] [PubMed] [Google Scholar]
- [22].Zardi EM, Di Matteo FM, Pacella CM, et al. Invasive and non-invasive techniques for detecting portal hypertension and predicting variceal bleeding in cirrhosis: a review. Ann Med 2014;46:8–17. [DOI] [PMC free article] [PubMed] [Google Scholar]
- [23].Lee JY, Kim TY, Jeong WK, et al. Clinically severe portal hypertension: role of multi-detector row CT features in diagnosis. Dig Dis Sci 2014;59:2333–43. [DOI] [PubMed] [Google Scholar]
- [24].Miller L, Banson FL, Bazir K, et al. Risk of esophageal variceal bleeding based on endoscopic ultrasound evaluation of the sum of esophageal variceal cross-sectional surface area. Am J Gastroenterol 2003;98:454–9. [DOI] [PubMed] [Google Scholar]