Abstract
The rational design of fluorescent nucleoside analogues is greatly hampered by the lack of a general method to predict their photophysics, a problem that is especially acute when base pairing and stacking change fluorescence. To better understand these effects, a series of tricyclic cytidine (tC and tCO) analogues ranging from electron-rich to electron-deficient was designed and synthesized. They were then incorporated into oligonucleotides, and photophysical responses to base pairing and stacking were studied. When inserted into double-stranded DNA oligonucleotides, electron-rich analogues exhibit a fluorescence turn-on effect, in contrast with the electron-deficient compounds, which show diminished fluorescence. The magnitude of these fluorescence changes is correlated with the oxidation potential of nearest neighbor nucleobases. Moreover, matched base pairing enhances fluorescence turn-on for the electron-rich compounds, and it causes a fluorescence decrease for the electron-deficient compounds. For the tCO compounds, the emergence of vibrational fine structure in the fluorescence spectra in response to base pairing and stacking was observed, offering a potential new tool for studying nucleic acid structure and dynamics. These results, supported by DFT calculations, help to rationalize fluorescence changes in the base stack and will be useful for selecting the best fluorescent nucleoside analogues for a desired application.
Keywords: biophysics, DNA, fluorescence, nucleoside analogues, photochemistry
Introduction
Fluorescent nucleoside analogues are biophysical tools that are providing unique insights into the structure and dynamics of nucleic acids. Motivated by increased recognition of the importance of nucleic acid secondary, tertiary and quaternary structure in the maintenance and expression of the genetic code, chemists have worked to plug gaps in the toolkit for fluorescent labeling of nucleic acids.[1] Recent advances in the field include Tor’s highly isomorphic RNA alphabet and a growing number of fluorescent nucleosides that have been designed for use in studying G-quadruplexes, i-motifs, and lesions.[2–8] The impact of these biophysical tools is clear and ex-emplified in a number of recent studies, such as detailed analyses of the mechanisms of riboswitch activation and the origins of toxicity of Hg∥ through the formation of kinetically stable T- Hg∥-T base pairs.[9–11] It is equally clear that serious limitations remain in the capabilities of fluorescent nucleosides. For example, existing analogues capable of Watson-Crick hydrogen bonding do not emit at wavelengths great than 525 nm and the brightest known isomorphic analogue, 6-methylisoxanthopterin (6-MI; ε340 = 14000M–1cm–1; Φem,430 = 0.88), has an eight-fold lower extinction coefficient than rhodamine B in water (ε555 = 120000M–1cm–1; Φem,576 = 0.31), limiting brightness.[12–14] Moreover, 6-MI is nearly quenched when base-stacked in duplex DNA (Φem = 0.04), as are most fluorescent nucleobase analogues.[15–18] A small subset of fluorescent nucleoside analogues retains fluorescence in the base stack, and our lab has recently reported on a cytidine analogue with the largest known fluorescence turn-on response to base stacking and pairing.[19] The limited brightness of existing fluorescent nucleoside analogues explains why they are not widely used in single-molecule fluorescence measurements, and the only existing FRET pairs between nucleobase analogues are non-emissive.[20–22] Ongoing efforts by a number of groups are focused on developing nucleoside analogues with useful fluorescence changes in response to base stacking, base pairing, changes in nucleic acid secondary and tertiary structure, as well as environmental changes associated with protein binding or changes in nucleic acid solvation.[1,5,23–31] But probably the greatest impediment to the development of new generations of fluorescent nucleoside analogues with radically improved properties is that robust methods for predicting photophysics based on structure are largely unavailable, especially when one is targeting the complex, anisotropic environment of the base stack.[3]
A number of research groups have studied the relationships between structure and fluorescence of nucleoside analogues, using a combination of empirical observations and computation. These studies have generally used substituent effects to tune the photophysical properties of modified nucleobases and characterized their fluorescence as free nucleosides, sometimes including Stern–Volmer quenching measurements with natural nucleosides.[12,13,32–35] Our group has focused on elaborating the tricyclic cytidine scaffold by the introduction of electron-donating groups (EDGs) and electron-withdrawing groups (EWGs), extending the conjugation, and studying the effects of substituent placement.[36] Recent works by Wilhelmsson and others have applied time-dependent density functional theory (TDDFT) calculations to the prediction of absorption and emission spectra of nucleobase analogues with some success.[32,34,35,37,38] But the application of computational work to rational design of novel fluorophores is mostly limited to substituent effects.[37] While there are examples of series of structurally related fluorescent nucleosides that have been studied for their photophysics as free molecules,[32–34] systematic studies of nucleobase substituent effects on fluorescence in the base stack have been rarely performed. Wilhelmsson has reported that parent tricyclic cytidines have fluorescence insensitive to neighboring bases, and neighboring base effects have been studied for 2-aminopurine quenching in duplex DNA.[39,40]
The tricyclic cytidine (tC) family of compounds was originally developed by Gilead as a part of their antisense program because these compounds’ enhanced π stacking in the duplex can stabilize secondary structure.[41] The fluorescence of the two parent compounds tC and tCO (X = O in tCO compounds and X = S in tC compounds; see Figure 1) has been studied extensively by Wilhelmsson et al., who noted that they are among the brightest known fluorescent nucleobase analogues that are not quenched in the base stack.[42] These compounds have been used in biophysical studies of enzyme mechanisms and Wilhelmsson has more recently developed a FRET pair with tCO as a donor and nitro-tC as a non-emissive quencher.[20,21] In seeking to add new properties to the fluorescent nucleoside toolkit, our lab synthesized and studied an extended family of tC compounds that collectively hint at structure-photophysics relationships[19,36] That work identified 8-Cl-tCO as the member of the tC family with the brightest fluorescence and 8-DEA-tC as the least bright nucleoside, and those results hinted at trends relating analogues’ electronics to photophysical properties such as Stokes shift.[36] Further studies in duplex DNA showed that 8-DEA-tC exhibits up to a 20-fold increase in fluorescence when it is base stacked and correctly base paired, making it the most powerful turn-on fluorescent nucleoside known.[19] Here, we report on the synthesis and properties of 8-CN-tCO, a new, most electron-deficient tCO analogue, and we assess the fluorescence responses of the family of tC(O) analogues to base stacking and pairing in double-stranded DNA within the context of a varied set of nearest neighboring bases (Figure 1; the abbreviation tC(O) is used to encompass both tC and tCO compounds). The results, supported by density functional theory (DFT) studies, show clear correlations between the electronic properties of the tC(O) analogues, the electron richness of neighboring bases, and the fluorescence responses. The observed structure-photophysics relationships hint that predicting nucleobase analogue fluorophore responses to base stacking will be possible when adequately accounting for conformational perturbation of the duplex and the electronic interactions between nearest neighbors in the base stack.
Figure 1.
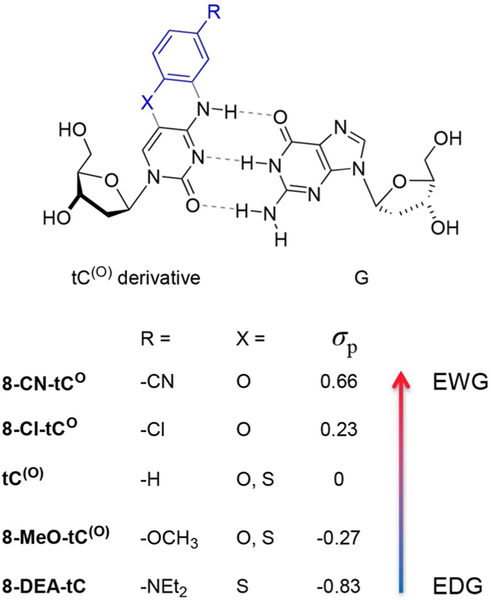
Tricyclic cytidine derivatives used in this study to probe electronic effects on photophysical properties of free nucleosides and the effects of base pairing and stacking. X = O in tCO compounds and X = S in tC compounds.
Results and Discussion
Design and Synthesis of Cytidine Analogues
The goal of identifying nucleobase analogue electronic effects on photophysics requires a range of substituents. After problematic initial attempts at late-stage functionalization of tC derivatives through metal-mediated reactions of 8-Cl-tCO, we adopted a strategy guided by the availability of suitable starting materials and their reactivity in the tC and tCO syntheses, respectively (Schemes 1 and 2). Parent compounds tC and tCO were synthesized using previously reported methods.[41,43,44] We developed synthetic methods to prepare tC(O) derivatives, some of which we have reported previously, but all are summarized here.[19,36] The amidites of 8-Cl-tCO, and 8-MeO-tC are new compounds, as is the 8-CN-tCO nucleoside and its precursors. The targeted family of compounds spanned a range of electronic richness as indicated by Hammett σp from –0.83 to 0.66, comprising the -NEt2, -OMe, -H, -Cl, and -CN groups (Figure 1). The most electron-rich members, -NEt2 and -OMe, were synthesized as tC analogues and the most electron-deficient, -Cl and -CN were synthesized as tCO analogues. We synthesized the -OMe and -H compounds using both tC and tCO frameworks to provide compound series overlap and to aid in structure-photophysics relationship identification. Past work by our lab has shown that the photophysical properties of these tC(O) analogue nucleosides are nearly independent of substituent placement.[36] For example, 7-Cl-tCO (Cl is para to N) has λmax,abs = 357 nm, λmax,em = 459 nm, ε = 6700 M–1 cm–1 and Φem = 0.35, nearly identical to 8-Cl-tCO (cf. Table 1). For that reason, and for consistency, we chose to focus on substituents at the synthetically less challenging 8 position of the tC(O) framework.
Scheme 1.

Synthesis of tC derivatives.
Scheme 2.
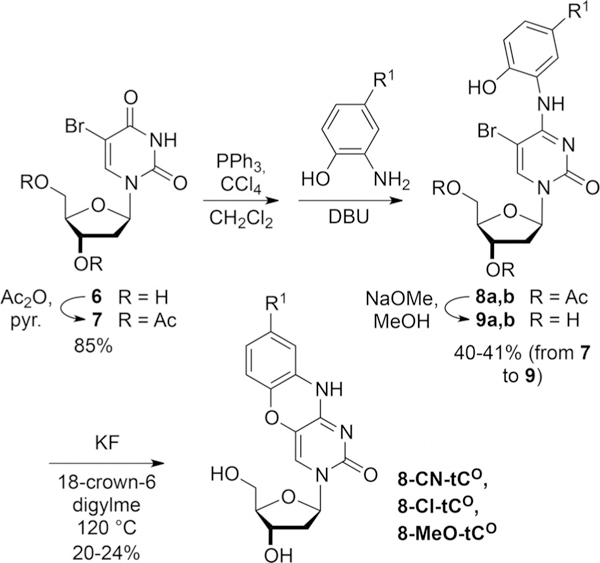
Synthesis of tCO derivatives.
Table 1.
Photophysical properties of the tC and tCO nucleosides and their derivatives.[a]
| Compound | Substituent σp | Solvent |
λmax,abs [nm] |
λmax,em [nm] |
Stokes shift [nm] |
ε at λmax.abs [M–1 cm–1] |
Φem | Brightness (ε.Φem) [M–1 cm–1] |
|---|---|---|---|---|---|---|---|---|
| 8-CN-tCO | 0.66 | 1 × PBS | 323, 355 | 429 | 106, 74 | 8000, 5100 | 0.32 | 1600 |
| 1,4-dioxane | n.d. | n.d. | n.d. | n.d. | n.d. | n.d. | ||
| 8-Cl-tCO | 0.23 | 1 × PBS | 361 | 458 | 97 | 5600 | 0.35 | 2000 |
| 1,4-dioxane | 366 | 453 | 87 | 7200 | 0.49 | 3500 | ||
| tCO | 0 | 1 × PBS | 355 | 473 | 118 | 6800 | 0.24 | 1600 |
| 1,4-dioxane | 357 | 445 | 88 | 7400 | 0.46 | 3400 | ||
| tC | 0 | 1 × PBS | 377 | 513 | 136 | 4700 | 0.09 | 400 |
| 1,4-dioxane | 369 | 472 | 103 | 4300 | 0.34 | 1500 | ||
| 8-MeO-tCO | –0.27 | 1 × PBS | 361 | 499 | 138 | 4000 | 0.05 | 200 |
| 1,4-dioxane | 360 | 474 | 114 | 4800 | 0.38 | 1800 | ||
| 8-MeO-tC | –0.27 | 1 × PBS | 379 | 550 | 171 | 3800 | 0.01 | 40 |
| 1,4-dioxane | 372 | 500 | 128 | 3800 | 0.28 | 1100 | ||
| 8-DEA-tC | –0.83 | 1 × PBS | 395 | 493 | 98 | 2700 | 0.006 | 16 |
| 1,4-dioxane | 389 | 524 | 135 | n.d. | 0.06 | n.d. | ||
Measurements performed in 1 ×PBS buffer, pH 7.4, 296 K. n.d. = not determined.
The synthesis of the tC compounds 8-DEA-tC and 8-MeO-tC was carried out starting with the corresponding 2-methylbenzothiazoles 1, which were converted to disulfides 2 by hydrazinolysis and oxidation. This oxidation was necessary because the aminothiophenols were too unstable for purification and handling. For preparation of the thioethers 3, the disulfides were reduced using triethylphosphine and then used in a one-pot reaction with bromouracil in the presence of sodium carbonate. Ring closure to complete the heterocyclic nucleobase analogues 4 was achieved by reflux under acidic conditions. Completion of the tC analogues 8-MeO-tC and 8-DEA-tC was attained by 2’-deoxyribosylation using silyl Hilbert-Johnson conditions and deprotection by methoxide.
The synthesis of the tCO analogues follows an alternative route because aminophenols fail to undergo coupling to bromouracil analogously to aminothiophenols in the synthesis of 3. Beginning with protected bromouridine 7, Appel chemistry is used in conjunction with cyano-, chloro-, and methoxyaminophenols to prepare secondary amines 8. Deprotection followed by aryl ether formation as promoted by fluoride provided 8-CN-tCO, 8-Cl-tCO, and 8-MeO-tCO
All of these tC(O) compounds were converted, using standard conditions, to 4,4’-dimethoxytrityl-protected nucleoside phosphoramidites for solid-phase oligonucleotide synthesis (details in the Supporting Information).
Photophysical Studies of tC(O) Derivative Nucleosides
With this extended tC(O) family in hand, we sought to measure photophysical properties and to check for relationships to structure. The goal was to relate the results to empirical structural parameters and DFT calculations, seeking to rationalize trends and provide predictive capabilities for future efforts at nucleoside analogue fluorophore design. These results and trends are also valuable for matching individual nucleoside analogue fluorophores to biophysical applications.
We began by performing photophysical measurements on all these members of the tC(O) family as free nucleosides in 1 × PBS buffer (pH 7.4) and 1,4-dioxane (Table 1), including the recording of absorption and emission spectra and the measurement of quantum yields of fluorescence emission, Φem. Visual inspection of the plotted absorption and emission spectra of the tC(O) compounds shows a number of readily apparent trends (Figures 2 and 3). First, all of these compounds have a low-energy excitation at λ > 350 nm in addition to much stronger absorbance at shorter wavelengths (< 300 nm; data shown in the Supporting Information). The absorption of these fluorophores at λ > 300 nm is useful for their selective excitation when they are present in nucleic acids, which absorb at shorter wavelengths. 8-CN-tCO is unique in that it has two distinct absorption bands at λ > 300 nm, the lower-energy band being a shoulder at 355 nm, which is at nearly the same λmax as the other tCO compounds. In the tCO series, considering only 8-CN-tCO’s longer wavelength absorption (its HOMO-LUMO transition; see next paragraph), λmax,abs varies little, indicating that the substituents have little effect on excitation energy. No trend is apparent in the extinction coefficients of the tCO compounds. In contrast, the absorption spectra of the tC compounds show a different trend. Extinction coefficients ε show a strongly correlated decreasing trend with more electron-donating substituents (Figure S1), but patterns in λmax,abs are not apparent.
Figure 2.
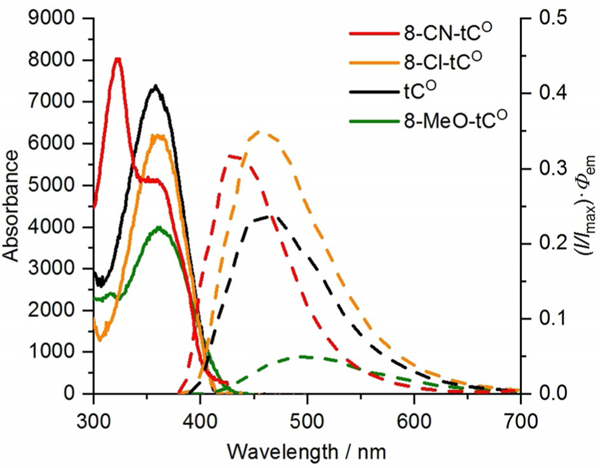
Absorption (solid lines) and corrected emission (dashed lines; normalized at λmax to Φem) spectra of tCO derivatives in 1 × PBS buffer (pH 7.4) recorded at 296 K.
Figure 3.
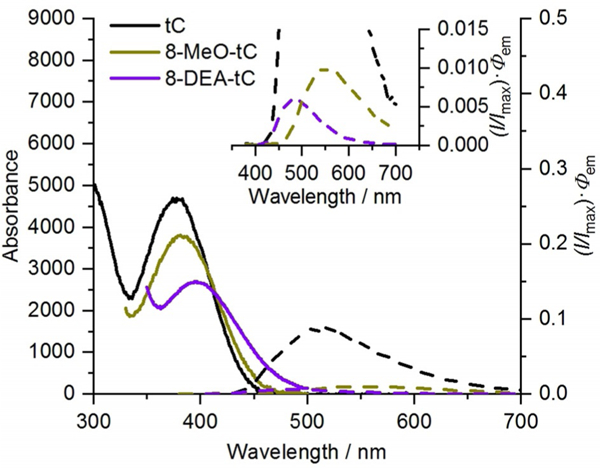
Absorption (solid lines) and corrected emission (dashed lines and inset; normalized at λmax to Φem) spectra of tC derivatives in 1 × PBS buffer (pH 7.4) recorded at 296 K.
To better understand the electronic transitions and transition probabilities associated with absorption and emission spectra, we performed DFT and TDDFT calculations on free nucleobases and short, trimer oligonucleotides (single-and double-stranded with the B conformation; for details, see Supporting Information). Briefly, a small series of benchmark calculations was carried out on parent tCO using every combination of B3LYP,[45,46] BH&HLYP,[46,47] PBE0,[48] and M06[49] methods with SVP,[50] TZVP,[51] cc-pVDZ,[52] and pc-2[53] basis sets. The best agreement with experimental excitation and emission spectra was found for B3LYP-D2/cc-pVDZ and this methodology was applied to the remaining calculations described in this paper. For free nucleobases, solvation was modeled by optimizing the geometry with explicit water molecules hydrogen-bonding to the carbonyl oxygen and to the S or O atom at the center of the tricyclic system, and then applying the IEFPCM continuum solvation model[54] to the entire system. Computational modeling of the >350 nm transitions described in the preceding paragraph indicates that they arise from π to π* transitions between orbitals highly delocalized across the aryl system. Our calculations ascribe the 8-CN-tCO band at 323 nm to a HOMO–LUMO+1 transition, still predominantly π to π* in character, but some-what stronger than the HOMO–LUMO transition. This observation is consistent with a predicted trend towards increasing HOMO–LUMO+1 transition strength with increasing electron-withdrawing character of the substituent.
A plot of the Stokes shifts of the tC and tCO compounds in 1 × PBS buffer (pH 7.4) against Hammett σp values shows a clear correlation in the tCO series, but the values for the tC compounds are scattered (Figure 4). Because wavelength is reciprocally dependent on energy, we plotted the absorption and emission energies of each of these nucleoside analogues at λmax,abs and λmax,em in electron volts against the Hammett σp values (Figure S2). Stokes shift decreases with increasingly electron-withdrawing substituents on tCO, and this trend derives from the substituents’ stronger influence on emission energy as compared with absorption energy. The more electron-deficient compounds emit at higher energy. The strong correlation between absorption and emission energies of the tCO compounds and σp indicates that the inductive and resonance effects of the substituents are the major determinants of changes in Stokes shift.
Figure 4.
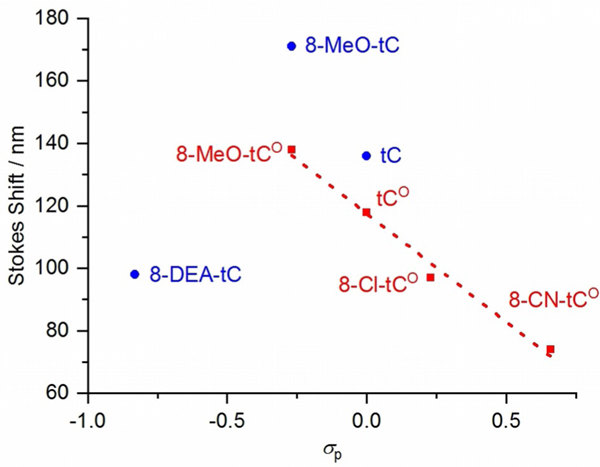
Linear correlation of Stokes shift to Hammett σp for tCO compounds (red) and plot for tC compounds (blue).
In contrast, our calculations at present only predict that λmax,abs should decrease with increasing electron-withdrawing character, for the tC and tCO species alike. This effect appears to arise from unequal shifts in the HOMO and LUMO energies as the electron density in the aryl π system changes. EWGs reduce the electron density in the π system, dropping the HOMO energy by slightly more than the LUMO energy. There is a greater density of MO energies at the higher excitation level of the LUMO, and therefore the HOMO energy tends to respond more freely to changes in electron density than the LUMO.
Trends are also apparent in the fluorescence quantum yields of the tC(O) analogues as a function of their substituents. While no clearly linear correlations were observed, it is clear that the quantum yield of fluorescence emission is greatly impacted by EDGs and EWGs (Figure 5). For both tC and tCO derivatives, EDGs are associated with attenuated Φem, whereas EWGs increase Φem with respect to the parent tC(O). 8-CN-tCO is an outlier with Φem = 0.32, a value similar to that of 8-Cl-tCO (Φem = 0.35). We wondered whether our measurements of Φem for 8- CN-tCO were underreporting the true value because the absorption at 355 nm might include a significant contribution from the HOMO–LUMO+1 band at λmax = 323 nm. Curve fitting the 8-CN-tCO absorption spectrum to two Gaussian functions using Origin 8.1 (OriginLab, Northampton, MA) shows that only around 10% of the absorbance at 355 nm is derived from the tailing end of absorption centered at 323 nm (Figure S3). The extent of overlap of the absorption centered at 323 nm is insufficient to explain why 8-CN-tCO falls from the trend line of the other tCO derivatives. One possible explanation is that 8-CN-tCO may be more prone to quenching by excited-state proton transfer because the cyano group increases this compound’s acidity. We measured the acidity of 8-CN-tCO by recording the pH dependence of its Φem and obtained an inflection point indicative of pKa = 10.3 (see Supporting Information). We performed TDDFT calculations to try to rationalize 8-CN-tCO’s relatively weak fluorescence, but the origin of this intensity is not apparent from a visual analysis of the relevant orbitals or from the MO energies.
Figure 5.
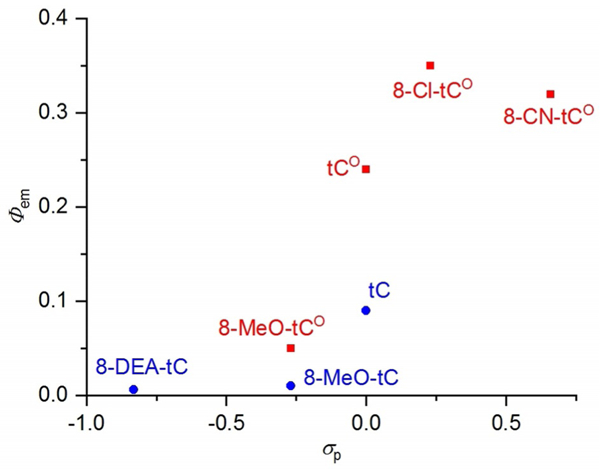
Correlation of fluorescence quantum yield Φem to Hammett σp for tC (blue) and tCO compounds (red).
To better understand fluorescence responses to solvation, we measured absorption and emission spectra of the tC(O) compounds in 1,4-dioxane as compared with 1 × PBS buffer at pH 7.4 (Table 1). Excitation energies (λmax,abs) were generally similar between solvents, but emission is blue-shifted in 1,4-dioxane, indicating that this solvent has less ability than water to stabilize the polar excited state of the fluorophores. 8-DEA-tC is a notable exception, with a red-shifted λmax,em in dioxane. Quantum yields of fluorescence were universally higher in dioxane. We also observed that distinct shoulders indicative of vibrational fine structure appeared in the emission spectra of tCO, 8-MeO-tCO, and 8-Cl-tCO as solvent mixtures approached 100% dioxane (Figure 6; shoulders were not observed for tC derivatives and 8-CN-tCO was not measured). These shoulders are separated from λmax,em by approximately 29 nm, corresponding to vibrational stretching wavenumbers near 1400 cm–1 and the vibrational energy level transitions for arene C—C and C—N bonds. Interestingly, a similar appearance of vibrational fine structure was observed in several cases when tCO analogues were base stacked in double-stranded oligonucleotides, and this was especially true with 8-Cl-tCO (vide infra).
Figure 6.

Normalized fluorescence emission spectra of the 8-Cl-tCO nucleoside in mixtures of 1 × PBS buffer (pH 7.4) and 1,4-dioxane. Vibrational fine structure appears only under nonaqueous conditions.
Photophysical Studies of tC(O) Derivatives in Single- and Double-Stranded Oligonucleotides
We chose a representative set of 10-mer oligonucleotides with varied 5’ and 3’ neighboring bases for these studies (Table 2). Attempts to prepare oligonucleotides containing 8-CN-tCO failed, seemingly because this analogue is sensitive to degradation under the standard conditions of solid-phase synthesis. Only one oligonucleotide incorporating tC was prepared because the photophysics of tC- and tCO-containing oligonucleotides have been thoroughly studied by Wilhelmsson.[42] The oligonucleotides were prepared using standard solid-phase synthesis conditions from the appropriate nucleoside phosphoramidites, purified by HPLC, and confirmed by mass spectrometry. Absorption and fluorescence spectra were recorded for these oligonucleotides in 1 × PBS buffer (pH 7.4) at 296 K and the measurements were repeated after duplex formation with matched, complementary DNA oligonucleotides. The quantum yields of fluorescence emission Φem were measured using the comparative method of Williams et al. and a fluorescence standard of quinine sulfate in 0.1 m H2SO4.[55] Temperature-dependent circular dichroism spectra were recorded and used to measure melting temperatures Tm and to assess conformational perturbations relative to the natural duplexes.
Table 2.
Photophysical properties single- and double-stranded oligonucleotides containing tC(O) compounds.[a]
| Analogue | Sequence Name | Sequence | ss Φem | ds Φem | dS λmax,abs [nm] (ss) |
ds λmax,em [nm] (ss) |
Tm [°C] | ΔTm [°C][b] |
|---|---|---|---|---|---|---|---|---|
| 8-Cl-tCO | AXA | 5′-CGC-AAX-ATC-G-3′ | 0.40 | 0.20 | 367 (363) | 447 (446) | 51.4 | + 0.4 |
| GXC | 5′-CGC-AGX-CTC-G-3′ | 0.15 | 0.14 | 367 (366) | 451 (453) | 29.6 | –34 | |
| TXA | 5′-CGC-ATX-AT C-G-3′ | 0.45 | 0.18 | 368 (368) | 445 (445) | 55.3 | + 5.0 | |
| TXT | 5′-CGC-ATX-TTC-G-3′ | 0.32 | 0.22 | 366 (363) | 447 (444) | n.s.⧧ | n.s.⧧ | |
| tC | AXA | 5′-CGC-AAX-ATC-G-3′ | 0.11 | 0.11 | 391 (391) | 502 (502) | n.d. | n.d. |
| 8-MeO-tC | AXA | 5′-CGC-AAX-ATC-G-3′ | 0.023 | 0.024 | 399 (397) | 529 (531) | 50.8 | –0.2 |
| GXC | 5′-CGC-AGX-CTC-G-3′ | 0.024 | 0.023 | 399 (399) | 532 (536) | 59.2 | –4.4 | |
| TXA | 5′-CGC-ATX-ATC-G-3′ | 0.029 | 0.029 | 398 (398) | 530 (532) | 55.5 | + 5.2 | |
| TXT | 5′-CGC-ATX-TTC-G-3′ | 0.036 | 0.029 | 403 (392) | 530 (526) | n.s.⧧ | n.s.⧧ | |
| 8-DEA-tC | AXA | 5′-CGC-AAX-ATC-G-3′ | 0.008 | 0.042 | 410 (415) | 498 (497) | 48.4 | –2.6 |
| GXC | 5′-CGC-AGX-CTC-G-3′ | 0.032 | 0.12 | 398 (425) | 500 (499) | 49.1 | –14.5 | |
| TXA | 5′-CGC-ATX-ATC-G-3′ | 0.014 | 0.026 | 420 (417) | 495 (495) | 48.7 | –1.6 | |
| TXT | 5′-CGC-ATX-TTC-G-3′ | 0.025 | 0.041 | 416 (413) | 495 (495) | 48.5 | + 0.2 | |
| GXA | 5′-CGC-AGX-ATC-G-3′ | 0.020 | 0.050 | 422 (425) | 499 (499) | 50.7 | –5.1 | |
| CXT | 5′-CGC-ACX-TTC-G-3′ | 0.020 | 0.025 | 414 (413) | 492 (495) | 54.7 | + 2.0 | |
| CXA | 5′-CGC-ACX-ATC-G-3′ | 0.014 | 0.017 | 410 (420) | 494 (493) | 57.4 | + 2.1 | |
| GXG | 5′-CGC-AGX-GTC-G-3′ | 0.027 | 0.056 | 400 (415) | 499 (498) | 58.2 | –7.0 | |
| CXC | 5′-CGC-ACX-CTC-G-3′ | 0.013 | 0.024 | 413 (421) | 496 (496) | 60.2 | + 6.7 | |
| tc† | AXA | 5′-CGC-AAX-ATC-G-3′ | 0.21 | 0.18 | 392 (391) | 507 (510) | 42 | +1 |
| GXC | 5′-CGC-AGX-CTC-G-3′ | 0.19 | 0.16 | 391 (394) | 507 (509) | 46 | –3 | |
| TXA | 5′-CGC-ATX-ATC-G-3′ | 0.21 | 0.20 | 395 (390) | 503 (509) | 45 | + 4 | |
| TXT | 5′-CGC-ATX-TTC-G-3′ | 0.22 | 0.20 | 399 (390) | 503 (507) | 44 | + 5 | |
Measurements performed in 1 ×PBS buffer, pH 7.4, 296 K.
= data from Wilhelmsson for tC-containing oligonucleotides of the same sequences, measured in 50 mM sodium phosphate buffer, pH 7.5.[39]
The melting curve was not sigmoidal (n.s.) and therefore no distinct Tm is indicated.
ΔTm =Tm(analogue-containing duplex)–Tm(corresponding duplex with natural cytidine).
Molecular modeling shows how tC(O) compounds are likely to be base paired and stacked in duplex oligonucleotides (Figure 7). This model was prepared beginning with an idealized duplex trimer in the native B form conformation, modifying a cytidine, and minimizing with the MMFF force field (Spartan’08) with all natural atoms held at fixed positions. CD spectra show that the B form is maintain when all of the tC(O) compounds substitute for cytidine (see Supporting Information). The model shows extensive π system overlap in the form of base stacking with the central heterocyclic ring of the 8-DEA-tC nucleobase, but most of the diethylaminobenzene group protrudes into the major groove, where the diethylamino group is exposed to solvent.
Figure 7.
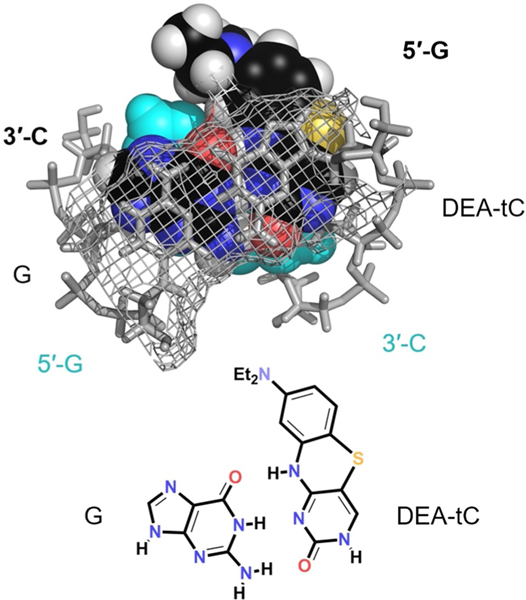
Molecular model (Spartan′08) showing 8-DEA-tC base paired and stacked in idealized B form DNA.
A bar chart plotting λem for 8-DEA-tC, 8-MeO-tC, tC, and 8- Cl-tCO as free nucleosides and in single- and double-stranded oligonucleotides (AXA sequence; Table 2) immediately reveals a trend in photophysical responses to base stacking and pairing (Figure 8). The electron-rich analogues, while less emitting as free nucleosides, exhibit a large fluorescence increase when incorporated into duplex oligonucleotides. In contrast, the electron-deficient 8-Cl-tCO shows a fluorescence decrease in the duplex as compared with the free nucleoside analogue. The unsubstituted parent tC, in contrast again, has relatively little fluorescence change in response to base stacking and Watson-Crick hydrogen bonding. To further study this relationship, we plotted the fluorescence change upon duplex incorporation, as expressed by Φem,ds/Φem,nuc on a logarithmic scale, against Hammett σp for each substituent (Figure 9). The clear trend indicates that the electronic nature of the cytidine analogue is a major determinant of its fluorescence response to base stacking and pairing. While similar data were collected for the single-stranded oligonucleotides containing the tC(O) analogues, we hesitate to ascribe meaningful trends to their photophysics. The well-characterized conformational variability of short, single-stranded DNA oligonucleotides makes it unlikely that the cytidine analogue fluorophores experience consistent local environments.
Figure 8.
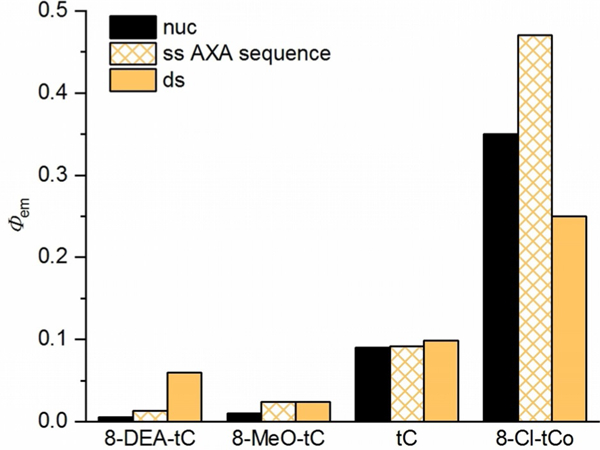
Changes in fluorescence quantum yield of four cytidine analogues upon incorporation into single- and double-stranded DNA oligonucleotides, measured in 1 × PBS buffer (pH 7.4). nuc=free nucleoside, ss = single-stranded oligonucleotide with the AXA sequence 5′-CGC-AAX-ATC-G-3′ (Table 2), where X = the fluorescent cytidine analogue, ds = matched, double-stranded oligonucleotide.
Figure 9.
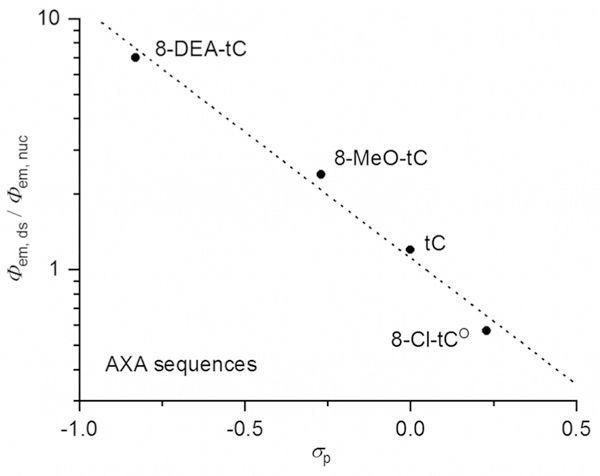
The fluorescence change upon incorporation of a tC(O) compound into a double-stranded oligonucleotide of the AXA sequence (Table 2), as expressed by Φem,ds/Φem,nuc on a logarithmic scale, is strongly correlated to the Hammett σp for the tC(O) compounds’ substituents.
As the data for the AXA sequences indicates a clear relationship between the electronics of the cytidine analogue and its fluorescence response to base stacking and pairing, we next examined the effects of neighboring bases on this response (Figure 10 and Table 2). The data show that 8-DEA-tC has the greatest sensitivity to neighboring bases of all analogues tested. The least bright sequence, CXA, shows approximately triple the Φem as compared with the 8-DEA-tC nucleoside, whereas the brightest sequence, GXC, exhibits a 20-fold greater Φem, the greatest known fluorescence turn-on response to base pairing and stacking. Considering only sequences with A as the 3′ neighbor, Φem increases from C, T, A, to G, following the order of decreasing oxidational potential of these canonical nucleobases.[56] A plot of Φem for these sequences against the oxidation potentials of the 5′-neighboring nucleobases gives a strong linear correlation (Figure 11). In contrast, when the 5′ neighbor is fixed as C, Φem increases slightly from 3′ neighbors of A to C (CXG was not measured), an opposite but much diminished trend (c.f. Figure 12). While it is not at this time entirely clear how these trends can be rationalized by structure, it is apparent that the different p stacked overlap on the 5′ and 3′ sides gives rise to very different electronic interactions between bases.
Figure 10.
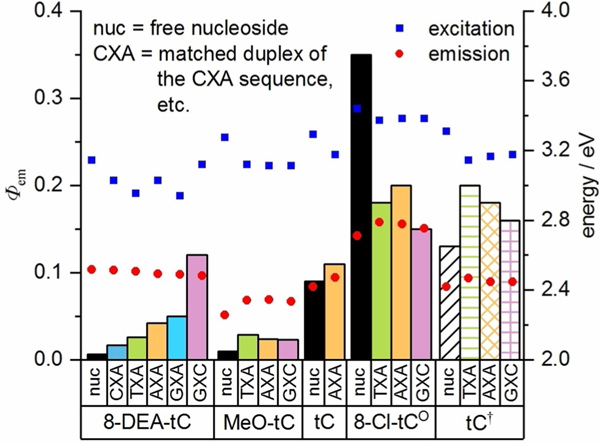
Fluorescence quantum yield of tC(O) derivatives as free nucleosides (black) and in duplex oligonucleotides with varied neighboring bases (full sequences given in Table 2), measured in 1×PBS buffer, pH 7.4 (columns plotted against left y-axis). Excitation and emission energy, derived from λmax,abs and λmax,, respectively are plotted as points against the right y-axis. tC† = data from Wilhelmsson for tC-containing duplex oligonucleotides of the same sequences, measured in 50 mM sodium phosphate buffer, pH 7.5.[39]
Figure 11.
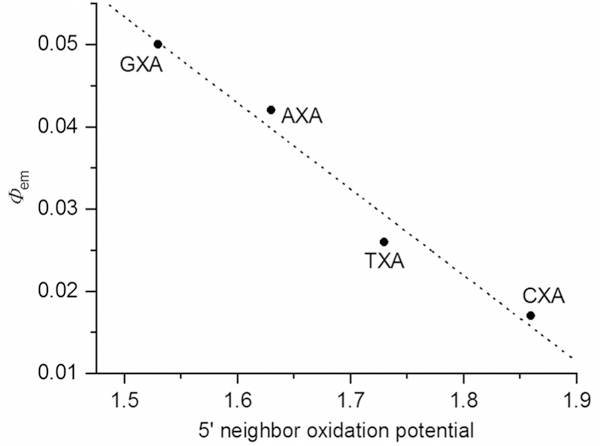
Dependence of the Φem of 8-DEA-tC-containing duplex oligonucleotides (for sequences, see Table 2) on the oxidation potential of the 5′- neighboring nucleobase.[56]
Figure 12.

Fluorescence quantum yield of tC(O) derivatives as free nucleosides (black) and in duplex oligonucleotides with varied neighboring bases (full sequences given in Table 2), measured in 1 × PBS buffer, pH 7.4. tC† = data from Wilhelmsson for tC-containing duplex oligonucleotides of the same sequences, measured in 50 mM sodium phosphate buffer, pH 7.5.[39]
The other analogues 8-MeO-tC, tC, and 8-Cl-tCO have fluorescence quantum yields that are much less sensitive to neighboring base effects. Clear trends in these smaller changes in Φem are not apparent, but it is notable that the least bright sequence including 8-Cl-tCO, GXC, is the brightest sequence for 8-DEA-tC. Here, the relatively electron-deficient 8-Cl-tCO has the most electronic rich canonical nucleobase, G, as its 5′ neighbor, and there is an associated decrease in fluorescence. The opposite was observed for electron-rich 8-DEA-tC. Again, tunable electronic interactions between neighboring bases are critical determinants of fluorescence changes. In contrast to this observation, we found that duplex stability as measured by ΔTm was lowest in the GXC sequence for all of the analogues, irrespective of how Φem changes in response to base stacking (Table 2). Similarly, CD spectra for all analogue-containing duplexes indicate the B form conformation, but the spectra are most perturbed in the GXC sequences. Specifically, there is a decrease in the local minima centered at 255 nm (see Supporting Information). These data suggest an intriguing local structural perturbation that may be very important for understanding changes in fluorescence, but that will likely require NMR or x-ray structural determination to fully understand.
The vibrational fine structure of the fluorescence emission spectra of some analogues is also affected by the duplex. Wilhelmsson et al. reported previously that parent tCO exhibits vibrational fine structure in its fluorescence emission spectrum when incorporated into a duplex DNA oligonucleotide, irrespective of the identity of the neighboring bases.[44] We find the same with 8-Cl-tCO in the present study (Figure 13 and additional spectra in the Supporting Information). We also observed that fluorescence emission intensity and the appearance of vibrational structure are further enhanced when 8-Cl-tCO is mispaired with adenosine (see also next paragraph). Wilhelmsson has previously proposed that the appearance of this vibrational fine structure can be attributed to the fact that ʺtCO is firmly stacked and has a very well-defined position and geometry at least on the time scale of fluorescence.ʺ[44] In light of our observation that very similar vibrational fine structure is observed in the emission spectra when the tCO nucleosides are simply dissolved in 1,4-dioxane—conditions under which they are surely not base stacked—we propose an alternative explanation. Solvation of the tCO compounds in aqueous buffer in all likelihood involves an ensemble of multiple types of hydrogen bonding arrangements between water and analogue, each with slightly perturbed vibrational energy levels. Collectively, such solvation states would broaden the emission spectra. The tCO analogues are engaged in Watson–Crick hydrogen bonds in duplex DNA, but this is a highly ordered arrangement of hydrogen bonds that stands in contrast with the ensemble of arrangements possible in solution. For this reason, solvation-induced perturbation of the vibrational energy levels is greatly diminished, and the vibrational fine structure emerges in the emission spectra. This model is further supported by the observation that vibrational fine structure is not seen when 8-Cl-tCO (and parent tCO) is present opposite an abasic site, and therefore is not engaged in ordered hydrogen bonding. The tC compounds, particularly 8-DEA-tC, do show hints of a similar emergence of vibrational fine structure upon base stacking, although this effect is much diminished (see spectra in the Supporting Information).
Figure 13.
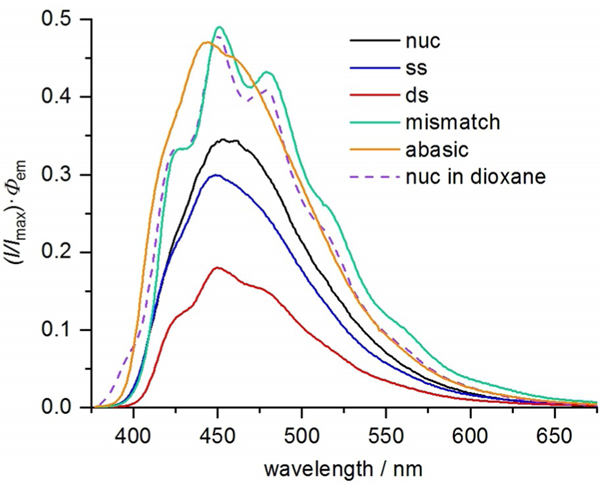
Fluorescence emission spectra of 8-Cl-tCO as a free nucleoside (black), in ssDNA (blue; AXA sequence from Table 2), and dsDNA (red; annealed to matched complement), in mismatched dsDNA (green; 8-Cl-tCO:A mismatch), and in dsDNA opposite the 1,2-dideoxy-D-ribose surrogate for an abasic site (orange; 8-Cl-tCO:AP) all in 1 × PBS buffer (pH 7.4), and the emission spectrum of 8-Cl-tCO nucleoside in 1,4-dioxane (purple dashed line).
Our prior studies of 8-DEA-tC′s fluorescence turn-on responses to base stacking and Watson–Crick hydrogen bonding prompted an investigation of how tC(O) analogue substituents influence fluorescence responses to mispairing and the presence of abasic sites. Choosing the AXA sequence and the analogues 8-DEA-tC, 8-MeO-tC, tC, and 8-Cl-tCO, we measured oligonucleotide fluorescence and the change in Φem upon duplex formation with a matched complement and a tC(O) derivative : adenosine mismatch (Table 3 and Figure 14). We also measured 8-DEA-tC and 8-Cl-tCO fluorescence when opposite a 1,2-dideoxy-D-ribose (AP) surrogate for an abasic site. While 8- DEA-tC’s fluorescence turn-on response to base stacking and base pairing is greatly diminished when opposite adenosine or an abasic site, the opposite trend is observed for 8-Cl-tCO. 8-MeO-tC and parent tC are in the middle, exhibiting slightly increased fluorescence when opposite adenosine as compared with when they are base paired with guanosine. Again, electronic modification of these tricyclic cytidines flips their responses to DNA duplex formation.
Table 3.
Photophysical properties matched and mismatched oligonucleotides of the sequence 5′-CGC-AAX-ATC-G-3′, where X = a tC(O) compound.[a]
| Analogue | Experiment | Complement | Φem | λmax,abs [nm] | λmax,em [nm] |
|---|---|---|---|---|---|
| 8-Cl-tCO | ss | 0.40 | 363 | 446 | |
| X:G match | 5′-CGA-GGC-TGC-G-3′ | 0.20 | 367 | 447 | |
| X:A mismatch | 5′-CGA-GAC-TGC-G-3′ | 0.41 | 370 | 449 | |
| X:AP | 5′-CGA-GAPC-TGC-G-3′ | 0.49 | 369 | 444 | |
| tC | ss | 0.11 | 391 | 502 | |
| X:G match | 5′-CGA-GGC-TGC-G-3′ | 0.11 | 391 | 502 | |
| X:A mismatch | 5′-CGA-GAC-TGC-G-3′ | 0.13 | 394 | 501 | |
| 8-MeO-tC | ss | 0.023 | 397 | 529 | |
| X:G match | 5′-CGA-GGC-TGC-G-3′ | 0.024 | 399 | 532 | |
| X:A mismatch | 5′-CGA-GAC-TGC-G-3′ | 0.041 | 401 | 526 | |
| 8-DEA-tC | ss | 0.008 | 415 | 497 | |
| X:G match | 5′-CGA-GGC-TGC-G-3′ | 0.042 | 410 | 498 | |
| X:A mismatch | 5′-CGA-GAC-TGC-G-3′ | 0.016 | 417 | 501 | |
| X:AP | 5′-CGA-GAPC-TGC-G-3′ | 0.007 | 421 | 466 | |
Measurements performed in 1 × PBS buffer, pH 7.4, 296 K. ss = single-strand including tC(O) analogue.
Figure 14.
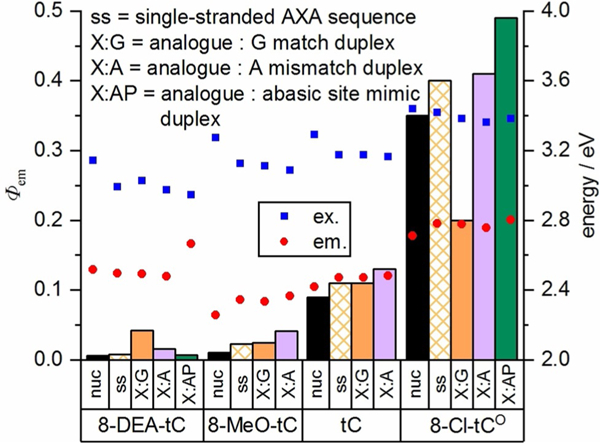
Fluorescence quantum yield of tC(O) derivatives in single-stranded oligonucleotides (AXA sequence; see Table 2), in matched duplexes X:G, with adenosine mismatches X:A, and opposite the abasic site mimic 1,2-dideoxy-D-ribose. Measurements were performed in 1 × PBS buffer, pH 7.4.
Looking at all of these data in aggregate, it is also apparent that there are distinct trends in excitation and emission energies, influenced by the electronic nature of the tC(O) analogues and the effects of base stacking and pairing (Figures 10, 12, and 14). For all analogues studied, base stacking lowers the excitation energy. Base pairing, in contrast, has little influence on excitation energy. The excitation energy for all analogues in all sequence contexts is little changed by base pairing with guanine, adenine, or the AP abasic site mimic. In contrast, when any tC(O) analogue is paired with the AP site, fluorescence emission occurs at greater energy (Figure 14). This observation suggests that hydrogen bonding at the Watson–Crick interface stabilizes the excited state of the tC(O) analogue. For all of the analogues except 8-DEA-tC, base stacking raises emission energy. 8-DEA-tC′s emission energy is slightly lowered by base stacking, especially with the neighboring bases associated with the strongest fluorescence turn-on. We note the parallel to 8-DEA-tC’s blue-shifted emission in buffer as compared with dioxane, unique among these tC(O) analogues.
Computational modeling of these effects remains challenging. Because 8-DEA-tC exhibits some of the strongest variation in quantum yield with complexation, its excitation spectrum was predicted by TDDFT as a function of its separation distance from the base pair partner guanine and from C, G, and A π-stacking neighbor nucleobase. The base-pairing (with no π-stacking) redshifts the predicted absorbance spectrum by roughly 15 nm at an H-bonding distance of 1.6 Å, and subsequent π-complexation with C and G cause additional redshifts of similar magnitude. This is qualitatively consistent with the drop in excitation energies shown in Figure 10 from monomer to oligonucleotide. The delocalization of MOs across adjacent nucleosides upon complexation is one promising line of inquiry, as previously suggested by Hardman and Thompson.[40] Molecular orbitals were calculated for three of the 8-DEA-tC duplex trimers appearing in Figure 10 (stacked as CXA, GXA, and GXC). Table 4 reports the distribution of electron density of the (nominal) 8-DEA-tC HOMO and LUMO for each of these three complexes, relative to the density localized on the analogue itself. The results show that orbital delocalization onto the neighboring nucleoside is consistently and significantly greater upon complexation with G than with A or C. Although this demonstrates a base-specific response to the stacking, additional calculations are planned to elucidate the origin of the effect and its relationship to the relatively high fluorescence response of 8-DEA-tC when stacked with guanine.
Table 4.
B3LYP/cc-pVDZ HOMO and LUMO electron densities of nucleosides stacked with X=8-DEA-tC, relative to the density localized on the central 8-DEA-tC.
| Complex | HOMO relative density | LUMO relative density | ||||
|---|---|---|---|---|---|---|
| A/X | C/X | G/X | A/X | C/X | G/X | |
| CXA | 0.008 | 0.003 | – | 0.045 | 0.002 | – |
| GXA | 0.068 | – | 0.456 | 0.108 | – | 0.453 |
| GXC | – | 0.002 | 0.621 | – | 0.003 | 0.539 |
Conclusions
In this project, we report on the synthesis and photophysical characterization of an extended series of tC(O) compounds as free nucleosides and in single- and double-stranded oligonucleotides. The compounds range from electron-deficient (8-CN- tCO) to electron-rich (8-DEA-tC). Photophysical studies of the free nucleosides show that EWGs shorten the Stokes shift of tCO compounds and raise Φem, although 8-CN-tCOs Φem is slightly depressed relative to 8-Cl-tCO. There is no clear pattern of substituent effects on molar extinction coefficient ε. Electron-richness is also associated with low Φem for tC compounds and there is a clear correlation between Hammett σp and ε, but patterns of Stokes shift are less apparent. Substituents clearly have the ability to alter photophysics in ways that are strongly correlated with σp, but the nature of these correlations—positive or negative, and exactly which photophysical parameters are correlated—depends on the heterocyclic scaffold of the fluorophore.
Electronic substituent effects play a large role in determining the fluorescent responses to base pairing and stacking and, in some cases, such as predicting neighboring base effects on 8-DEA-tC fluorescence, are critical parameters. In general, whereas parent tC is insensitive to base stacking, electron-deficient 8-Cl-tCO is partially quenched by base stacking, while electronrich 8-DEA-tC exhibits a fluorescence turn-on. 8-DEA-tC′s fluorescence turn-on is greatest when base-stacked against the most electron-rich natural neighbor, guanine, a trend that appears to be inverted for electron-deficient 8-Cl-tCO. Computation correctly predicts that emission energy is lowered (i.e. λmax,em is red-shifted) by base pairing and stacking and it is clear that MOs mix between neighboring bases, providing a general rationale for the strong effects on fluorescence and its dependence on the electronic nature of the fluorescent base analogue and its nearest neighbors. Electronic modifications to tC(O) compounds also invert the fluorescent responses to base pairing. 8-DEA-tC′s fluorescence turn-on is greatly diminished by mispairing with adenine or an abasic site, whereas 8-Cl-tCO is brightest in these contexts.
A striking observation in these studies is that the tCO compounds, especially 8-Cl-tCO, show enhanced vibrational fine structure in their emission spectra when in duplex oligonucleotides and base paired with G or A, and when dissolved in 1,4- dioxane. This vibrational fine structure is absent in aqueous buffer and when the analogue is present in the duplex opposite an abasic site. The data strongly suggest that the appearance of this vibrational fine structure is the result of highly organized hydrogen bonding as one would expect at the Watson–Crick interface or in a tautomeric base pair with adenine. Accordingly, this spectral feature may offer special applications for probing nucleic acid structure and dynamics at fast timescales.
Computational modeling predicts the orbital mixing between stacked bases that, along with electron richness or deficiency, is essential for determining fluorescence changes. Spectral predictions can, to some extent, rationalize changes in absorption and emission wavelengths and how they change in response to the duplex. But changes in CD spectra and duplex melting temperature upon analogue incorporation, particularly in the GXC sequences, indicate some local structural perturbation. For that reason, we expect that NMR or x-ray structure determination will be needed to determine the exact nature of base stacking of these analogues, information that will be invaluable for further computational studies.
Research on fluorescent nucleoside analogues continues to be inspired by the need for powerful, accurate, and nonperturbing probes for nucleic acid biophysics. 8-DEA-tC has a uniquely powerful ability to report on matched duplex formation by fluorescence turn-on, and the fluorescence spectra of 8-Cl-tCO have vibrational fine structure with exciting potential for use as a reporter on local structure and dynamics. The aggregate results of this study show that electronic tuning of fluorescent nucleosides modulates fluorescent responses to base pairing and stacking that are clearly determined by the electronic nature of neighboring bases and the hydrogen bonding at the Watson–Crick interface. Moreover, the diversity of fluorescent responses observed, including turn-on, turn-off, and changes in vibrational fine structure, invites a variety of applications in nucleic acid biophysics. We believe that further studies of structure-photophysics relationships will lead to a deeper understanding of nucleoside analogue fluorescence responses to the anisotropic environment of duplex nucleic acids, eventually allowing for useful fluorescent properties to be planned in rational design.
Supplementary Material
Acknowledgements
This work was supported by the National Science Foundation [CHE-1709796 to B.W.P]; the National Institutes of Health [GM058906 to K.L.T.]; the California State University Program for Education & Research in Biotechnology; and San Diego State University.
Footnotes
Experimental Section
General experimental information, synthetic procedures, compound characterization, photophysical experimental methods, and computational methods are described in the Supporting Information.
Supporting information and the ORCID identification number(s) for the author(s) of this article can be found under: https://doi.org/10.1002/chem.201803653.
Conflict of interest
The authors declare no conflict of interest.
References
- [1].Xu W, Chan KM, Kool ET, Nat. Chem. 2017, 9, 1043–1055. [DOI] [PMC free article] [PubMed] [Google Scholar]
- [2].Shin D, Sinkeldam RW, Tor Y, J. Am. Chem. Soc. 2011, 133, 14912–14915. [DOI] [PMC free article] [PubMed] [Google Scholar]
- [3].Rovira AR, Fin A, Tor Y, Chem. Sci. 2017, 8, 2983–2993. [DOI] [PMC free article] [PubMed] [Google Scholar]
- [4].Dumas A, Luedtke NW, J. Am. Chem. Soc. 2010, 132, 18004–18007. [DOI] [PubMed] [Google Scholar]
- [5].Sabale PM, Tanpure AA, Srivatsan SG, Org. Biomol. Chem. 2018, 16, 4141–4150. [DOI] [PMC free article] [PubMed] [Google Scholar]
- [6].Mata G, Luedtke NW, J. Am. Chem. Soc. 2015, 137, 699–707. [DOI] [PubMed] [Google Scholar]
- [7].Greco NJ, Tor Y, J. Am. Chem. Soc. 2005, 127, 10784–10785. [DOI] [PubMed] [Google Scholar]
- [8].Tanpure AA, Srivatsan SG, Chem. Eur. J. 2011, 17, 12820–12827. [DOI] [PubMed] [Google Scholar]
- [9].Haller A, Souliere MF, Micura R, Acc. Chem. Res. 2011, 44, 1339–1348. [DOI] [PubMed] [Google Scholar]
- [10].Frener M, Micura R, J. Am. Chem. Soc. 2016, 138, 3627–3630. [DOI] [PMC free article] [PubMed] [Google Scholar]
- [11].Schmidt OP, Mata G, Luedtke NW, J. Am. Chem. Soc. 2016, 138, 14733–14739. [DOI] [PubMed] [Google Scholar]
- [12].Hawkins ME, Pfleiderer W, Balis FM, Porter D, Knutson JR, Anal. Bio-chem. 1997, 244, 86–95. [DOI] [PubMed] [Google Scholar]
- [13].Narayanan M, Kodali G, Singh V, Xing Y, Hawkins ME, Stanley RJ, J. Phys. Chem. B 2010, 114, 5953. [DOI] [PubMed] [Google Scholar]
- [14].Bahreman A, Cuello-Garibo J-A, Bonnet S, Dalton Trans. 2014, 43, 4494–4505. [DOI] [PubMed] [Google Scholar]
- [15].Sinkeldam RW, Greco NJ, Tor Y, Chem. Rev. 2010, 110, 2579–2619. [DOI] [PMC free article] [PubMed] [Google Scholar]
- [16].Wilhelmsson LM, Q. Rev. Biophys. 2010, 43, 159–183. [DOI] [PubMed] [Google Scholar]
- [17].Wilson JN, Kool ET, Org. Biomol. Chem. 2006, 4, 4265–4274. [DOI] [PubMed] [Google Scholar]
- [18].Saito Y, Hudson RHE, J. Photochem. Photobiol. C 2018, 36, 48–73. [Google Scholar]
- [19].Burns DD, Teppang KL, Lee RW, Lokensgard ME, Purse BW, J. Am. Chem. Soc. 2017, 139, 1372–1375. [DOI] [PMC free article] [PubMed] [Google Scholar]
- [20].Börjesson K, Preus S, El-Sagheer AH, Brown T, Albinsson B, Wilhelmsson LM, J. Am. Chem. Soc. 2009, 131, 4288–4293. [DOI] [PubMed] [Google Scholar]
- [21].Preus S, Kilsa K, Miannay FA, Albinsson B, Wilhelmsson LM, Nucleic Acids Res. 2013, 41, e18. [DOI] [PMC free article] [PubMed] [Google Scholar]
- [22].a) Bood M, üchtbauer AFF, Wranne MS, Ro JJ, Sarangamath S, El-Sagheer H, Rupert D, Fisher RS, Magennis S, Höök F, Brown T, Kim BH, Dahlén A, Wilhelmsson LM, Grøtli M, Chem. Sci. 2018, 9, 3494–3502; [DOI] [PMC free article] [PubMed] [Google Scholar]; b) While this article was under review, a new paper disclosed an emissive FRET pair between nucleobases, see: Han JH, Park S, Hashiya F, Sugiyama H, Chem. Eur. J. 2018, 24, 17091 –17095. [DOI] [PubMed] [Google Scholar]
- [23].Tanpure AA, Srivatsan SG, Nucleic Acids Res. 2015, 43, e149. [DOI] [PMC free article] [PubMed] [Google Scholar]
- [24].Schweigert C, Gaß N, Wagenknecht H-A, Unterreiner A-N, ChemPhotoChem 2018, 2, 12–17. [Google Scholar]
- [25].Seio K, Kanamori T, Masaki Y, Tetrahedron Lett. 2018, 59, 1977–1985. [Google Scholar]
- [26].Füchtbauer AF, Preus S, Börjesson K, McPhee SA, Lilley DMJ, Wilhelmsson LM, Sci. Rep. 2017, 7, 2393. [DOI] [PMC free article] [PubMed] [Google Scholar]
- [27].Zargarian L, Ben Imeddourene A, Gavvala K, Barthes NPF, Michel B, Kenfack CA, Morellet N, René B, Fossé P, Burger A, Mély Y, Mauffret O, J. Phys. Chem. B 2017, 121, 11249–11261. [DOI] [PubMed] [Google Scholar]
- [28].Cservenyi TZ, Van Riesen AJ, Berger FD, Desoky A, Manderville RA, ACS Chem. Biol. 2016, 11, 2576–2582. [DOI] [PubMed] [Google Scholar]
- [29].Dziuba D, Pospíšil P, Matyasovsky J, Brynda J, Nachtigallova D, Rulí- šek L, Pohl R, Hof M, Hocek M, Chem. Sci. 2016, 7, 5775–5785. [DOI] [PMC free article] [PubMed] [Google Scholar]
- [30].Sholokh M, Improta R, Mori M, Sharma R, Kenfack C, Shin D, Voltz K, Stote RH, Zaporozhets OA, Botta M, Tor Y, Mély Y, Angew. Chem. Int. Ed. 2016, 55, 7974–7978; Angew. Chem. 2016, 128, 8106–8110. [DOI] [PMC free article] [PubMed] [Google Scholar]
- [31].Barthes NPF, Karpenko IA, Dziuba D, Spadafora M, Auffret J, Demchenko AP, M ély Y, Benhida R, Michel BY, Burger A, RSC Adv. 2015, 5, 33536–33545. [Google Scholar]
- [32].Butler RS, Cohn P, Tenzel P, Abboud KA, Castellano RK, J. Am. Chem. Soc. 2009, 131, 623–633. [DOI] [PubMed] [Google Scholar]
- [33].Koga Y, Fuchi Y, Nakagawa O, Sasaki S, Tetrahedron 2011, 67, 6746–6752. [Google Scholar]
- [34].Kovaliov M, Weitman M, Major DT, Fischer B, J. Org. Chem. 2014, 79, 7051–7062. [DOI] [PubMed] [Google Scholar]
- [35].Chawla M, Poater A, Oliva R, Cavallo L, Phys. Chem. Chem. Phys. 2016, 18, 18045–18053. [DOI] [PubMed] [Google Scholar]
- [36].Rodgers BJ, Elsharif NA, Vashisht N, Mingus MM, Mulvahill MA, Stengel G, Kuchta RD, Purse BW, Chem. Eur. J. 2014, 20, 2010–2015. [DOI] [PMC free article] [PubMed] [Google Scholar]
- [37].Foller Larsen A, Dumat B, Wranne MS, Lawson CP, Preus S, Bood M, Gradén H, Wilhelmsson LM, Gr0tli M, Sci. Rep. 2015, 5, 12653. [DOI] [PMC free article] [PubMed] [Google Scholar]
- [38].Valverde D, Vasconcelos Sanches De Araujo A, Carlos Borin A, Canuto S, Phys. Chem. Chem. Phys. 2017, 19, 29354–29363. [DOI] [PubMed] [Google Scholar]
- [39].Sandin P, Wilhelmsson LM, Lincoln P, Powers VEC, Brown T, Albinsson B, Nucleic Acids Res. 2005, 33, 5019–5025. [DOI] [PMC free article] [PubMed] [Google Scholar]
- [40].Hardman SJO, Thompson KC, Biochemistry 2006, 45, 9145–9155. [DOI] [PubMed] [Google Scholar]
- [41].Lin K-Y, Jones RJ, Matteucci M, J. Am. Chem. Soc. 1995, 117, 3873–3874. [Google Scholar]
- [42].Preus S, Kilsä K, Wilhelmsson LM, Albinsson B, Phys. Chem. Chem. Phys. 2010, 12, 8881. [DOI] [PubMed] [Google Scholar]
- [43].Sandin P, Lincoln P, Brown T, Wilhelmsson LM, Nat. Protoc. 2007, 2, 615–623. [DOI] [PubMed] [Google Scholar]
- [44].Sandin P, Borjesson K, Li H, Martensson J, Brown T, Wilhelmsson LM, Albinsson B, Nucleic Acids Res. 2008, 36, 157–167. [DOI] [PMC free article] [PubMed] [Google Scholar]
- [45].Becke AD, J. Chem. Phys. 1993, 98, 1372–1377. [Google Scholar]
- [46].Lee C, Yang W, Parr RG, Phys. Rev. B 1988, 37, 785–789. [DOI] [PubMed] [Google Scholar]
- [47].Becke AD, Phys. Rev. A 1988, 38, 3098–3100. [DOI] [PubMed] [Google Scholar]
- [48].Perdew JP, Burke K, Ernzerhof M, Phys. Rev. Lett. 1996, 77, 3865–3868. [DOI] [PubMed] [Google Scholar]
- [49].Zhao Y, Truhlar DG, Theor. Chem. Acc. 2008, 120, 215–241. [Google Scholar]
- [50].Schäfer A, Horn H, Ahlrichs R, J. Chem. Phys. 1992, 97, 2571–2577. [Google Scholar]
- [51].Schäfer A, Huber C, Ahlrichs R, J. Chem. Phys. 1994, 100, 5829–5835. [Google Scholar]
- [52].Dunning TH Jr., J. Chem. Phys. 1989, 90, 1007. [Google Scholar]
- [53].Jensen F, J. Chem. Phys. 2001, 115, 9113–9125. [Google Scholar]
- [54].Tomasi J, Mennucci B, Cammi R, Chem. Rev. 2005, 105, 2999–3094. [DOI] [PubMed] [Google Scholar]
- [55].Williams ATR, Winfield SA, Miller JN, Analyst 1983, 108, 1067–1071. [Google Scholar]
- [56].Seidel CAM, Schulz A, Sauer MHM, J. Phys. Chem. 1996, 100, 5541–5553. [Google Scholar]
Associated Data
This section collects any data citations, data availability statements, or supplementary materials included in this article.


