

Summary
Rewiring of metabolic pathways is a hallmark of tumorigenesis as cancer cells acquire novel nutrient dependencies to support oncogenic growth. A major genetic subtype of lung adenocarcinoma with KEAP1/NRF2-mutations, which activate the endogenous oxidative stress response, undergo significant metabolic rewiring to support enhanced antioxidant production. We demonstrate that cancers with high antioxidant capacity exhibit a general dependency on exogenous non-essential amino acids (NEAAs) that is driven by the Nrf2-dependent secretion of glutamate through system xc−(XCT), which limits intracellular glutamate pools that are required for NEAA synthesis. This dependency can be therapeutically targeted by dietary restriction or enzymatic depletion of individual NEAAs. Importantly, limiting endogenous glutamate levels by glutaminase inhibition can sensitize tumors without alterations in Keap1/Nrf2 pathway to dietary restriction of NEAAs. Our findings identify a metabolic strategy to therapeutically target cancers with genetic or pharmacologic activation of the Nrf2 antioxidant response pathway by restricting exogenous sources of NEAAs.
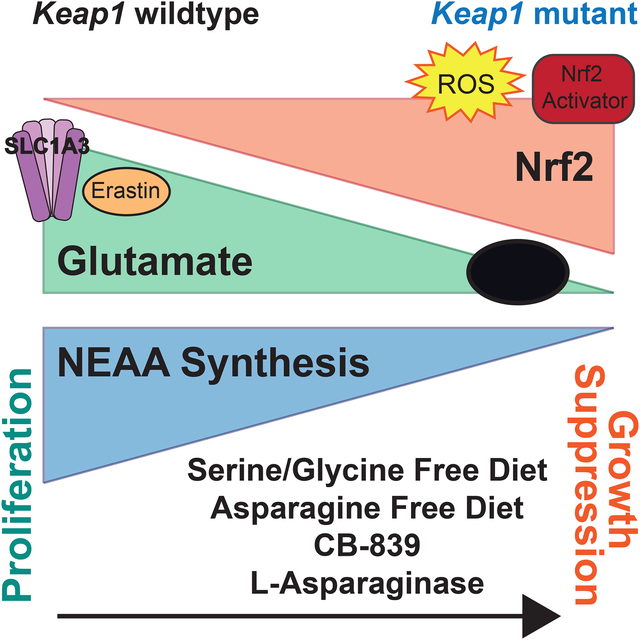
Graphical Abstract
eTOC
LeBoeuf et al. describe a general mechanism through which cancer cells depend on non-essential amino acids. Tumor cells with intrinsically low intracellular glutamate require amino acids to be supplied from the extracellular environment. By reducing the amount of circulating amino acids, the authors reduce tumor growth in vivo.
Introduction
NFE2L2 (hereafter NRF2) is the master transcriptional regulator of the cell’s antioxidant response. Nrf2 controls the transcription of a plethora of genes involved in the detoxification of reactive oxygen species (ROS). Under normal conditions Nrf2 is sequestered in the cytoplasm and targeted for proteasomal degradation through its interaction with Kelch-like ECH-associated protein 1 (hereafter Keap1). In the presence of ROS, key cystine residues on Keap1 are oxidized resulting in a conformational change which intern disrupts its interaction with Nrf2, allowing Nrf2 to translocate to the nucleus where it promotes transcription of target genes. KEAP1 or NRF2 are mutated in approximately 20% of KRAS-driven non-small-cell lung cancer (NSCLC), one of the most aggressive lung cancer subtypes, and therefore a major therapeutic target (Cronin et al., 2018). Additionally, mutations in the KEAP1/NRF2 antioxidant signaling pathway are common events in several solid cancers and are associated with poor patient prognosis and outcomes (Cancer Genome Atlas Research, 2012, 2014; Kovac et al., 2015). Loss of KEAP1 and subsequent stabilization of NRF2 leads to metabolic reprogramming in order to promote the endogenous antioxidant response, which confers proliferative and survival advantages to tumor cells (DeNicola et al., 2011; Mitsuishi et al., 2012; Romero et al., 2017; Sayin et al., 2017). However, maintaining oxidative homeostasis through chronic activation of the NRF2 pathway results in a unique set of metabolic requirements to support increased antioxidant capacity (DeNicola et al., 2015; Koppula et al., 2017; Mitsuishi et al., 2012; Romero et al., 2017; Sayin et al., 2017). Previous work from our group has shown that KEAP1/NRF2-mutant tumors are dependent on exogenous glutamine to sustain proliferation (Romero et al., 2017; Sayin et al., 2017). This dependency is due to two major transcriptional outputs of NRF2: 1) the consumption of glutamine-derived glutamate for glutathione (GSH) synthesis; and 2) the efflux of glutamate through system xc−, in exchange for cystine, the major source of cysteine for most cancer cells (Muir et al., 2017; Romero et al., 2017; Sayin et al., 2017; Shin et al., 2017). Depletion of endogenous glutamate pools due to high efflux through system xc− compromises the use of glutamate as a carbon source for TCA cycle anaplerosis (Fox et al., 2019; Koppula et al., 2017; Muir et al., 2017; Sayin et al., 2017; Shin et al., 2017).
In addition to supplying carbon to fuel central carbon metabolism, glutamate is a critical nitrogen donor for transamination reactions which catalyze the synthesis of NEAAs (DeBerardinis et al., 2007; Umbarger, 1978). NEAAs can be synthesized by cells de novo when their availability becomes limited. However, because of high proliferative capacity and increased metabolic output, many cancer cells become dependent on the exogenous supply of certain metabolites such as NEAAs, and synthesis is not adequate to keep up with demand (Tsun and Possemato, 2015). Although KEAP1/NRF2-mutations lead to a reliance on exogenous glutamine to supply glutamate, it remains unclear how other glutamate-dependent biosynthetic reactions, such as NEAA synthesis, are affected by this altered metabolic state where glutamate is actively secreted through system xc−. Although most studies have focused on understanding how individual amino acids contribute to tumorigenesis, it remains elusive whether genetic alterations that promote tumor formation can rewire metabolism to generate a more general requirement for exogenous sources of NEAAs.
Here we show that mutations in KEAP1 confer a dependency on exogenous uptake of multiple NEAAs in Kras-driven cell lines. We demonstrate that KEAP1 mutant cells have increased uptake of NEAAs and are sensitive to deprivation of asparagine, glycine and serine in vitro and in vivo. Despite their ability to synthesize NEAAs, KEAP1 mutant cells are unable to maintain sufficient amino acids pools by de novo synthesis under NEAA deprivation conditions. Blocking the efflux of glutamate thereby increasing intracellular glutamate levels through system xc− inhibition is sufficient to rescue amino acid synthesis and cell proliferation under NEAA deprivation conditions. Furthermore, these phenotypes are Nrf2-dependent and can be acutely induced by use of a small molecule activator of Nrf2 or by chronic ROS-dependent post-translational activation of Nrf2 in Keap1 wildtype adenocarcinomas originating from both lung and pancreas. Importantly, we show that by pharmacologic or Nrf2-dependent restriction of intracellular glutamate, we can suppress tumor growth by either dietary or enzymatic depletion of NEAAs in vivo. Together our data provides evidence for a general mechanism by which intracellular glutamate availability dictates the dependency of cancer cells on exogenously supplied NEAAs and this dependency may be therapeutically exploited through pharmacologic or dietary intervention.
Results
KEAP1 loss increases dependency on exogenous supply of NEAAs
KEAP1 mutations accelerate tumor progression (Romero et al., 2017) and result in metabolic reprograming of cancer cells (DeNicola et al., 2015; Koppula et al., 2017; Mitsuishi et al., 2012; Romero et al., 2017; Sayin et al., 2017), including depletion of intracellular glutamate levels. We reasoned that KEAP1 mutant tumors may possess an impaired ability to synthesize NEAAs and are more reliant on exogenous sources to sustain amino acid pools. In order to identify differential amino acid requirements in tumors carrying KEAP1 mutations we profiled in vitro uptake rates of NEAAs between isogenic mouse KrasG12D/+; p53−/− mutant lung adenocarcinoma cell lines that are either wildtype (Wt) or Keap1 null (Mut) (Romero et al., 2017). Indeed, Keap1 mutant cells exhibited increased uptake of a number of NEAAs including asparagine, glutamine, alanine, and glycine when compared to Keap1 wild-type cells (Figure 1a). Using [UC13]-L-serine, we confirmed Keap1 mutant cells uptake significantly more serine compared to Keap1 wildtype cells (Supplemental Figure 1a).
Figure 1: Keap1 loss increases dependency on exogenous supply of NEAAs.

a) In vitro uptake assay of amino acids after 24 hours b) Serum levels of asparagine, glycine and serine in mice bearing subcutaneous tumors. c) Proliferation in media lacking specified amino acid. d) Relative viability of cells cultured treated with L-asparaginase for 3 days. e) Proliferation of wildtype (Wt) or Keap1 mutant (Mut) LKR (KrasG12D/+;p53+/+) cell lines in media lacking serine or asparagine. f) Proliferation of cells expressing an empty vector or WT Keap1 in RPMI lacking serine or asparagine. g) Schematic depicting synthesis of serine from glucose (top) and asparagine from glutamine (bottom). Filled blue circles represent 13C atoms derived from [U13C]-D-glucose or [U13C]-L-glutamine. h) Mass isotopomer analysis of serine and asparagine in cells cultured in complete or amino acid deprived conditions. *p<0.05, **p<0.01, ***p<0.001, ****p<0.0001.
While Keap1 mutant cells uptake more NEAAs in vitro, cell metabolism can be drastically different in vivo (Davidson et al., 2016). To assess whether the increased uptake of NEAAs in vitro by Keap1 mutant cells is physiologically relevant in vivo, we subcutaneously transplanted wildtype and Keap1 mutant cells in C57B6/J syngeneic animals and monitored the levels of NEAAs in serum and tumors. We observed that mice bearing Keap1 mutant tumors had decreased serum levels of multiple NEAAs, including serine and glycine (Figure 1b and Supplemental Figure 1b & c).
To assess whether this increased uptake of NEAAs is functionally relevant for the growth of Keap1 mutant cells, we depleted individual NEAAs from the media and observed marked growth suppression of Keap1 mutant cells upon depletion of asparagine, serine and glycine (Figure 1c and Supplemental Figure 1d). Alanine, another highly consumed NEAA (Figure 1a) could not be depleted from the media (present in serum but not in DMEM or RPMI). However, supplementation of alanine to Keap1 mutant cells led to an increase in proliferation (Supplemental Figure 1e). Additionally, Keap1 mutant cells showed increased sensitivity to L-asparaginase (Figure 1d), a recombinant enzyme that catalyzes the degradation of asparagine to glutamate and aspartate, which is currently used for the treatment of acute lymphoblastic leukemia (Richards and Kilberg, 2006).
The genetic status of Trp53 has been previously shown to characterize dependency on exogenous serine (Maddocks et al., 2013). To exclude the possibility that the observed dependency of Keap1 mutant cells on exogenous NEAAs is driven by loss of p53, we used KrasG12D mutant lung adenocarcinoma cell lines with wildtype p53 (KrasG12D/+; p53+/+; LKR10 and LKR13; (Meylan et al., 2009)) that were either wildtype or mutant for Keap1 (Romero et al., 2017). Consistent with our data in p53 null, Keap1 wildtype cells, we observed that Keap1 loss increased uptake of NEAAs (Supplemental Figure 1f) and rendered p53 wildtype cells sensitive to both serine and asparagine deprivation (Figure 1e). Additionally, genetic complementation of Keap1 by over-expression of wildtype Keap1 cDNA in Keap1 null cell lines, was sufficient to rescue sensitivity to serine and asparagine depletion (Figure 1f), confirming that sensitivity to NEAA depletion is dependent on Keap1 loss. Similar, to mouse cells, human KEAP1 mutant lung adenocarcinoma cell lines were more sensitive to serine deprivation than KEAP1 wildtype cell lines (Supplemental Figure 1g & h) despite having other driver mutations. Taken together, these results indicate that Nrf2-activation generates a dependency on exogenous uptake of multiple NEAAs independent of the genetic status of Kras or p53.
We hypothesized that the increased uptake of NEAAs may be a result of increased basal demand in Keap1 mutant cells, and when exogenous NEAAs are depleted from the culture media, rates of de novo synthesis in Keap1 mutant are insufficient to sustain cellular proliferation. To test this hypothesis, we performed stable isotope tracing with [UC13]-D glucose and [UC13]-L glutamine to assess synthesis of NEAAs in replete as well as serine or asparagine deprived conditions (Figure 1g). We observe that when serine or asparagine are depleted from the culture media, rates of NEAA synthesis are roughly equivalent between Keap1 mutant and 6 wildtype cells (Figure 1h and Supplemental Figure 2a – c) indicating that wildtype and Keap1 mutant cells have roughly the equivalent capacity to synthesize serine when necessary. However, when serine or asparagine are removed from the media the total pool of these metabolites is significantly reduced in Keap1 mutant compared to wildtype cells (Figure 1h) suggesting that de novo synthesis in Keap1 mutant cells is unable to maintain adequate pools of these metabolites to sustain proliferation (Figure 1c). Additionally, in the case of serine, we observe that in complete media the total intracellular pool of serine in Keap1 mutant cells is much larger than in wildtype cells (Figure 1h). This suggests that Keap1 mutant cells have an increased requirement for serine. These findings are consistent with the idea that to support growth and increased anabolism, Keap1 mutant cells rely on uptake of exogenous NEAAs.
Acute activation of Nrf2 induces dependency on NEAAs
Given that genetic activation of Nrf2 in Keap1 mutant cells leads to a dependency on exogenous serine and asparagine, we hypothesized that pharmacological dependent stabilization of Nrf2 may lead to a similar metabolic demand. Indeed, we observed that acute activation of Nrf2 with a small molecule activator (KI696) (Davies et al., 2016; Sayin et al., 2017) led to suppression of growth upon deprivation of serine or asparagine (Supplemental Figure 2d & e) or treatment with L-asparaginase (Supplemental Figure 2f). Furthermore, to ensure this is not a cell line specific phenomenon we used a panel of five different murine KrasG12D/+; p53−/− lung adenocarcinoma cell lines and demonstrated that small molecule induced activation of Nrf2 led to a dependency on exogenous serine and asparagine (Figure 2a). Similarly, dependency on exogenous NEAAs was independent of p53 status as Nrf2 activation in p53 wildtype LKR lines lead to growth suppression in serine or asparagine depleted conditions (Figure 2b).
Figure 2: Acute activation of Nrf2 induces dependency on NEAAs.

a) Proliferation of wildtype (KrasG12D/+; p53−/−) murine LUAD tumor cell lines in the absence of serine or asparagine. b) Proliferation of Keap1 wildtype LKR (KrasG12D/+;p53+/+) cell lines in media lacking serine or asparagine. c) Proliferation of wildtype murine KrasG12D/+;p53−/− pancreatic cancer cell line in media lacking serine. d) Relative viability of Keap1 wildtype murine KrasG12D/+;p53−/− pancreatic cancer cell line treated with L-asparaginase. e) Schematic depicting mechanism of action of oxidants used to activate Nrf2. f) Proliferation of wildtype cells in media lacking serine or asparagine after oxidant treatment. *p<0.05, **p<0.01, ***p<0.001, ****p<0.0001.
We have previously characterized the specificity of the small molecule activator, and validated that it only disrupts the binding of Keap1 to Nrf2 and does not affect interactions of other proteins with Keap1 (Lignitto et al., 2019; Sayin et al., 2017). However, we confirmed the small molecule does not induce sensitivity to NEAA deprivation independently of Nrf2 activity by treating Nrf2 null cells. As expected, treatment with the Nrf2 activator only induced sensitivity in wildtype cells and had no effect on Nrf2 null cells (Supplementary Figure 2g).
Furthermore, we hypothesized that Nrf2 activation would lead to dependency on exogenous NEAAs independent of cancer subtype. To test this, we treated a murine KrasG12D/+; p53−/− pancreatic ductal adenocarcinoma cell line with the Nrf2 activator and observed robust growth suppression upon serine deprivation or treatment with L-asparaginase (Figure 2c & d).
Oxidative stress sensitizes Keap1 wildtype cells to NEAA deprivation
Our prior results demonstrate that activation of Nrf2 strongly sensitizes cells to NEAA depletion. In wildtype cells, Nrf2 is stabilized in response to ROS-dependent post-translational modifications of Keap1 and remains active until ROS are cleared. Therefore, we reasoned that during periods of chronic ROS stress, ROS would promote stabilization of Nrf2 in wildtype cells and would subsequently result in Nrf2-mediated metabolic rewiring. Therefore, when ROS is high, wildtype cells would efflux glutamate through system xc− and become sensitive to NEAA depletion, similar to Keap1 mutant cells. To test this hypothesis, we treated wildtype cells with various oxidants that interfere with different arms of the endogenous anti-oxidant response and activate Nrf2. Using a Thioredoxin reductase (TxR) inhibitor (Auranofin) (Urig and Becker, 2006), an inhibitor of GSH synthesis (L-buthionine-sulfoximine, BSO) (Griffith and Meister, 1979) and a general oxidative stress agent that will react with free cysteines (di-methyl fumarate, DMF) (Wang et al., 2015) we assessed whether Keap1 wildtype cells would become dependent on exogenous NEAAs (Figure 2e). We validated that treatment with all three oxidants resulted in stabilization of Nrf2 protein (Supplementary Figure 3a) and induced expression of Nrf2 target genes (Supplementary Figure 3b & c). Consistent with their mechanism of action, treatment with BSO and DMF also decreased GSH levels (Supplementary Figure 3d). Indeed, we observed that ROS induced activation of Nrf2 by three different oxidative stress agents sensitized wildtype cells to NEAA depletion (Figure 2f).
Low intracellular glutamate levels in cells with Nrf2 activation generates a dependency on exogenous NEAAs
NEAAs are synthesized from α-ketoacids to which an amino group is added via a glutamate or glutamine-dependent transamination reaction (Lehninger et al., 2000). Previously, we have reported that Nrf2 activation leads to a marked decrease in intracellular glutamate by utilization of glutamate for glutathione synthesis and the secretion of glutamate through system xc− to enable cystine uptake (Romero et al., 2017; Sayin et al., 2017). Given the increased dependency of cells with Nrf2 activation on exogenous NEAAs, we hypothesized that by increasing intracellular glutamate levels either by inhibiting system xc− or by expressing additional glutamate transporters (Figure 3a), we would enhance synthesis of NEAAs and decrease the dependency of Keap1 mutant cells on exogenous NEAAs. To inhibit system xc− activity we either pretreated cells with the small molecule inhibitor Erastin (Dixon et al., 2014) or high glutamate which forces the import of glutamate and export of cystine through system xc− in a concentration dependent manner (Briggs et al., 2016; Sayin et al., 2017; Watanabe and Bannai, 1987). Both Erastin and glutamate treatment of Keap1 mutant cells significantly increased intracellular glutamate levels (Figure 3b & c) and consequently decreased intracellular cystine levels (Supplementary Figure 3e). Treatment with either Erastin or glutamate was able to completely rescue Keap1 mutant cell growth when serine or asparagine were depleted (Figure 3d & e), or when cells were treated with L-asparaginase (Supplemental Figure 3f). In line with what we observed in murine lung adenocarcinoma, glutamate was also able to rescue sensitivity to NEAA depletion in a murine pancreatic ductal adenocarcinoma cell line after pharmacological activation of Nrf2 (Supplemental Figure 3g).
Figure 3: Low intracellular glutamate levels in cells with Nrf2 activation generates a dependency on exogenous NEAAs.

a) Schematic depicting modulation of intracellular glutamate levels. b and c) Relative intracellular abundance of glutamate in cells supplemented with glutamate or treated with Erastin. d and e) Proliferation of cells in media lacking serine or asparagine and supplemented with glutamate or Erastin. f) Relative metabolite flux of glutamate in cells expressing Slc1a3 or an empty vector. g and h) Proliferation of cells expressing Slc1a3 or an empty vector control in media lacking serine or asparagine. i and j) Relative viability of cells cultured in 0.1U/mL of L-Asparaginase or 10% the normal concentration of serine with increasing doses of CB-839. Data is represented as response to CB-839 treatment alone in media with 100% serine for each cell line. *p<0.05, **p<0.01, ***p<0.001, ****p<0.0001.
As a negatively charged amino acid, glutamate cannot freely diffuse across the plasma membrane and requires a dedicated transporter to enter the cell. To increase glutamate uptake, we over-expressed SLC1A3 (Garcia-Bermudez et al., 2018), a glutamate transporter that is normally expressed in the central nervous system by glial cells (Storck et al., 1992). In line with current literature, SLC1a3 was not expressed in our mouse LUAD cell lines, nor was its expression induced by pharmacologic or ROS mediated activation of Nrf2 or in response to NEAA depletion (Supplementary Figure 3h & i). However, expression of SLC1A3 resulted in dramatic increase in the re-uptake of glutamate which is normally exported through system xc− (Figure 3f) and as expected, rescued sensitivity of Keap1 mutant cells to glutaminase inhibition by CB-839 (Supplemental Figure 3j). Similar to treatment with glutamate or Erastin, expression of SLC1A3 rescued Keap1 mutant cell growth when serine and asparagine were depleted (Figure 3g & h) or when treated with L-asparaginase (Supplemental Figure 3k).
Previously, we have shown that Keap1 mutant cells are highly sensitive to CB-839, a glutaminase inhibitor which blocks the conversion of glutamine to glutamate (Romero et al., 2017; Sayin et al., 2017). Since increasing intracellular glutamate levels rescues cell growth when serine and asparagine are limited, we reasoned that CB-839 treatment should decrease glutamate availability and NEAA synthesis, and would further sensitize Keap1 mutant cells to NEAA deprivation. We cultured cells in either 0.1U/mL of L-asparaginase or reduced the amount of serine in the media to 10% of its normal concentration. We observed increased sensitivity of Keap1 mutant cells to very low doses of CB-839 (Figure 3i & j), which alone do not affect cell growth, suggesting possible synergistic effects of combining glutaminase treatment with NEAA deprivation. These results indicate that the increased efflux of glutamate by Keap1 mutant cells generates a major bottleneck in their ability to sustain amino acid pools under NEAA deprived conditions and that intracellular glutamate levels determine a cell’s dependency on exogenous NEAAs.
Glutamate availability restricts serine biosynthesis
In addition to protein synthesis, serine and glycine are important carbon sources to generate nucleotides, methyl groups, other amino acids, and contribute to GSH synthesis (DeNicola et al., 2015; Mehrmohamadi and Locasale, 2015; Yang and Vousden, 2016) (Supplementary Figure 4a). To determine which of these metabolites is limiting during serine deprivation we tested if supplementation with antioxidants to restore redox buffering or nucleotides could rescue Keap1 mutant cell growth in serine deprived conditions. Supplementation with the antioxidants N-acetylcysteine (NAC) or Trolox, did not rescue cell growth under serine deprivation (Figure 4a and Supplemental Figure 4b). However, supplementation with formate, which rescues the one-carbon cycle, or thymidine, which rescues nucleotide synthesis, led to a complete rescue of cell growth in Keap1 mutant cells under serine deprivation. This data suggests that nucleotide synthesis, and not antioxidant availability limits growth of Keap1 mutant cells in serine depleted conditions.
Figure 4: Glutamate availability restricts serine biosynthesis.

a) Proliferation of Keap1 mutant cells in RPMI lacking serine and supplemented with antioxidants or downstream products of serine metabolism. b) Proliferation Keap1 mutant cells expressing an sgRNA against PSAT in media lacking serine supplemented with formate, glutamate or Erastin. c) Schematic depicting serine synthesis from glucose. Filled blue circles represent 13C atoms derived from [U13C]-D-glucose. d) Mass isotopomer analysis of serine and glycine in cells cultured without serine supplemented with glutamate or treated with CB-839. e) Schematic depicting serine synthesis from glucose utilizing an amino group from glutamate. Filled orange hexagons represent 15N atoms derived from [α15N]-L-glutamine. f) Mass isotopomer analysis of serine and glycine in cells cultured in RPMI lacking serine. *p<0.05, **p<0.01, ****p<0.0001
Serine can be synthesized de novo from glucose in a multi-step reaction. Since, Keap1 mutant cells have a reduced incorporation of glutamine into the TCA cycle, it is possible that Keap1 mutant cells divert glucose into the TCA cycle to compensate, limiting glycolytic precursors for serine synthesis. Using [U-C13]-D-glucose we measured the incorporation of glucose derived carbon into the TCA cycle when cells were cultured in media lacking serine. Under these conditions we did not see an increase in glucose flux into the TCA cycle (Supplementary Figure 4c), suggesting that the availability of glycolytic precursors are not reduced in Keap1 mutant cells. This agrees with our previous observations that under basal conditions, there is not an increased flux of glucose to the TCA cycle in Keap1 mutant cells (Sayin et al., 2017). Glutamine incorporation into the TCA cycle was also unchanged when serine was depleted (Supplementary Figure 4c). In addition to glucose, serine synthesis requires the nitrogen from the amino group of glutamate to be added to phosphohydroxypyruvate (PHP) to generate phosphor-serine and α-ketoglutarate (DeNicola and Cantley, 2015). This transaminastion reaction is catalyzed by the enzyme phosphoserine aminotransferase (PSAT). We hypothesized that rescue of Keap1 mutant cell growth in the absence of exogenous serine by Erastin or glutamate supplementation was due to increasing glutamate availability for serine biosynthesis. To test this, we generated PSAT knockout wildtype and Keap1 mutant cells using CRISPR/Cas9. The ability of Erastin or glutamate to rescue cell growth in serine deprivation is dependent on the presence of PSAT (Figure 4b & Supplemental Figure 4d) suggesting that increasing intracellular glutamate levels rescues cell growth in the absence of serine by restoring serine biosynthesis.
To confirm that modulation of intracellular glutamate levels alters serine biosynthesis, we performed stable isotope tracing of [U13C]-D glucose in serine depleted conditions and looked for C13 incorporation into newly synthesized serine and its downstream metabolite, glycine (Figure 4c). When glutamate availability is limited by treatment with CB-839 we see a decrease in both serine and glycine synthesis (Figure 4d). Conversely, when we increase intracellular glutamate by glutamate supplementation we observe an increase in both serine and glycine synthesis (Figure 4d and Supplemental Figure 4e). To confirm that the nitrogen from glutamate is used for serine synthesis we cultured cells in the presence of [α15N]-L glutamine to determine the fate of the amino group of glutamate (Figure 4e). As expected, serine deprivation increases the incorporation of labeled nitrogen in both serine and glycine (Figure 4f and Supplemental Figure 4f). Additionally, we see decreased incorporation of labeled nitrogen in Keap1 mutant cells in serine deprived conditions (Figure 4f and Supplemental Figure 4f) suggesting that diminished glutamate availability in Keap1 mutant cells reduces serine synthesis. This is further supported by treating Keap1 wildtype cells with a small molecule activator of Nrf2 which subsequently results in decreased incorporation of labeled nitrogen in serine and glycine (Figure 4f and Supplemental Figure 4g).
In addition to glutamate availability, serine synthesis can be affected by redox balance (Diehl et al., 2019; Reid et al., 2018) and reduced TCA cycling as well as impaired mitochondrial function. We have previously supplemented Keap1 mutant cells with dimethyl-α-ketoglutarate (DMG), a cell permeable form of α-ketoglutarate to improve TCA cycle function and increase abundance of TCA cycle intermediates. Supplementation with DMG rescued sensitivity to restriction of glutamine in the culture media as well as treatment with CB-839 (Sayin et al., 2017). We supplemented Keap1 mutant cells with DMG and observed a rescue in cellular proliferation in serine deprivation conditions (Supplementary Figure 4h). However, addition of DMG also increased glutamate availability in Keap1 mutant cells (Supplementary Figure 4i). In a complementary approach we over expressed the yeast mitochondrial complex I protein, NDI1, in wildtype and Keap1 mutant cells. Expression of NDI1 in mammalian cells improves mitochondrial respiration and NAD+/NADH balance in cells which complex I activity is compromised (Birsoy et al., 2014; Santidrian et al., 2014; Wheaton et al., 2014; Yagi et al., 2006). Expression of NDI1 in Keap1 mutant cells rescued sensitivity to serine and asparagine deprivation (Supplementary Figure 4j). Like supplementation with DMG, expression of NDII also increase TCA cycle intermediates as well as elevate glutamate levels (Lozoya et al., 2018;Martinez-Reyes et al., 2016).
While rescue of other aspects of cellular metabolism that are impaired in Keap1 mutant cells can significantly improve their proliferative capacity in NEAA depleted conditions, we cannot exclude the possibility that this effect is also dependent on increases in intracellular glutamate levels. Here we provide strong evidence that cellular glutamate is predictive of sensitivity to NEAA deprivation. Genetic mutation of Keap1, small molecule activation of Nrf2, or treatment with the glutaminase inhibitor CB-839, which all reduce glutamate levels, result in sensitization of cancer cells to NEAA depletion. Conversely, modulating extracellular concentrations of glutamate, blocking glutamate efflux, increasing expression of glutamate transporters to promote uptake/re-uptake, or restoring other metabolic defects of Keap1 mutant cells which also increase intracellular glutamate levels rescued exogenous NEAA dependency.
Keap1 mutant tumors require exogenous NEAAs in vivo
Given the differential sensitivity of Keap1 mutant and wildtype cells to exogenous serine or asparagine depletion in vitro, we assessed their dependency on these NEAAs in vivo. We utilized a diet lacking both serine and glycine (-SG) (Maddocks et al., 2013; Maddocks et al., 2017), a diet lacking asparagine, or treated mice with L-asparaginase (Gwinn et al., 2018; Knott et al., 2018). Mice were subcutaneously injected with either wildtype or Keap1 mutant cells and upon tumor formation mice were randomized to different treatment groups. When depleting dietary serine and glycine, growth of Keap1 mutant tumors was significantly attenuated compared to tumor growth on an amino acid control diet (AA CTL) (Figure 5a and Supplemental Figure 5a). In contrast, we observed no effect on wildtype tumor growth in response to -SG diet (Figure 5a and Supplemental Figure 5a). Similarly, treatment with L-asparaginase, or a diet lacking asparagine (-N) blunted growth of Keap1 mutant but not wildtype tumors (Figure 5b & c and Supplemental Figure 5b). To validate that the amino acid defined diets and L-asparaginase treatments reduced amino acid levels, we confirmed depletion of serine, glycine, and asparagine in plasma (Supplemental Figure 5c & d). In the case of asparagine, we observed that treatment with L-asparaginase is more effective in reducing circulating asparagine than the asparagine diet (Supplemental Figure 5d). This is likely because L-asparaginase is able to degrade free asparagine from the diet or asparagine produced by other cells while the asparagine deficient diet only eliminates dietary sources. When combining an asparagine free diet with L-asparaginase treatment we see that the asparagine free diet alone results in a moderate reduction in tumor growth, but L-asparaginase treatment alone or in combination with the asparagine diet strongly blunts the growth of Keap1 mutant tumors (Figure 5d & e). These results are in line with the degree to which asparagine is reduced in the plasma (Supplemental Figure 5d).
Figure 5: Keap1 mutant tumors require exogenous NEAAs in vivo.

a) Relative tumor growth of subcutaneous tumors in animals receiving either -SG or AA CTL diet. b) Relative tumor growth of subcutaneous tumors in animals treated with either L-Asparaginase. c and d) Relative tumor growth of subcutaneous tumors in animals receiving -N or AA CTL diet in combination with L-asparaginase treatment. e and f) Relative tumor growth of subcutaneous Keap1 mutant (e) or wildtype (f) tumors in animals receiving either -SG or AA CTL diet and either treated with CB-839 or vehicle. *p<0.05, **p<0.01, ****p<0.0001
As NEAA limitation was synergistic with CB-839 treatment in vitro (Figure 3i & j), we next evaluated the impact of combining -SG diet with CB-839 treatment in vivo as administration of CB-839 reduces glutamate availability required for NEAA synthesis (Supplementary Figure 6a). As we have previously shown, Keap1 mutant but not wildtype tumors are sensitive to treatment with CB-839 (Romero et al., 2017)(Figure 5e & f and Supplementary Figure 6b). -SG diet along with CB-839 treatment further reduced Keap1 mutant tumor growth in mice compared to either monotherapy. Surprisingly, wildtype tumors were extremely sensitive to combination therapy (Figure 5f). In line with what we have previously observed, -SG diet or CB-839 treatment alone had no effect on wildtype tumor growth. However, administration of CB-839 in combination with the -SG diet had a strong synergistic effect and significantly reduced wildtype tumor growth (Figure 5f). We characterized both wildtype and Keap1 mutant tumors and stained for markers of Nrf2 activation (Nqo1), proliferation (phospho-Histone H3), oxidative damage (8-hydroxy-2’-deoxyguanosine), and cell death (cleaved caspase3). In line with expectations, we see increased Nqo1 and decreased 8-hydroxy-2’deoxyguanosine staining in Keap1 mutant tumors (Supplementary Figure 6c & d). Taken together, using both defined diets and enzymatic methods to deplete NEAAs, we demonstrate that Keap1 mutant tumors have an increased dependency on exogenous NEAAs in vivo. Furthermore, using existing therapeutic strategies to decrease intracellular glutamate levels, we can suppress tumor growth by limiting exogenous NEAAs in Keap1 WT tumors. These results provide novel therapeutic strategies for targeting Kras mutant NSCLC.
Discussion
Rewiring of cellular metabolism is a hallmark of cancer and is necessary to sustain chronic cellular proliferation (Hanahan and Weinberg, 2011). The activation of oncogenes and loss of tumor suppressors directly regulates metabolism to support increased cell growth (Heiden and DeBerardinis, 2017; Vander Heiden et al., 2009). Although, much effort has been focused on understanding how changes to tumor cell metabolism can be leveraged for effective cancer therapies, there is a limited understanding of the metabolic differences between common genetic subtypes of cancer and how those can be targeted by rationale metabolic therapies. We have previously shown that Nrf2 activation by Keap1 mutation results in the system xc− dependent export of glutamate, depleting intracellular glutamate levels (Romero et al., 2017; Sayin et al., 2017) (Figure 3b, c & f). Based on our prior work we hypothesized that low intracellular glutamate in Keap1 mutant tumors might impose a limitation for NEAA synthesis under conditions of nutrient stress. NEAAs are important building blocks for proteins, serve as signaling molecules (Briggs et al., 2016; Larson et al., 2007; Nicklin et al., 2009; Rhoads et al., 1997), generate essential co-factors and reducing molecules, and are substrates for other macromolecules (Mehrmohamadi and Locasale, 2015). Targeting NEAA availability and synthesis in tumors is an attractive therapeutic strategy as highly proliferating tumor cells often require NEAAs in excess of what de novo synthesis can provide (DeNicola and Cantley, 2015).
Here we demonstrate that limited glutamate availability reduces total pools of NEAAs (Figure 1h, Supplemental Figure 2, Figure 4) and drives dependency of Keap1 mutant cells on multiple NEAAs including serine, glycine, and asparagine (Figure 3) in a system xc− -dependent manner. We observe that modulation of glutamate or cystine in the microenvironment can either enhance or restrict cancer cell growth in the context of NEAA depletion. We also show combined depletion of multiple NEAAs in vitro (Figure 3i–j) and in vivo (Figure 5e) has a greater effect in reducing tumor growth in Keap1 mutant tumors. Additionally, Keap1 mutant cells uptake more NEAAs compared to wildtype cells both in vitro and in vivo and are sensitive to their depletion even as monotherapies (Figure 1a–d).
Keap1 mutant cells are able to synthesize both serine and asparagine in complete media and when they are depleted. In fact, rates of synthesis are similar to that of wildtype cells (Supplementary Figure 2a & b). However, Keap1 mutant cells have an increased basal demand for serine (Figure 1h) and depletion of serine or asparagine results in a greater depletion in the total pools of these amino acids compared to wildtype cells (Figure 1h). This suggests that when exogenous serine and asparagine are not available, de novo synthesis in Keap1 mutant cells is not sufficient to keep up with cellular demand.
Activation of Nrf2 dramatically alters cellular metabolism and maintaining a large redox capacity is metabolically costl. Keap1 mutant cells produce several times more GSH than wildtype cells (Supplementary Figure 3d). Chronic production of GSH as well as other antioxidants greatly alters the availability and flux of many metabolites. The large pool of GSH can function as a metabolic sink for many important substrates including glutamate, glycine, cysteine and serine. This causes the diversion of these metabolites away from other biosynthetic pathways and generates multiple metabolic liabilities. While Keap1 mutant cells are able to sustain high antioxidant capacity without compromising proliferation when nutrients are abundant, they are not able to sustain proliferation when particular metabolites are restricted (i.e. glutamine, serine, asparagine, glycine). The demand for serine is directly affected by production of GSH in Keap1 mutant cells as it is a source of glycine and cysteine, and serine will be diverted to GSH production possibly at the expense of other biosynthetic reactions such as nucleotide synthesis and 1-carbon metabolism.
Nrf2-dependent metabolic rewiring also affects central carbon metabolism and results in defects in the TCA cycle with decreased glutamine incorporation and overall reduced abundance of TCA cycle intermediates (Sayin et al., 2017). Decreased glutamate availability combined with reduced total abundance of aspartate likely limits the ability of Keap1 mutant cells to synthesis sufficient amounts asparagine when it is depleted from the media.
In this study we observe that intracellular glutamate levels are a key factor dictating the ability of Keap1 mutant cells to proliferate under NEAA deprivation. We use multiple approaches to increase intracellular glutamate levels and are able to rescue cellular proliferation in NEAA depletion (Figure 3). Conversely, further depleting glutamate in Keap1 mutant cells decreases cellular proliferation in conditions of mild NEAA restriction (Figure 3i & j) and further suppresses tumor growth (Figure 5e).
We show that reliance on exogenous NEAAs is a Nrf2-dependent phenotype (Figure 2, Supplemental Figure 2d–g), as acute activation of Nrf2 is sufficient to sensitize Keap1 wildtype cells to NEAA depletion in multiple contexts. While the pharmacokinetics of this particular Nrf2 activator prevent its efficient use in vivo (Cuadrado et al., 2019; Davies et al., 2016), strategies to increase ROS to elevate NRF2 activity are promising ways to sensitize wildtype cells to NEAA depletion (Maddocks et al., 2017). Indeed, we are able to sensitize wildtype cells to serine and asparagine depletion by pre-treatment with oxidants (Figure 2f) which resulted in Nrf2 activation in wildtype cells (Supplementary Figure 3a–c). This suggests that modulation of NEAA availability is widely applicable to both Keap1 mutant and wildtype tumors where treatment with oxidizing agents sensitizes low antioxidant tumors to depletion of NEAAs.
Furthermore, activation of Nrf2 in pancreatic cancer cells, is sufficient to sensitize cells to NEAA deprivation (Figure 2c & d) indicating that activation of the endogenous antioxidant response via Nrf2 stabilization results in a similar metabolic phenotype regardless of tissue of origin. Furthermore, guided by insights from resistance mechanisms (Figure 3), we demonstrate that the metabolic dependency on NEAAs we uncover in high antioxidant tumors can be exploited in a more general fashion in low antioxidant tumors that lack alterations in the Keap1/Nrf2 antioxidant pathway. We show that cancers, such as Kras and p53 mutant tumors that do not respond to known metabolic therapies (e.g. glutaminase inhibition or L-Asparaginase), can be targeted by combination therapy. We observe that by pharmacological depletion of intracellular glutamate levels (CB-839) we strongly sensitize Keap1 wildtype tumors to dietary restriction of serine and glycine (Figure 5f), similar to what is observed in Keap1 mutant tumors (Figure 5e) with no toxicity. The combination of glutaminase inhibition with dietary restriction of serine and glycine did not alter Nrf2 pathway activation in wildtype tumors (Supplementary Figure 6c). Instead, by using CB-839 to reduce glutamate in wildtype tumors we are able to mimic the metabolic environment of Keap1 mutant tumors and induce sensitivity to NEAA depletion. This further strengthens our observations that intracellular glutamate levels dictates dependency on exogenous NEAAs.
Our data highlights the importance of understanding how particular mutations, other than the well-known drivers (eg. Kras, p53), can strongly impact the metabolic landscape of tumors and their response to metabolic therapies. For example, elegant work has shown that Kras and p53 status are important in regulating serine metabolism and cell survival during serine deprivation (Maddocks et al., 2013; Maddocks et al., 2017). However, the effect of Keap1 mutations on glutamate availability for NEAA synthesis “overrides” the effects of oncogenic KRAS or p53 mutation on serine and glycine deprivation. These observations further emphasize the need for more comprehensive metabolic characterization of various genotypic subtypes of cancer.
In Summary, we uncover a general mechanism in which a specific genotype, renders cells dependent on multiple NEAAs including serine, glycine, and asparagine. This dependency on exogenous NEAAs can be therapeutically targeted by dietary or enzymatic depletion of specific amino acids to blunt tumor growth (Figure 6) and is broadly applicable regardless of tissue of origin. Additionally, utilizing oxidizing agents or a small molecule glutaminase inhibitor to modulate cellular metabolism, we strongly sensitize Keap1 wild type cells to deprivation of NEAAs (Figure 6b, Figure 2f & Figure 5f). Using our pre-clinical models, we are the first to show that dietary restriction or enzymatic depletion of asparagine can lead suppression of Keap1 mutant tumor growth (Figure 5b–d). Importantly, we repurpose a well-established metabolic therapy currently used for Acute Lymphoblastic Leukemia, L-Asparaginase, for the treatment of Keap1 mutant lung cancer. Our work, as well as that of others, support that metabolite restriction through pharmacological or dietary means can effectively suppress tumor growth (Elia et al., 2017; Gao et al., 2019; Gwinn et al., 2018; Hopkins et al., 2018; Knott et al., 2018; Loayza-Puch et al., 2016; Maddocks et al., 2013; Maddocks et al., 2017; Sousa et al., 2016; Sullivan et al., 2018). Moving forward, combination of dietary modification with standard of care chemotherapeutics may improve patient response. Additionally, based on our findings, modulation of intracellular glutamate levels through pharmacological intervention may be used to sensitize KRAS driven NSCLC to NEAA depletion, independent of Keap1 status and may be a broadly applicable therapeutic strategy in other cancer subtypes.
Figure 6: Activation of oxidative stress response depletes intracellular glutamate and generates a dependency on exogenous amino acids.

a) Schematic depicting how activation of the oxidative stress response via genetic, pharmacologic or physiological ROS stress to stabilize Nrf2, depletes intracellular glutamate. In cells with activated Nrf2 glutamate is shuttled into glutathione (GSH) biosynthesis or exported through the system xc− antiporter (xCT) to import cystine. This depletes intracellular glutamate levels and limits its availability for other biosynthetic reactions. Reduced availability of intracellular glutamate restricts its use in transamination reactions for synthesis of nonessential amino acids (NEAA) rendering cells dependent on uptake of NEAAs from the microenvironment.
Limitations
While we provide evidence that these findings are applicable to cancers from other tissues of origin, we did not exhaustively test multiple subtypes and in some cases Keap1 mutation may not drive NEAA dependency in specific tissues. Additionally, we showed that our findings regarding serine deprivation were also true in human cell lines. However, the mutational complexity in human cancers is much greater compared to murine cancer models. Thus directly translating all of our findings to human models and patients may be difficult without further investigation.
STAR METHODS
Lead Contact and Materials Availability
Further information and requests for resources and reagents should be directed to Lead Contact, Thales Papagiannakopoulos (papagt01@nyulangone.org) This study did not generate new unique reagents.
Experimental Model and Subject Details
Mice
All animal studies described were approved by the NYU Langone Medical Center Institutional Animal Care and Use Committee. Animals were housed according to IACUC guidelines in ventilated caging in a specific pathogen free (SPF) animal facility. 5 × 10⁵ cells were implanted subcutaneously into C57BL/6J female littermates approximately 6–8 weeks in age. Tumor volume was measured by caliper and volume was calculated (Length × Width2 × 0.5). After tumor establishment phase (tumor volume ~50–100mm3), animals were randomized and assigned to a treatment group. Animals either received an amino acid control diet, diet lacking both serine and glycine, or a diet lacking asparagine (Envigo), 200mg/kg CB-839 or vehicle (Calithera) twice daily administered through oral gavage as previously described (Davidson et al., 2016), 60U of L-Asparaginase (Abcam) or vehicle once daily administered through intraperitoneal injection as before (Knott et al., 2018) or some treatment combination as indicated. No animals were excluded from analysis. Tumor growth was tracked for a minimum of 8 tumors per experimental group.
Cell lines and culture
Murine KrasG12D/+;p53−/− wildtype and Keap1 mutant isogenic clonal cell lines and LKR10/13 cell lines were previously established (Romero et al., 2017). Additional KP parental cell lines were previously established and described (Dimitrova et al., 2016). Murine KrasG12D/+;p53−/− pancreatic cancer cell lines were provided by the Kimmelman lab. Murine cell lines were originally derived from female mice. Human cell lines were acquired from ATCC. All cell lines tested negative for mycoplasma (PlasmoTest, InvivoGen). All cell lines were cultured in a humidified incubator at 37°C and 5% CO2. Cells were maintained in either DMEM or RPMI-1640 (Cellgro) supplemented with 10% fetal bovine serum (Sigma Aldrich) and gentamicin (Invitrogen).
Method Details
Cell proliferation and viability assays
For cell proliferation assays conducted under different drug or media conditions as indicated, cells growing in DMEM were trypsinized, counted and plated into 12 well plate dishes (BD/Falcon) in 1mL of RPMI media. For rescue experiments, cells were treated with indicated drugs after attachment, 500nM Erastin (EMD Millipore), 6mM Glutamate (Sigma Aldrich), 50uM Trolox (Acros Organics), 0.5mM N-acetyl-L-cysteine (NAC, Acros Organics), 30uM hypoxanthine (Acros Organics), 3mM formate (Amresco), 16uM thymidine (Sigma Aldrich), 2mM dimethyl-ketoglutarate (Sigma Aldrich) or 1uM KI-696 (Nrf2 activator; provided by Craig Thomas, NCI). In experiments where the Nrf2 activator (KI696) was used, cells were pretreated with 1uM for 3 days prior to the start of the experiment. For deprivation experiments, cells were washed with PBS and media was replaced with 1mL of complete RPMI or RPMI lacking indicated amino acid and supplemented with 10% dialyzed FBS and cells were re-treated with indicated drugs. RPMI was prepared from a powder mix without amino acids (US Biological)according to manufacturer’s instructions. All other amino acids besides those indicated were added to the RPMI mixture in the same concentrations present in RPMI-1640 formulation (Cellgro, Corning). For oxidant treatment experiments cells were pre-treated for 48 hours with 10uM or 50uM buthionine sulfoximine (BO, Sigma Aldrich), 5uM dimethyl-fumarate (DMF, Sigma Adrich), or 0.5uM auronafin (Sigma Aldrich) unless otherwise indicated. Proliferation experiments were carried out for 5 days post drug treatment and collected by staining. Cells were stained with a 0.5% crystal violet (Fisher) solution in 20% methanol. Plates were then washed, dried, and crystal violet was eluted in 400uL of 10% acetic acid.
For cell viability assays cells were plated in a white, opaque 96-well plate with clear bottom at a density of 1000 cells/well in RPMI or RPMI with modified amino acid content. After attachment, CB-839 (Selleck) or L-Asparaginase (AbCam) were added at the indicated concentrations. After 3 days, cell viability in the presence of all compounds was assessed by cell titer glo (Promega).
All data is represented as relative to vehicle treated condition in complete media unless otherwise indicated.
qPCR analysis
mRNA was harvested from cells using an RNeasy mini kit (Qiagen) according to manufacturer’s protocol. Extracted mRNA was used to synthesize cDNA using the High Capacity cDNA Reverse Transcription Kit (Applied Biosciences, ThermoFisher Scientific) according to manufacturer’s protocol. Gene expression was analyzed by quantitative reverse transcription polymerase chain reaction on a QuantStudio3 (Applied Biosciences, ThermoFisher Scientific). A List of specific primers used can be found in Supplementary Table 1.
Immunoblotting
Cells were collected and lysed in 150uL of ice-cold RIPA buffer (ThermoFisher Scientific) supplemented with 1X protease and phosphatase inhibitor (ThermoFisher Scientific) and mixed on a rotator at 4°C for 30 minutes. Supernatant was collected after centrifugation at 15,000rpm for 15 minutes. Protein concentrations were determined using the Bio-Rad DC Protein Assay.20 – 40μg of total protein was separated on a 4–12% Bis-Tris gradient gel (Invitrogen) and then transferred onto nitrocellulose membrane (BioRad). A custom made Nrf2 antibody (1:1000, provided by Edward Schmidt, Montana State University) and anti-HSP90 (1:4000, BD #610418) antibody were used. Nrf2 was detected by a goat anti-rabbit secondary antibody (1:25000, LI-COR Biosciences). HSP90 was detected by a goat anit-mouse secondary antibody (1:25000, LI-COR Biosciences).
Immunohistochemistry
Mice were euthanized by carbon dioxide asphyxiation. Tumors were dissected and fixed with 10% formalin overnight, transferred to 70% ethanol, and then embedded in paraffin. 3μM thick sections were cut and stained with H&E. Immunohistochemistry on paraffin-embeded sections was performed using antibodies against Nqo1 (1:100, Sigma, HPA007308), phospho-histone-H3 (1:100, Ser10; Cell Signaling, #9701), 8-oxo-deoxyguanosine (1:100, Abcam, #ab48508), and cleaved caspase3 (1:200, Cell Signalin, #9579). Chromogenic IHC was performed on a Leica Bond RX and stained slides were imaged on a Leica SCN400 F whole-slide scanner. For Nqo1, 8-oxo-deoxyguanosine, and phospho-histone-H3 staining antigen retrieval was performed using antigen retrieval buffer pH6 (Leica) for 20 min and for cleaved caspase3 staining, antigen retrieval buffer pH9 (Leica) was used for 20min. For detection, Leica Bond Polymer Refine Detection secondary antibody (Leica, #DS9800) was used according to manufacturer’s protocol for Nqo1, phosphor-histone-H3 and cleaved caspase3. 8-oxo-deoxyguanosine was detected with the Biocare MM HRP-polymer secondary antibody (Biocare, #MM620H) according to manufacturer’s protocol.
Cell Line generation (Keap1 complement cells, SLC1A3 overexpression and PSAT knockouts)
Keap1 complemented cells were generated by cloning mouse Keap1 cDNA into Gibson compatible lentiviral backbone with a hygromycin resistance cassette. Cells over expressing SLC1a3 were generated by cloning human SLC1a3 into the PMXS-puro retoviral backbone. sgPsat or sgCtl cells were generated by cloning sgRNA sequences into the LentiV2 Puro backbone (See Supplementary Table 1).
Lentiviruses or retroviruses were then produced by co-transfection of HEK293 cells with lentiviral or retroviral backbone constructs and packaging vectors (delta8.2 and VSV-G) using PEI Pro (PolyPlus). Viral supernatant was collected 48 hours and 72 hours after transfection. Recipient cells were incubated with viral supernatant for 24 hours after each collection. Cells were then selected with either puromycin or hygromycin.
GC/MS analysis of polar metabolites and stable isotope tracing
For analysis of cells, 1 × 10⁵ cells were seeded in 1mL of RPMI-1640 in 12 well plates. Where indicated, cells were pretreated with 6mM glutamate, 500nM Erastin, or 1uM KI696. Media was then replaced with fresh RPMI lacking serine or asparagine where indicated and supplement with 10% dialyzed FBS. For tracing experiments media contained 11mM [U13C]-D-glucose, 2mM [U13 C]-L-glutamine, 2mM [α15N]-L-glutamine, or 285μM [U13 C]-L-serine (Cambridge Isotope Laboratory). Cells were treated with 250nM CB-839 and cultured for 1–3hours. Cells were washed 2X in ice cold saline and then collected by scraping in 250uL of 80% (v/v) of ice-cold methanol containing 1.4ug/mL norvaline (Sigma Aldrich). Samples were vortexed for 10min at 4°C and then centrifuged at max speed for 5 minutes. Supernatant was transferred to fresh tubes and then dried in a speed vac. For analysis of mouse plasma, whole blood was collected at the time of sacrifice by a retro-orbital bleed with heparin coated capillary tubes (Fisher) into EDTA containing microcentrifuge tubes. Whole blood was centrifuged for 5 minutes at 1600g. Cleared plasma was transferred to fresh tubes and 4uL of plasma was then aliquoted and used for analysis. 80% (v/v) methanol containing 1.4ug/mL norvaline was added to plasma and samples were then dried in a speed vac. Dried metabolite extracts were then derivatized with 20uL O-methoxyamine-hydrochloride (MOX) reagent (Sigma) in pyridine (Sigma Aldrich) at a concentration of 20mg/mL for 60min at 37°C and 30uL of N-tert-butyldimethylsilyl-N-Methyltrifluoracetamide with 1% tert-Butyldimethylchlorosilane (TBDMS, Sigma) for 30min at 37°C. After derivatization, samples were analyzed by GC-MS using an HP-5MS column (Agilent Technologies) in an Agilent Intuvo gas chromatograph coupled to an Agilent 5997B mass spectrometer. Helium was used as the carrier gas at a flow rate of 1.2mL/minute. One microliter of sample was injected in split mode (split 1:1) at 270°C. After injection the GC oven was held at 100°C for one minute and then increased to 300°C at 3.5°C /min. The oven was then ramped to 320°C at 20°C /min and held for 5min at 320°C.
The MS system operated under electron impact ionization at 70 eV and the MS source and quadrupole were held at 230°C and 150°C respectively the detector was used in scanning mode, and the scanned ion range was 10–650 m/z. Mass isotopomer distributions were determined by integrating the appropriate ion fragments for each metabolite (Lewis et al., 2014) using MATLAB (Mathworks) and an algorithm adapted from Fernandez and colleagues (Fernandez et al., 1996) that corrects for natural abundance. For all data total or relative metabolite pool sizes are normalized to cell counts for each condition.
LC/MS analysis of glutathione and stable isotope tracing
Metabolites were extracted in the same way as for GC/MS analysis. Once dried, metabolite extracts were resuspended with 200μL of −20°C 40:40:20 methanol:acetonitrile:water with 0.5% formic acid, vortexed, and held on ice for 10 min. NH4HCO3 (15%(w/v)) was added and samples were vortexed and held on ice 20 minutes before centrifugation 2 times at 4°C at 21,130 × g for 30 minutes each. Metabolite levels in samples were measured using a quadrupole-orbitrap mass spectrometer (Q Exactive, Thermo Fisher Scientific, San Jose, CA) operating in negative ion mode was coupled to hydrophilic interaction chromatography via electrospray ionization and used to scan from m/z 70 to 1000 at 1 Hz and 75,000 mass resolution. LC separation was on a XBridge BEH Amide column (2.1 mm × 150 mm, 2.5 m particle size, 130 Å pore size; Waters, Milford, MA) using a gradient of solvent A (20 mM ammonium acetate, 20 mM ammonium hydroxide in 95:5 water: acetonitrile, pH 9.45) and solvent B (acetonitrile). Flow rate was 150 μL/min. The LC gradient was: 0 min, 90% B; 2 min, 90% B; 3 min, 75% B; 7 min, 75% B; 8 min, 70% B; 9 min, 70% B; 10 min, 50% B; 12min, 50% B; 13 min, 25% B; 14 min, 25% B; 16 min, 0% B; 20.5 min, 0% B; 21 min, 90% B; 25 min, 90% B. 10ul of sample was injected into the instrument.
Quantification and Statistical Analysis
Values are presented as mean ± SEM. For statistical analysis we used Graphpad Prism software v 8.1.2 (Graphpad): two-way ANOVA for tumor growth and 2-sided Student’s t-test for cell proliferation, metabolite analysis, and gene expression analysis. All experiments were repeated at least twice. All cell proliferation experiments and metabolite analysis contained 3 biological replicates. Cell viability assays contained 8 biological replicates and animal experiments and materials generated and analyzed from animal experiments contained a minimum of 5 biological replicates with a maximum of 10.
Data and Code Availability
This study did not generate any unique datasets or code.
Supplementary Material
KEY RESOURCES TABLE.
| REAGENT or RESOURCE | SOURCE | IDENTIFIER |
|---|---|---|
| Antibodies | ||
| Nrf2 (1:1000) | Edward Schmidt’s Lab | N/A |
| Hsp90 (1:4000) | BD Biosciences | Cat#610418; RRID:AB_397798 |
| Nqo1 (1:100) | Sigma Aldrich | Cat# HPA007308; RRID:AB_1079501 |
| Cleaved Caspase3 (1:200) | Cell Signaling | Cat# 9579, RRID:AB_10897512 |
| Phosph-histone-H3 (1:100) | Cell Signaling | Cat#9701; RRID:AB_331535 |
| 8-oxo-deoxyguanosine (1:100) | Abcam | Cat#ab48508; RRID:AB_867461 |
| Chemicals, Peptides, and Recombinant Proteins | ||
| Glutamate (6mM) | Sigma Aldrich | Cat# G8415 |
| Erastin (500nM) | EMD Millipore | Cat# 329600 |
| CB-839 (250nM) | Selleck Chem | Cat# S7655 |
| Trolox (50μM) | Acros Organics | Cat# AC218940010 |
| N-acetyl-L-cysteine (0.5mM) | Acros Organics | Cat# 160280250 |
| Hypoxanthine (20μM) | Acros Organics | Cat# 122010250 |
| Formate (3mM) | Amresco | Cat# K975 |
| Thymidine (16μM) | Sigma Aldrich | Cat# T1895 |
| KI696 (1μM) | Craig Thomas’s Lab | N/A |
| Buthionine sulfoximine (50/100μM) | Sigma Aldrich | Cat# B2515 |
| Dimethyl-fumarate (5μM) | Sigma Aldrich | Cat# 242926 |
| Dimethyl-ketoglutarate (2mM) | Sigma Aldrich | Cat# 349631 |
| Auronafin (0.5μM) | Sigma Aldrich | Cat# A6733 |
| L-Asparaginase | Abcam | Cat# ab73439 |
| PEI Pro | Poly Plus | Cat# 71002-812 |
| Puromycin (3ug/mL) | Fisher Scientific | Cat# AAJ61278ME |
| Hygromycin | Corning | Cat# 30-240-CR |
| [UC13]-D-glucose (11mM) | Cambridge Isotope Laboratories | Cat# CLM-1396 |
| [UC13]-L-glutamine (2mM) | Cambridge Isotope Laboratories | Cat# CLM-1822 |
| [UC13]-L-serine (285μM) | Cambridge Isotope Laboratories | Cat# CLM-1574 |
| [α15N]-L-glutamine (2mM) | Cambridge Isotope Laboratories | Cat# NLM-1016 |
| Norvaline (1.4ug/mL) | Sigma Aldrich | Cat# N7627 |
| O-Methoxyamine hydrochloride (20mg/mL) | Sigma Aldrich | Cat# 33045 |
| Pyridine | Sigma Aldrich | Cat# 270407 |
| N-tert-butyldimethylsilyl-N-Methyltrifluoracetamide with 1% tert-Butyldimethylchlorosilane | Sigma Aldrich | Cat# 375934 |
| RPMI without glucose & amino acids | US Biologicals | Cat# R9010-01 |
| Critical Commercial Assays | ||
| RNeasy mini Kit | Qiagen | Cat# 74106 |
| Cell titer Glo | Promega | Cat# G7572 |
| High Capacity cDNA Reverse Transcription Kit | Applied Biosciences | Cat# 4374967 |
| Experimental Models: Cell Lines | ||
| KrasG12D/+;p53−/−;Keap1+/+ murine lung adenocarcinoma | Papagiannakopoulos Laboratory | Romero et al., 2017 |
| KrasG12D/+;p53−/−;Keap1−/− murine lung adenocarcinoma | Papagiannakopoulos Laboratory | Romero et al., 2017 |
| KrasG12D/+;p53−/− murine lung adenocarcinoma (multiple lines) | Papagiannakopoulos Laboratory | Dimitrova et al., 2016 |
| LKR10/13 (KrasG12D/+;p53+/+;Keap1+/+ or Keap1−/−), murine lung adenocardinoma | Papagiannakopoulos Laboratory | Romero et al., 2017 |
| KrasG12D/+;p53−/− murine pancreatic ductal adenocarcinoma (multiple lines) | Kimmelman Laboratory | N/A |
| H1299 | ATCC | Cat# CRL-5803, RRID:CVCL_0060 |
| H358 | ATCC | Cat# CRL-5807, RRID:CVCL_1559 |
| H1563 | ATCC | Cat# CRL-5875, RRID:CVCL_1475 |
| H2073 | ATCC | Cat# CRL-5918, RRID:CVCL_1521 |
| H1975 | ATCC | Cat# CRL-5908, RRID:CVCL_1511 |
| H1573 | ATCC | Cat# CRL-5877, RRID:CVCL_1478 |
| H1944 | ATCC | Cat# CRL-5907, RRID:CVCL_1508 |
| H2122 | ATCC | Cat# CRL-5985, RRID:CVCL_1531 |
| A549 | ATCC | Cat# CRL-7909, RRID:CVCL_0023 |
| H1355 | ATCC | Cat# CRL-5865, RRID:CVCL_1464 |
| H23 | ATCC | Cat# CRL-5800, RRID:CVCL_1547 |
| H2030 | ATCC | Cat# CRL-5914, RRID:CVCL_1517 |
| Experimental Models: Organisms/Strains | ||
| C57BL/6J | Jackson Laboratory | Cat# JAX:000664, RRID:IMSR_JAX:000664 |
| Oligonucleotides | ||
| Full list of oligos | See Table S1 | N/A |
| Other | ||
| Amino Acid Control Diet | Envigo | Cat# TD.110839 |
| -Serine and Glycine Diet | Envigo | Cat# TD.160752 |
| -Asparagine Diet | Envigo | Cat# TD.180520 |
Highlights.
Keap1 mutations drive non-essential amino acid (NEAA) dependency in cancer
Intracellular glutamate levels dictate cellular ability to survive NEAA deprivation
Restriction of NEAA can suppress Keap1 mutant tumor growth in vivo
Limiting glutamate by glutaminase inhibition enhances response to NEAA deprivation
Context and Significance.
Cancer cells show changes in metabolism that a lot of the current research is trying to exploit for anti-cancer therapies. However, we still understand little about the metabolic differences between common genetic subtypes of cancer. Researchers at the NYU School of Medicine have uncovered a general mechanism by which cancer cells with chronic activation of the antioxidant response become dependent on non-essential amino acids (NEAAs), independently of their tissue of origin, due to low levels of the metabolite glutamate. By restricting NEAA availability, the authors are able to suppress tumor growth in mouse models. These findings reveal a mechanism for NEAA dependency that is applicable to different types of cancers and can also be extended to cancers with low antioxidant response by limiting glutamate availability.
Acknowledgements
We would like to thank Karen Vousden, Richard Possemato, and Michael Pacold for feedback regarding serine metabolism and dietary experiments, Kivanc Birsoy for providing the Slc1a3 cDNA constructs and Seth Parker for help with GC-MS methods and data analysis. We would like to thank Calithera Biosciences for providing CB-839 for in vivo use, Alec Kimmelman for providing the murine pancreatic cancer cell line and Doug Biancur for technical assistance. We would like to thank Craig Thomas (NCI) for providing KI696 and Paul Oberstein for providing L-Asparaginase. T.P. is supported by the National Institute of Health (1K22 CA201088-01; 1R37CA222504-01A1;1R01CA227649-01) and American Cancer Society Research Scholar Grant (RSG-17-200-01 - TBE). S.E.L. was supported by an NIH training grant (5T32HL007151-38). W.L.W is supported by an NIH training grant (T32GM007308). V.I.S. received support from the Swedish Society for Medical Research. We thank the NYU Langone Medical Center Cores and the Animal Resources Facility staff for their support of the animal studies.
Declarations of interests
T.P. Reports grants and consulting fees outside of the submitted work from Dracen Pharmaceuticals, Agios, Bristol Meyers Squib, and Calithera Biosciences.
Footnotes
Publisher's Disclaimer: This is a PDF file of an unedited manuscript that has been accepted for publication. As a service to our customers we are providing this early version of the manuscript. The manuscript will undergo copyediting, typesetting, and review of the resulting proof before it is published in its final form. Please note that during the production process errors may be discovered which could affect the content, and all legal disclaimers that apply to the journal pertain.
References
- Birsoy K, Possemato R, Lorbeer FK, Bayraktar EC, Thiru P, Yucel B, Wang T, Chen WW, Clish CB, and Sabatini DM (2014). Metabolic determinants of cancer cell sensitivity to glucose limitation and biguanides. Nature 508, 108–112. [DOI] [PMC free article] [PubMed] [Google Scholar]
- Briggs KJ, Koivunen P, Cao S, Backus KM, Olenchock BA, Patel H, Zhang Q, Signoretti S, Gerfen GJ, Richardson AL, et al. (2016). Paracrine Induction of HIF by Glutamate in Breast Cancer: EglN1 Senses Cysteine. Cell 166, 126–139. [DOI] [PMC free article] [PubMed] [Google Scholar]
- Cancer Genome Atlas Research, N. (2012). Comprehensive genomic characterization of squamous cell lung cancers. Nature 489, 519–525. [DOI] [PMC free article] [PubMed] [Google Scholar]
- Cancer Genome Atlas Research, N. (2014). Comprehensive molecular profiling of lung adenocarcinoma. Nature 511, 543–550. [DOI] [PMC free article] [PubMed] [Google Scholar]
- Cronin KA, Lake AJ, Scott S, Sherman RL, Noone AM, Howlader N, Henley SJ, Anderson RN, Firth AU, Ma J, et al. (2018). Annual Report to the Nation on the Status of Cancer, part I: National cancer statistics. Cancer 124, 2785–2800. [DOI] [PMC free article] [PubMed] [Google Scholar]
- Cuadrado A, Rojo AI, Wells G, Hayes JD, Cousin SP, Rumsey WL, Attucks OC, Franklin S, Levonen AL, Kensler TW, et al. (2019). Therapeutic targeting of the NRF2 and KEAP1 partnership in chronic diseases. Nat Rev Drug Discov 18, 295–317. [DOI] [PubMed] [Google Scholar]
- Davidson SM, Papagiannakopoulos T, Olenchock BA, Heyman JE, Keibler MA, Luengo A, Bauer MR, Jha AK, O’Brien JP, Pierce KA, et al. (2016). Environment Impacts the Metabolic Dependencies of Ras-Driven Non-Small Cell Lung Cancer. Cell Metab 23, 517–528. [DOI] [PMC free article] [PubMed] [Google Scholar]
- Davies TG, Wixted WE, Coyle JE, Griffiths-Jones C, Hearn K, McMenamin R, Norton D,Rich SJ, Richardson C, Saxty G, et al. (2016). Monoacidic Inhibitors of the Kelch-like ECH-Associated Protein 1: Nuclear Factor Erythroid 2-Related Factor 2 (KEAP1:NRF2) Protein-Protein Interaction with High Cell Potency Identified by Fragment-Based Discovery. Journal of medicinal chemistry 59, 3991–4006. [DOI] [PubMed] [Google Scholar]
- DeBerardinis RJ, Mancuso A, Daikhin E, Nissim I, Yudkoff M, Wehrli S, and Thompson CB (2007). Beyond aerobic glycolysis: transformed cells can engage in glutamine metabolism that exceeds the requirement for protein and nucleotide synthesis. Proc Natl Acad Sci U S A 104, 19345–19350. [DOI] [PMC free article] [PubMed] [Google Scholar]
- DeNicola GM, and Cantley LC (2015). Cancer’s Fuel Choice: New Flavors for a Picky Eater. Molecular cell 60, 514–523. [DOI] [PMC free article] [PubMed] [Google Scholar]
- DeNicola GM, Chen PH, Mullarky E, Sudderth JA, Hu Z, Wu D, Tang H, Xie Y, Asara JM, Huffman KE, et al. (2015). NRF2 regulates serine biosynthesis in non-small cell lung cancer. Nat Genet 47, 1475–1481. [DOI] [PMC free article] [PubMed] [Google Scholar]
- DeNicola GM, Karreth FA, Humpton TJ, Gopinathan A, Wei C, Frese K, Mangal D, Yu KH, Yeo CJ, Calhoun ES, et al. (2011). Oncogene-induced Nrf2 transcription promotes ROS detoxification and tumorigenesis. Nature 475, 106. [DOI] [PMC free article] [PubMed] [Google Scholar]
- Diehl FF, Lewis CA, Fiske BP, and Vander Heiden MG (2019). Cellular redox state constrains serine synthesis and nucleotide production to impact cell proliferation. Nature Metabolism 1, 861–867. [DOI] [PMC free article] [PubMed] [Google Scholar]
- Dimitrova N, Gocheva V, Bhutkar A, Resnick R, Jong RM, Miller KM, Bendor J, and Jacks T (2016). Stromal Expression of miR-143/145 Promotes Neoangiogenesis in Lung Cancer Development. Cancer Discov 6, 188–201. [DOI] [PMC free article] [PubMed] [Google Scholar]
- Dixon SJ, Patel DN, Welsch M, Skouta R, Lee ED, Hayano M, Thomas AG, Gleason CE, Tatonetti NP, Slusher BS, et al. (2014). Pharmacological inhibition of cysteine-glutamate exchange induces endoplasmic reticulum stress and ferroptosis. Elife 3, e02523. [DOI] [PMC free article] [PubMed] [Google Scholar]
- Elia I, Broekaert D, Christen S, Boon R, Radaelli E, Orth MF, Verfaillie C, Grunewald TGP, and Fendt SM (2017). Proline metabolism supports metastasis formation and could be inhibited to selectively target metastasizing cancer cells. Nat Commun 8, 15267. [DOI] [PMC free article] [PubMed] [Google Scholar]
- Fernandez CA, Des Rosiers C, Previs SF, David F, and Brunengraber H (1996). Correction of 13C mass isotopomer distributions for natural stable isotope abundance. Journal of mass spectrometry : JMS 31, 255–262. [DOI] [PubMed] [Google Scholar]
- Fox DB, Lupo R, Noteware LC, Newcomb R, Liu J, Locasale JW, Hirschey MD, and Alvarez JV (2019). NRF2-dependent metabolic reprogramming is required for tumor recurrence following oncogene inhibition. bioRxiv, 513994. [Google Scholar]
- Gao X, Sanderson SM, Dai Z, Reid MA, Cooper DE, Lu M, Richie JP Jr., Ciccarella A, Calcagnotto A, Mikhael PG, et al. (2019). Dietary methionine influences therapy in mouse cancer models and alters human metabolism. Nature 572, 397–401. [DOI] [PMC free article] [PubMed] [Google Scholar]
- Garcia-Bermudez J, Baudrier L, La K, Zhu XG, Fidelin J, Sviderskiy VO, Papagiannakopoulos T, Molina H, Snuderl M, Lewis CA, et al. (2018). Aspartate is a limiting metabolite for cancer cell proliferation under hypoxia and in tumours. Nat Cell Biol 20, 775–781. [DOI] [PMC free article] [PubMed] [Google Scholar]
- Griffith OW, and Meister A (1979). Potent and specific inhibition of glutathione synthesis by buthionine sulfoximine (S-n-butyl homocysteine sulfoximine). J Biol Chem 254, 7558–7560. [PubMed] [Google Scholar]
- Gwinn DM, Lee AG, Briones-Martin-Del-Campo M, Conn CS, Simpson DR, Scott AI, Le A, Cowan TM, Ruggero D, and Sweet-Cordero EA (2018). Oncogenic KRAS Regulates Amino Acid Homeostasis and Asparagine Biosynthesis via ATF4 and Alters Sensitivity to L-Asparaginase. Cancer Cell 33, 91–107.e106. [DOI] [PMC free article] [PubMed] [Google Scholar]
- Hanahan D, and Weinberg RA (2011). Hallmarks of cancer: the next generation. Cell 144, 646–674. [DOI] [PubMed] [Google Scholar]
- Heiden MGV, and DeBerardinis RJ (2017). Understanding the intersections between metabolism and cancer biology. Cell 168, 657–669. [DOI] [PMC free article] [PubMed] [Google Scholar]
- Hopkins BD, Pauli C, Du X, Wang DG, Li X, Wu D, Amadiume SC, Goncalves MD, Hodakoski C, Lundquist MR, et al. (2018). Suppression of insulin feedback enhances the efficacy of PI3K inhibitors. Nature 560, 499–503. [DOI] [PMC free article] [PubMed] [Google Scholar]
- Knott SRV, Wagenblast E, Khan S, Kim SY, Soto M, Wagner M, Turgeon MO, Fish L, Erard N, Gable AL, et al. (2018). Asparagine bioavailability governs metastasis in a model of breast cancer. Nature 554, 378–381. [DOI] [PMC free article] [PubMed] [Google Scholar]
- Koppula P, Zhang Y, Shi J, Li W, and Gan B (2017). The glutamate/cystine antiporter SLC7A11/xCT enhances cancer cell dependency on glucose by exporting glutamate. J Biol Chem 292, 14240–14249. [DOI] [PMC free article] [PubMed] [Google Scholar]
- Kovac M, Navas C, Horswell S, Salm M, Bardella C, Rowan A, Stares M, Castro-Giner F, Fisher R, de Bruin EC, et al. (2015). Recurrent chromosomal gains and heterogeneous driver mutations characterise papillary renal cancer evolution. Nat Commun 6, 6336. [DOI] [PMC free article] [PubMed] [Google Scholar]
- Larson SD, Li J, Chung DH, and Evers BM (2007). Molecular mechanisms contributing to glutamine-mediated intestinal cell survival. American journal of physiology. Gastrointestinal and liver physiology 293, G1262–1271. [DOI] [PMC free article] [PubMed] [Google Scholar]
- Lehninger AL, Nelson DL, and Cox MM (2000). Principles of Biochemistry. [Google Scholar]
- Lewis CA, Parker SJ, Fiske BP, McCloskey D, Gui DY, Green CR, Vokes NI, Feist AM, Vander Heiden MG, and Metallo CM (2014). Tracing compartmentalized NADPH metabolism in the cytosol and mitochondria of mammalian cells. Molecular cell 55, 253–263. [DOI] [PMC free article] [PubMed] [Google Scholar]
- Lignitto L, LeBoeuf SE, Homer H, Jiang S, Askenazi M, Karakousi TR, Pass HI, Bhutkar AJ, Tsirigos A, Ueberheide B, et al. (2019). Nrf2 Activation Promotes Lung Cancer Metastasis by Inhibiting the Degradation of Bach1. Cell 178, 316–329.e318. [DOI] [PMC free article] [PubMed] [Google Scholar]
- Loayza-Puch F, Rooijers K, Buil LC, Zijlstra J, Oude Vrielink JF, Lopes R, Ugalde AP, van Breugel P, Hofland I, Wesseling J, et al. (2016). Tumour-specific proline vulnerability uncovered by differential ribosome codon reading. Nature 530, 490–494. [DOI] [PubMed] [Google Scholar]
- Lozoya OA, Martinez-Reyes I, Wang T, Grenet D, Bushel P, Li J, Chandel N, Woychik RP, and Santos JH (2018). Mitochondrial nicotinamide adenine dinucleotide reduced (NADH) oxidation links the tricarboxylic acid (TCA) cycle with methionine metabolism and nuclear DNA methylation. PLoS biology 16, e2005707. [DOI] [PMC free article] [PubMed] [Google Scholar]
- Maddocks OD, Berkers CR, Mason SM, Zheng L, Blyth K, Gottlieb E, and Vousden KH (2013). Serine starvation induces stress and p53-dependent metabolic remodelling in cancer cells. Nature 493, 542–546. [DOI] [PMC free article] [PubMed] [Google Scholar]
- Maddocks ODK, Athineos D, Cheung EC, Lee P, Zhang T, van den Broek NJF, Mackay GM, Labuschagne CF, Gay D, Kruiswijk F, et al. (2017). Modulating the therapeutic response of tumours to dietary serine and glycine starvation. Nature 544, 372–376. [DOI] [PubMed] [Google Scholar]
- Martinez-Reyes I, Diebold LP, Kong H, Schieber M, Huang H, Hensley CT, Mehta MM, Wang T, Santos JH, Woychik R, et al. (2016). TCA Cycle and Mitochondrial Membrane Potential Are Necessary for Diverse Biological Functions. Molecular cell 61, 199–209. [DOI] [PMC free article] [PubMed] [Google Scholar]
- Mehrmohamadi M, and Locasale JW (2015). Context dependent utilization of serine in cancer. Molecular & cellular oncology 2, e996418. [DOI] [PMC free article] [PubMed] [Google Scholar]
- Meylan E, Dooley AL, Feldser DM, Shen L, Turk E, Ouyang C, and Jacks T (2009). Requirement for NF-kappaB signalling in a mouse model of lung adenocarcinoma. Nature 462, 104–107. [DOI] [PMC free article] [PubMed] [Google Scholar]
- Mitsuishi Y, Taguchi K, Kawatani Y, Shibata T, Nukiwa T, Aburatani H, Yamamoto M, and Motohashi H (2012). Nrf2 redirects glucose and glutamine into anabolic pathways in metabolic reprogramming. Cancer Cell 22, 66–79. [DOI] [PubMed] [Google Scholar]
- Muir A, Danai LV, Gui DY, Waingarten CY, Lewis CA, and Vander Heiden MG (2017). Environmental cystine drives glutamine anaplerosis and sensitizes cancer cells to glutaminase inhibition. Elife 6. [DOI] [PMC free article] [PubMed] [Google Scholar]
- Nicklin P, Bergman P, Zhang B, Triantafellow E, Wang H, Nyfeler B, Yang H, Hild M, Kung C, Wilson C, et al. (2009). Bidirectional transport of amino acids regulates mTOR and autophagy. Cell 136, 52–534. [DOI] [PMC free article] [PubMed] [Google Scholar]
- Reid MA, Allen AE, Liu S, Liberti MV, Liu P, Liu X, Dai Z, Gao X, Wang Q, Liu Y, et al. (2018). Serine synthesis through PHGDH coordinates nucleotide levels by maintaining central carbon metabolism. Nat Commun 9, 5442. [DOI] [PMC free article] [PubMed] [Google Scholar]
- Rhoads JM, Argenzio RA, Chen W, Rippe RA, Westwick JK, Cox AD, Berschneider HM, and Brenner DA (1997). L-glutamine stimulates intestinal cell proliferation and activates mitogen-activated protein kinases. The American journal of physiology 272, G943–953. [DOI] [PubMed] [Google Scholar]
- Richards NG, and Kilberg MS (2006). Asparagine synthetase chemotherapy. Annu Rev Biochem 75, 629–654. [DOI] [PMC free article] [PubMed] [Google Scholar]
- Romero R, Sayin VI, Davidson SM, Bauer MR, Singh SX, LeBoeuf SE, Karakousi TR, Ellis DC, Bhutkar A, Sanchez-Rivera FJ, et al. (2017). Keap1 loss promotes Kras-driven lung cancer and results in dependence on glutaminolysis. Nat Med 23, 1362–1368. [DOI] [PMC free article] [PubMed] [Google Scholar]
- Santidrian AF, LeBoeuf SE, Wold ED, Ritland M, Forsyth JS, and Felding BH (2014). Nicotinamide phosphoribosyltransferase can affect metastatic activity and cell adhesive functions by regulating integrins in breast cancer. DNA repair 23, 79–87. [DOI] [PMC free article] [PubMed] [Google Scholar]
- Sayin VI, LeBoeuf SE, Singh SX, Davidson SM, Biancur D, Guzelhan BS, Alvarez SW, Wu WL, Karakousi TR, Zavitsanou AM, et al. (2017). Activation of the NRF2 antioxidant program generates an imbalance in central carbon metabolism in cancer. Elife 6. [DOI] [PMC free article] [PubMed] [Google Scholar]
- Shin CS, Mishra P, Watrous JD, Carelli V, D’Aurelio M, Jain M, and Chan DC (2017). The glutamate/cystine xCT antiporter antagonizes glutamine metabolism and reduces nutrient flexibility. Nat Commun 8, 15074. [DOI] [PMC free article] [PubMed] [Google Scholar]
- Sousa CM, Biancur DE, Wang X, Halbrook CJ, Sherman MH, Zhang L, Kremer D, Hwang RF, Witkiewicz AK, Ying H, et al. (2016). Pancreatic stellate cells support tumour metabolism through autophagic alanine secretion. Nature 536, 479–483. [DOI] [PMC free article] [PubMed] [Google Scholar]
- Storck T, Schulte S, Hofmann K, and Stoffel W (1992). Structure, expression, and functional analysis of a Na(+)-dependent glutamate/aspartate transporter from rat brain. Proc Natl Acad Sci U S A 89, 10955–10959. [DOI] [PMC free article] [PubMed] [Google Scholar]
- Sullivan LB, Luengo A, Danai LV, Bush LN, Diehl FF, Hosios AM, Lau AN, Elmiligy S, Malstrom S, Lewis CA, et al. (2018). Aspartate is an endogenous metabolic limitation for tumour growth. Nature Cell Biology 20, 782–788. [DOI] [PMC free article] [PubMed] [Google Scholar]
- Tsun ZY, and Possemato R (2015). Amino acid management in cancer. Semin Cell Dev Biol 43, 22–32. [DOI] [PMC free article] [PubMed] [Google Scholar]
- Umbarger HE (1978). Amino acid biosynthesis and its regulation. Annu Rev Biochem 47, 532–606. [DOI] [PubMed] [Google Scholar]
- Urig S, and Becker K (2006). On the potential of thioredoxin reductase inhibitors for cancer therapy. Seminars in cancer biology 16, 452–465. [DOI] [PubMed] [Google Scholar]
- Vander Heiden MG, Cantley LC, and Thompson CB (2009). Understanding the Warburg effect: the metabolic requirements of cell proliferation. Science (New York, N.Y.) 324, 1029–1033. [DOI] [PMC free article] [PubMed] [Google Scholar]
- Wang Q, Chuikov S, Taitano S, Wu Q, Rastogi A, Tuck SJ, Corey JM, Lundy SK, and Mao-Draayer Y (2015). Dimethyl Fumarate Protects Neural Stem/Progenitor Cells and Neurons from Oxidative Damage through Nrf2-ERK1/2 MAPK Pathway. International Journal of Molecular Sciences 16, 13885–13907. [DOI] [PMC free article] [PubMed] [Google Scholar]
- Watanabe H, and Bannai S (1987). Induction of cystine transport activity in mouse peritoneal macrophages. The Journal of experimental medicine 165, 628–640. [DOI] [PMC free article] [PubMed] [Google Scholar]
- Wheaton WW, Weinberg SE, Hamanaka RB, Soberanes S, Sullivan LB, Anso E, Glasauer A, Dufour E, Mutlu GM, Budigner GS, et al. (2014). Metformin inhibits mitochondrial complex I of cancer cells to reduce tumorigenesis. Elife 3, e02242. [DOI] [PMC free article] [PubMed] [Google Scholar]
- Yagi T, Seo BB, Nakamaru-Ogiso E, Marella M, Barber-Singh J, Yamashita T, Kao MC, and Matsuno-Yagi A (2006). Can a single subunit yeast NADH dehydrogenase (Ndi1) remedy diseases caused by respiratory complex I defects? Rejuvenation research 9, 191–197. [DOI] [PubMed] [Google Scholar]
- Yang M, and Vousden KH (2016). Serine and one-carbon metabolism in cancer. Nat Rev Cancer 16, 650–662. [DOI] [PubMed] [Google Scholar]
Associated Data
This section collects any data citations, data availability statements, or supplementary materials included in this article.
Supplementary Materials
Data Availability Statement
This study did not generate any unique datasets or code.