

Abstract
Mammalian Peptidoglycan Recognition Proteins (PGRPs) kill bacteria through induction of synergistic oxidative, thiol, and metal stress. PGRPs induce oxidative stress in bacteria through a block in the respiratory chain, which results in decreased respiration and incomplete reduction of oxygen (O2) to hydrogen peroxide (H2O2). In this study we identify the site of PGRP-induced generation of H2O2 in Escherichia coli. Tn-seq screening of E. coli Tn10 insertion library revealed that mutants in formate dehydrogenase (FDH) genes had the highest survival following PGRP treatment. Mutants lacking functional FDH-O had abolished PGRP-induced H2O2 production and the highest resistance to PGRP-induced killing, and formate enhanced PGRP-induced killing and H2O2 production in an FDH-dependent manner. Mutants in ubiquinone synthesis (but not menaquinone and demethylmenaquinone) and cytochrome bd-I (but not cytochromes bo3 and bd-II) also had completely abolished PGRP-induced H2O2 production and high resistance to PGRP-induced killing. Because electrons in the respiratory chain flow from dehydrogenases’ substrates through quinones and then cytochromes to O2, these results imply that the site of PGRP-induced incomplete reduction of O2 to H2O2 is downstream from dehydrogenases and ubiquinone at the level of cytochrome bd-I, which results in oxidative stress. These results reveal several essential steps in PGRP-induced bacterial killing.
Subject terms: Antimicrobial responses, Bacteriology
Introduction
Peptidoglycan Recognition Proteins (PGRPs) are evolutionarily conserved and function in antibacterial innate immunity1,2. Mammals have four PGRPs coded by PGLYRP1-4 genes. PGLYRP1, PGLYRP3, and PGLYRP4 are directly bactericidal for both Gram-positive and Gram-negative bacteria3–6, whereas PGLYRP2 is an enzyme, peptidoglycan amidohydrolase7,8. All PGRPs have one or two conserved PGRP domains, which bind muramyl-peptide fragments of bacterial peptidoglycan1,2. Mammalian PGRPs also bind bacterial lipopolysaccharide (LPS) with a binding site located outside the peptidoglycan-binding groove5,9.
Bacterial killing by PGRPs requires binding of PGRP to peptidoglycan in Gram-positive bacteria or to the outer membrane in Gram-negative bacteria10. However, PGRPs do not enter the cytoplasm and exert bacterial killing from this extracellular site by simultaneously inducing three severe stress responses in bacteria: oxidative stress, thiol stress, and metal stress10,11. Simultaneous induction of all three stress responses is required for efficient PGRP-induced bacterial killing, because: (i) each stress response is required for PGRP-induced killing but individually each stress response is only bacteriostatic, but not bactericidal; and (ii) bacterial killing can be recapitulated by the simultaneous treatment of bacteria with paraquat (which induces H2O2 production), diamide (which depletes thiols), and metals (which increase intracellular metal concentrations)11.
Oxidative stress induced by PGRP in bacteria is due to increased production of hydrogen peroxide (H2O2) and hydroxyl radicals (HO•), which result in high induction of oxidative stress response genes, including OxyR and SoxR regulons in Escherichia coli and PerR regulon in Bacillus subtilis10,11. Production of H2O2 and HO• is required for PGRP-induced killing, because: (i) under anaerobic conditions, when H2O2 and HO• are not produced, PGRPs are only bacteriostatic, but not bactericidal11; (ii) inhibition of HO• production by dipyridyl inhibits PGRP-induced bacterial killing10; (iii) ΔrecA E. coli mutants (deficient in DNA repair) and Hpx- E. coli and B. subtilis mutants (deficient in catalases and hydroxyperoxidases), known to be highly sensitive to H2O2 and HO•, are also more sensitive to PGRP-induced killing11; and (iv) E. coli mutants deficient in PGRP-induced H2O2 production are resistant to PGRP-induced killing12.
PGRP-induced thiol (disulfide) stress in both E. coli and B. subtilis is due to depletion of over 90% of intracellular thiols, which results in a great increase in the expression of thiol stress response genes, including many genes for chaperones and protein quality control11. PGRP-induced depletion of thiols is required for PGRP-induced killing, because thiourea (which protects against thiol depletion) diminishes PGRP-induced bacterial killing10,11. PGRP-induced metal stress is due to increases in intracellular free (labile) Zn2+ in E. coli and both Zn2+ and Cu+ in B. subtilis, which result in a great increase in the expression of metal efflux and metal detoxification genes11. PGRP-induced metal stress is also required for PGRP-induced killing of bacteria, because selective chelation of Zn2+ or Cu+ completely abolishes PGRP killing in both E. coli and B. subtilis6,11. However, PGRP-induced oxidative, thiol, and metal stress are mostly independent of each other12.
We recently discovered that bactericidal PGRP induces oxidative stress through a block in the respiratory chain, which results in a decrease in respiration and increased generation of H2O2, possibly due to premature diversion of electrons to O212. This PGRP-induced production of H2O2 in E. coli depended on the increased supply of NADH from cAMP-Crp-controlled glycolysis and TCA cycle, and on oxidation of NADH to NAD+ by both NADH dehydrogenases, NDH-1 and NDH-212. This conclusion was based on: (i) increased resistance to PGRP-induced killing and inability of PGRP to induce increased production of H2O2 in several deletion mutants for the components of this pathway, including Δnuo (NDH-1 deficient), Δndh (NDH-2 deficient), several TCA-cycle enzymes (ΔsucB, ΔsucD, Δicd, ΔsdhD, and ΔlpdA), and Δcrp and ΔcyaA (deficient in the cAMP-Crp regulator of TCA cycle and central carbon catabolism); (ii) correlated PGRP-induced increase in the expression of cAMP-Crp-controlled genes for central carbon catabolism and respiratory oxidoreductases; and (iii) correlated PGRP-induced increases in NADH, phosphoenolpyruvate, and cAMP in wild-type cells but not in the above PGRP-resistant mutants12. These results indicated that the PGRP-induced block in the respiratory chain and the site of generation of H2O2 occurred at or down-stream from NDH-1 and NDH-2. However, the exact location of this block and the site of production of H2O2 remained unknown.
The respiratory chain of E. coli is very complex and contains at least 15 dehydrogenases that can deliver electrons to 3 different quinones, and at least 14 terminal reductases that can deliver electrons to at least 8 different electron acceptors, including 3 cytochromes (bo3, bd-I, and bd-II), which deliver electrons to O213,14. Therefore, in this study we used Tn-seq and targeted mutations to further identify which components of the respiratory chain participate in PGRP-induced killing of E. coli and to identify the site in the respiratory chain responsible for PGRP-induced H2O2 production and killing. Our results show that formate dehydrogenases (FDH), and especially FDH-O, are required for PGRP-induced production of H2O2 and killing in E. coli, in addition to the previously identified requirement for NDH-1 and NDH-212. Our results further show that ubiquinone and cytochrome bd-I are also required for PGRP-induced killing, and that the site of PGRP-induced H2O2 production in the respiratory chain is downstream from FDH-O, NDH-1, NDH-2, and ubiquinone at the level of cytochrome bd-I.
Results
Tn-seq identifies formate dehydrogenase mutants with increased survival in PGRP-treated cultures
We used a highly saturated mini-Tn10 insertion library in E. coli MG1655 containing ~200,000 unique mutants, with each mutant containing one transposon randomly inserted into the chromosome15. The library was exposed for 3 hrs to BSA as a control or to a bactericidal concentration of PGRP that reduced the numbers of viable bacteria in 3 hrs by >99%, or to a sub-bactericidal (bacteriostatic) concentration of PGRP that reduced viable bacteria in 3 hrs by 50%. We selected 3 hrs for the assay to allow for the selection of mutants resistant to PGRP killing and the depletion of mutants more sensitive to PGRP killing. We used human recombinant PGLYRP4 as a representative bactericidal PGRP, as we have previously shown that all human bactericidal PGRPs had similar activity and mechanism of bacterial killing4,6,10,11. We used BSA-treated bacteria as a control (rather than the initial inoculum) to eliminate any possible differences in the frequencies of mutants that could be due to different growth rates of mutants during the 3-hr incubation period. We plated surviving bacteria for single colonies and identified mutated genes by Illumina Hi-seq. For each gene we calculated the survival index (SI), which reflects a change in the frequency of each Tn insertion mutant in PGRP-treated versus control (BSA) cultures. A neutral mutation with no effect on survival in the presence of PGRP has SI = 1, whereas SI > 1 denotes mutation that makes bacteria more resistant to PGRP (indicating that the product of the gene enhances PGRP killing), and SI < 1 denotes mutation that makes bacteria more sensitive to PGRP (indicating that the product of the gene protects bacteria from PGRP killing). In this study, we focused on the mutants with significantly increased SI to identify genes that participate in PGRP-induced killing.
Five out of the top six Tn-seq mutants with the most increased frequency in the Tn-seq library treated with bactericidal concentration of PGRP were in formate dehydrogenase (FDH) genes or in genes required for the assembly and activity of formate dehydrogenases (Figs. 1 and S1). The frequency of 11 Tn-seq mutants in formate dehydrogenases or in genes required for the assembly and activity of formate dehydrogenases was also significantly increased in bacteria treated with the bacteriostatic concentration of PGRP (Fig. 1).
Figure 1.

Tn-seq identifies association of formate dehydrogenase genes with PGRP-induced killing in E. coli. Tn10 insertion library was treated for 3 hrs with BSA as control or with PGRP at bactericidal (<1% survival) or sub-bactericidal (50% survival) concentration, and the survival index (SI) with PGRP, relative to BSA, for individual Tn-mutants was determined by Tn-seq. The results are means from 3 independent experiments (biological replicates) and each dot represents a single gene deletion mutant. The Tn insertion sites and the numbers of reads for the representative top FDH genes are shown in Supplementary Fig. S1. The complete Tn-seq results have been deposited in NCBI SRA with accession number PRJNA549505 (https://www.ncbi.nlm.nih.gov/sra/PRJNA549505).
E. coli has two respiratory formate dehydrogenases, FDH-O and FDH-N (coded by fdoGHI and fdnGHI, respectively), which transfer electrons from formate to the quinone pool in the respiratory chain. E. coli also has a third formate dehydrogenase, FDH-H (coded by fdhF), which is a subunit of formate hydrogenlyase, an enzyme complex that disproportionates formate to H2 and CO213,16,17. All three FDH contain selenocysteine coordinated to molybdenum of molybdopterin guanine dinucleotide cofactor, which are both required for the FDH enzymatic activity. The mutants with increased frequency in PGRP-treated cultures were for the following genes (Fig. 1): fdhE (formate dehydrogenase formation protein required for the activity of FDH-O and FDH-N), fdhD (sulfurtransferase for molybdenum cofactor sulfuration required for the activity of FDH-O, FDH-N, and FDH-H), fdoG (catalytic α subunit of FDH-O), fdoH (β subunit of FDH-O), modA (molybdate ABC transporter periplasmic binding protein), modC (ATP-binding component of ABC transporter for high affinity uptake of molybdate), mog (molybdopterin adenylyltransferase), moaA (GTP 3′8′-cyclase in the synthesis of molybdopterin guanine dinucleotide), moaE (molybdopterin synthase catalytic subunit), focA (bidirectional formate channel), selA (selenocysteine synthase), selB (selenocysteinyl-tRNA-specific translation factor), and frc (formyl-CoA transferase).
Formate dehydrogenase is required for PGRP-induced killing and H2O2 production
Increased frequency of Tn mutants in FDH genes and other genes required for the activity of FDH in PGRP-treated cultures suggested that FDH may participate in PGRP-induced killing of E. coli. To test this hypothesis and to identify which FDH participate in PGRP-induced killing, we constructed deletion mutants in key FDH genes or genes required for FDH activity and tested their sensitivity to PGRP-induced killing.
Mutants lacking FDH-O, FDH-N, and FDH-H (ΔfdhD), or FDH-O and FDH-N (ΔfdhE), or FDH-O (ΔfdoG) had significantly increased survival after 3-hr PGRP treatment compared with the parental MG1655 strain (with 51-, 66-, or 50-fold higher numbers of colonies, respectively) (Fig. 2a). Mutants lacking FDH-N (ΔfdnG), or FDH-H (ΔfdhF), or formate channel (ΔfocA) also had significantly increased survival after 3-hr PGRP treatment, but much lower than the FDH-O mutants (7-, 18-, or 18-fold higher numbers of colonies than parental MG1655 strain, respectively) (Fig. 2a). Mutants lacking molybdopterin molybdenum transferase (ΔmoeA), or molybdate transporter subunit (ΔmodA), or molybdochelatase (Δmog), or selenocysteinyl-tRNA-specific translation factor (ΔselB), which are all required for the activity of all FDH, also had significantly increased survival after 3-hr PGRP treatment (30-, 48-, 40-, or 26-fold higher numbers of colonies than parental MG1655 strain, respectively) (Fig. 2a).
Figure 2.

Deletion of genes for formate dehydrogenases (FDH) or genes required for the assembly and activity of FDH increases resistance of E. coli to PGRP-induced killing. Parental E. coli MG1655 (a) and BW25113 (b), or the indicated deletion mutants, were treated with BSA or PGRP for 3 hrs and the numbers of surviving bacteria were determined by colony counts. The results are expressed as percent of initial inoculum (100%) and are means ± SEM from 3 to 4 experiments (biological replicates); ^P < 0.05, ^^P < 0.001 mutant vs parental strain.
We further confirmed the requirement for formate dehydrogenases in PGRP-induced killing by showing increased resistance to PGRP killing of ΔfdhD, ΔfdhE, ΔfdoG, ΔfdnG, ΔfdhF, ΔfocA, ΔmoeA, ΔmodA, Δmog, ΔmoaE, and ΔselB deletion mutants in another strain of E. coli, BW25113 (Fig. 2b). These results indicate that FDH-O is required for PGRP-induced killing, and that FDH-N and FDH-H have a small, but still significant contribution.
We next hypothesized that formate may be a significant electron donor for the respiratory chain required for PGRP-induced H2O2 production and that formate dehydrogenases are required for PGRP-induced H2O2 production, because: (i) increased H2O2 production is required for PGRP-induced killing11; (ii) FDH transfer electrons from formate to the quinone pool in the respiratory chain13,16; and (iii) a block in the electron transfer through the respiratory chain was previously identified as a source of PGRP-induced H2O212.
Deleting FDH-O, FDH-N, and FDH-H (ΔfdhD), or FDH-O and FDH-N (ΔfdhE), or FDH-O (ΔfdoG) completely abolished PGRP-induced H2O2 production, whereas mutants lacking FDH-N (ΔfdnG) or formate channel (ΔfocA) had still significant PGRP-induced H2O2 production, although lower than the parental MG1655 strain. ΔfdhF mutant lacking FDH-H (which does not directly contribute electrons to the respiratory chain) produced similar amounts of H2O2 in response to PGRP as the parental MG1655 strain (Fig. 3a). Mutants lacking molybdopterin molybdenum transferase (ΔmoeA), or molybdate transporter subunit (ΔmodA), or molybdochelatase (Δmog), or selenocysteinyl-tRNA-specific translation factor (ΔselB) also did not produce H2O2 in response to PGRP.
Figure 3.

Deletion of FDH-O or genes required for FDH-O assembly and activity abolishes PGRP-induced production of H2O2 in E. coli. Parental strains MG1655 (a) and BW25113 (b), or the indicated deletion mutants, were treated with BSA, PGRP, or paraquat for 15 min and the total amounts of H2O2 were determined. The results are means ± SEM from 3 experiments (biological replicates); *P < 0.05, **P < 0.001 PGRP or paraquat vs BSA; #P < 0.05 paraquat vs PGRP; ^P < 0.05, ^^P < 0.001 mutant vs parental strain.
We further confirmed the requirement for FDH-O in PGRP-induced H2O2 production by showing no increase in PGRP-induced H2O2 production in ΔfdhD, ΔfdhE, ΔfdoG, ΔmoeA, ΔmodA, Δmog, ΔmoaE, and ΔselB deletion mutants in E. coli BW25113 (Fig. 3b). Formate channel ΔfocA BW25113 mutant behaved similarly to the ΔfocA MG1655 mutant and showed significant, but lesser contribution, and FDH-N ΔfdnG and FDH-H ΔfdhF BW25113 mutants showed only smaller and variable contribution of FDH-N and FDH-H to PGRP-induced H2O2 production (Fig. 3b). Altogether, these results in MG1655 and BW25113 strains consistently indicate that FDH-O is required for PGRP-induced H2O2 production, whereas FDH-N and FDH-H have small and variable contributions.
The requirement for FDH-O in H2O2 production was selective for PGRP, because paraquat induced significant increases in H2O2 in both parental strains and all the mutants with non-functional FDH enzymes (Fig. 3). These results indicate that formate dehydrogenases are not required for generation of H2O2 by paraquat and are consistent with the known mechanism of H2O2 generation by paraquat, in which paraquat is reduced by respiratory NADH dehydrogenase to a radical cation, which then reacts with O218,19.
To further determine the role of FDH in PGRP-induced killing and H2O2 production, we tested the hypothesis that adding exogenous formate should enhance PGRP-induced killing and H2O2 production. As predicted, adding 0.25 mM sodium formate significantly increased PGRP-induced killing and H2O2 production in E. coli MG1655 parental strain, but not in ΔfdhD, ΔfdhE, ΔfdoG mutants, showing that this effect of formate was dependent on FDH-O (Fig. 4). Exogenous formate had no effect on the bacterial viability and H2O2 concentrations in BSA-treated cultures showing the selectivity of the effect of formate in PGRP-treated cells.
Figure 4.

Exogenous formate enhances PGRP-induced killing and H2O2 production in E. coli and this enhancement is FDH-dependent. 0.25 mM sodium formate was added as indicated to the cultures of the parental strain MG1655 or FDH deletion mutants that were treated with BSA or PGRP and assayed for viability by colony counts after 3 hrs (a) or total amounts of H2O2 after 15 min (b) of incubation. The results are means ± SEM from 3 experiments (biological replicates); *P < 0.05, **P < 0.001 PGRP vs BSA; ^P < 0.05, ^^P < 0.001 mutant vs parental strain; #P < 0.05 without vs with formate; NS P > 0.05.
To verify the presence of FDH-O, FDH-N, and FDH-H, we compared the expression of these FDH and other genes required for FDH assembly and activity in control and PGRP-treated cells. We analyzed whole genome expression arrays in BSA- (control) and PGRP-treated E. coli, which we previously deposited in NCBI GEO (accession number GSE44211) and at that time analyzed for the oxidative, thiol, and metal stress response genes11, but not for FDH-related genes. Control (BSA-treated) cells had high expression of fdhD and fdhE (required for the activity of FDH-O, FDH-N, and FDH-H, or FDH-O and FDH-N, respectively), fdoG, fdoH, and fdoI (coding for FDH-O subunits), and many genes required for the synthesis of the molybdopterin guanine dinucleotide cofactor and selenocysteine (required for the activity of all three FDH enzymes) (Supplementary Fig. S2). Control cells had low expression of FDH-N (fdnG, fdnH, and fdnI) and FDH-H (fdhF) genes. PGRP treatment significantly increased the expression of fdoG, fdoH, fdoI, fdnH, and fdnI, and also of several molybdopterin and selenocysteine synthesis genes (Supplementary Fig. S2). These results are consistent with aerobic expression of FDH-O16 and our results showing its role in PGRP-induced killing and H2O2 production, and also show that expression of FDH-N can be induced aerobically in PGRP-treated cells, consistent with partial contribution of FDH-N to PGRP-induced killing.
Ubiquinone is required for PGRP-induced killing and H2O2 production
FDH-O and FDH-N transfer electrons from formate to the quinone pool in the cytoplasmic membrane, and these electrons are then transferred from quinones to the cytochromes, which in the presence of oxygen are the terminal oxygen reductases that reduce O2 to H2O. The requirement for FDH-O in PGRP-induced H2O2 production (Fig. 3) and simultaneous PGRP-induced decrease in O2 consumption12 indicated a block in the respiratory chain and either premature diversion of electrons from the respiratory chain or its malfunction, leading to incomplete reduction of O2 to H2O2. This PGRP-induced block in electron transfer and incomplete reduction of O2 to H2O2 could occur at the level of dehydrogenases (FDH and/or NDH), quinones, or cytochromes. If the diversion of electrons occurred from the dehydrogenases and not from quinones (located downstream in the electron transfer chain), deleting quinones should not abolish the PGRP-induced H2O2 production. But if the diversion of electrons occurred at the level of quinones or downstream from quinones, deleting quinones should abolish or decrease PGRP-induced H2O2 production. To discriminate between these possibilities and to identify which quinones (if any) are involved in PGRP-induced H2O2 production and PGRP-induced killing, we next tested the PGRP-induced killing and H2O2 production in quinone deletion mutants.
E. coli has 3 quinones: ubiquinone (UQ), menaquinone (MK), and demethylmenaquinone (DMK), which differ in their redox potential and thus affinity for electrons20. We constructed mutants deficient in the synthesis of UQ, MK, and DMK in both MG1655 and BW25113 strains and tested their sensitivity to PGRP-induced killing and H2O2 production. Mutants deficient in the synthesis of UQ (ΔubiCA) or UQ and MK (ΔubiE) had significantly increased survival after 3-hr PGRP treatment (with 65- and 72-fold higher numbers of colonies than in the parental MG1655 strain, and 111- and 77-fold higher in BW25113 strain, respectively) (Fig. 5a). By contrast, mutants deficient in the synthesis of both MK and DMK (ΔmenA) had unchanged survival, compared with the parental MG1655 and BW25113 strains (Fig. 5a). Thus, UQ, but not MK and DMK, is required for PGRP-induced killing.
Figure 5.

Deletion of ubiquinone (UQ) synthesis genes increases resistance of E. coli to PGRP-induced killing (a) and decreases PGRP-induced H2O2 production (b); and the ratio of oxidized to reduced UQ is increased in PGRP-treated compared with BSA-treated E. coli (c). Parental E. coli and deletion mutants were treated with BSA, PGRP, or paraquat, as indicated. (a) The numbers of surviving bacteria at 3 hrs were determined by colony counts and expressed as percent of initial inoculum (100%). (b) The total amounts of H2O2 at 15 min were determined. The results are means ± SEM from 4 (a) or 6 (b) experiments (biological replicates); *P < 0.05, **P < 0.001, PGRP or paraquat vs BSA; ^P < 0.05, ^^P < 0.001, mutant vs parental strain. (c) The amounts of oxidized and reduced UQ were determined in MG1655 E. coli at time 0 (untreated), and after 15 min of incubation with BSA (control) or PGRP. The results are mean ratios ± SEM of UQ8/UQ8-H2 and UQ9/UQ9-H2 from 4 experiments (biological replicates); #P < 0.05 PGRP vs untreated, *P < 0.05 PGRP vs BSA (paired t-test). The total amounts of UQ + UQ-H2 in untreated, BSA-treated, and PGRP-treated cultures were: 107 ± 5, 161 ± 19, and 149 ± 15 ng/culture for UQ8, and 1.7 ± 0.05, 2.0 ± 0.4, and 2.2 ± 0.2 ng/culture for UQ9, respectively (means ± SEM), with no significant differences between BSA- and PGRP-treated groups.
In mutants lacking UQ (ΔubiCA) or UQ and MK (ΔubiE) PGRP did not induce any H2O2 production, whereas mutants lacking both MK and DMK (ΔmenA) had significant PGRP-induced H2O2 production that did not significantly differ from H2O2 production in the parental strains (Fig. 5b). Mutants lacking UQ (but not MK and DMK) also had similarly abolished H2O2 production in response to paraquat, which shows that UQ is required for paraquat-generated H2O2 production, consistent with the proposed ability of quinones to participate in the redox cycling of paraquat21. Similar results were obtained in mutants independently generated in both MG1655 and BW25113 strains, validating that these effects were indeed due to the deletion of these quinone synthesis genes. These results indicate that UQ (but not MK and DMK) is required for PGRP-induced H2O2 production. Thus, the site of PGRP-induced H2O2 production in the respiratory electron transport chain is at the level of UQ or downstream from UQ.
If ubiquinol (UQ-H2) is the source of electrons for H2O2 production in PGRP-treated cells, the outcome of increased transfer of electrons to O2 should be an increase in oxidized UQ at the time of peak H2O2 production. To test this hypothesis we measured the amounts of oxidized and reduced quinones after 15 min of PGRP treatment, which is the peak of PGRP-induced H2O2 production12. We focused on UQ, because UQ, but not MK and DMK, was required for PGRP-induced H2O2 production and killing (Fig. 5a,b), and because UQ is the main quinone in aerobically growing E. coli20,22. Indeed, we detected a total of approximately 140 ng UQ8, 2.0 ng UQ9, 3.3 ng MK8, and <0.1 ng DMK8 (below the level of detection) per culture (oxidized plus reduced forms).
A 15-min treatment with PGRP resulted in significant increases in both UQ8/UQ8-H2 and UQ9/UQ9-H2 (oxidized/reduced) ratios, compared with untreated and BSA-treated cells, indicating a significant shift from reduced UQ-H2 to oxidized UQ in PGRP-treated cells (Fig. 5c). By contrast, these ratios were similar in untreated and BSA-treated cells. These results are consistent with our hypothesis of increased loss of electrons from reduced UQ-H2 resulting in an increase in the oxidized UQ/reduced UQ-H2 ratio in PGRP-treated cells at the time of the maximum H2O2 production. These electrons could be diverted to O2 directly from UQ-H2 to generate H2O2, or transferred to cytochromes, or both.
To further verify the presence of quinones, we compared the expression of quinone synthesis genes in control and PGRP-treated cells, by analyzing whole genome expression arrays, which we previously deposited in NCBI GEO (accession number GSE44211)11, but did not analyze for quinone synthesis. Control (BSA-treated) cells had high expression of genes for the synthesis of UQ (ubiA, ubiC, and ubiE), and expression of ubiA and ubiC (required for the synthesis of UQ) was further increased by PGRP treatment (Supplementary Fig. S3a). Expression of menA, required for the synthesis of both MK and DMK, was lower and significantly decreased by PGRP treatment. These results are consistent with the dominant role of UQ in PGRP-induced killing and H2O2 production.
Cytochrome bd-I is required for PGRP-induced killing and H2O2 production
Our results showing the requirement for UQ in PGRP-induced killing and H2O2 production motivated us to determine the role of cytochromes in PGRP-induced killing and H2O2 production, because in the respiratory chain UQ-H2 transfers electrons to cytochromes. Thus, we next tested whether the PGRP-induced block in the respiratory chain and the site of incomplete reduction of O2 to H2O2 occurred down-stream from the quinones, i.e., at the cytochromes. E. coli has 3 terminal quinol/oxygen oxidoreductases: cytochromes bo3, bd-I, and bd-II13,14. We constructed mutants deficient in each cytochrome in E. coli MG1655 and tested the sensitivity of cytochrome mutants in both MG1655 and BW25113 strains to PGRP-induced killing and H2O2 production.
Mutants lacking cytochrome bd-I (ΔcydB) had significantly increased survival after 3-hr PGRP treatment (with 92- and 61-fold higher numbers of colonies than in the parental MG1655 and BW25113 strains, respectively) (Fig. 6a). Single deletion mutants lacking cytochrome bo3 (ΔcyoB) or cytochrome bd-II (ΔappB) had significantly lower survival than the ΔcydB mutant, but they still had somewhat higher survival than the parental strains (with 6- and 7-, or 8- and 18-fold higher numbers of colonies than in the parental MG1655 and BW25113 strains, respectively). Double deletion ΔcyoBΔcydB and ΔcyoBΔappB mutants also had significantly increased survival after 3-hr PGRP treatment (with 71- or 7-fold higher numbers of colonies than in the parental MG1655 strain), similar to the survival of the single ΔcydB and ΔcyoB mutants, respectively. These results indicate that cytochrome bd-I is required for PGRP-induced killing, and that cytochromes bo3 and bd-II play a small role.
Figure 6.

Deletion of cytochrome bd-I increases resistance to PGRP-induced killing and abolishes PGRP-induced H2O2 production. Parental E. coli or deletion mutants were treated as indicated. (a) The numbers of surviving bacteria after 3 hrs were determined by colony counts and expressed as percent of initial inoculum (100%). (b) The total amounts of H2O2 after 15 min were measured. The results are means ± SEM from 3 or 4 experiments (biological replicates); *P < 0.05, **P < 0.001, PGRP or paraquat vs BSA; #P < 0.05 paraquat vs PGRP; ^P < 0.05, ^^P < 0.001, mutant vs parental strain.
PGRP-induced H2O2 production was completely abolished in both MG1655 and BW25113 mutants lacking cytochrome bd-I (ΔcydB), and also in double deletion ΔcyoBΔcydB mutant, compared with the parental strains (Fig. 6b). By contrast, PGRP-induced H2O2 production in both MG1655 and BW25113 mutants lacking cytochrome bo3 (ΔcyoB) or cytochrome bd-II (ΔappB), or in a double deletion mutant lacking both cytochromes bo3 and bd-II (ΔcyoBΔappB), were similar to the H2O2 production in the parental strains. These results show that cytochrome bd-I is required for PGRP-induced H2O2 production and that cytochromes bo3 and bd-II are not required. These results imply that the primary site of PGRP-induced production of H2O2 is cytochrome bd-I.
The requirement for cytochrome bd-I in H2O2 production was selective for PGRP, because paraquat induced significant increases in H2O2 in both parental strains and all the cytochrome mutants, including mutants lacking cytochrome bd-I (Fig. 6b). These results indicate no selective requirement for any of the E. coli cytochromes for paraquat-induced H2O2 production (in contrast to PGRP) and are consistent with the known direct reduction of O2 by the paraquat radical cation18,19.
Both double deletion mutants (ΔcyoBΔcydB and ΔcyoBΔappB) had higher H2O2 production in control (BSA-treated) cultures than the parental strain (Fig. 6b), which is consistent with the previous report for the untreated ΔcyoΔcyd mutant23. Because PGRP-induced H2O2 production was completely abolished in ΔcydB and ΔcyoBΔcydB mutants, these results indicate that the main source of PGRP-induced H2O2 is different from the sources of the low-level H2O2 produced in control cells growing without PGRP.
To verify the presence of cytochromes, we compared the expression of cytochrome genes in control and PGRP-treated cells, by analyzing our whole genome expression arrays (NCBI GEO accession number GSE44211)11. Control (BSA-treated) cells had high expression of cytochrome bo3 cyoA-D genes, most of which were further increased by PGRP treatment, and very high expression of cytochrome bd-I cydABX genes. However, the expression of cytochrome bd-I cydA gene was severely decreased by PGRP treatment (Supplementary Fig. S3b). Cytochrome bd-II appB and appC genes had very low expression, which was not changed by PGRP treatment. These results are consistent with the role of cytochrome bd-I in PGRP-induced killing and H2O2 production and suggest that maybe PGRP-treated cells decrease cytochrome bd-I expression as a defense mechanism to limit its contribution to PGRP-induced H2O2 production.
Role of membrane depolarization
We next considered the possibility that PGRP induces membrane depolarization in E. coli because membrane depolarization could be either the cause or the consequence of respiratory chain malfunction, oxidative stress, and decline in respiration, and because we previously showed that PGRP treatment results in membrane depolarization in B. subtilis10. Treatment of E. coli with PGRP for 15 min (the time of maximum PGRP-induced H2O2 production12) resulted in significant, but low-level membrane depolarization, similar to membrane depolarization induced by 100 µM KCN, a cytochrome bo3 inhibitor14, as measured by a decrease in red fluorescence of membrane potential sensitive probe DiOC2(3) (Fig. 7a,b). KCN-induced membrane depolarization is consistent with inhibition of cytochrome bo3 and its proton-pumping ability13,14. CCCP (carbonyl cyanide 3-chlorophenylhydrazone), a proton ionophore that dissipates both membrane potential and proton gradient, induced strong membrane depolarization (as expected), 3-fold (significantly) higher than PGRP and KCN (Fig. 7a,b).
Figure 7.
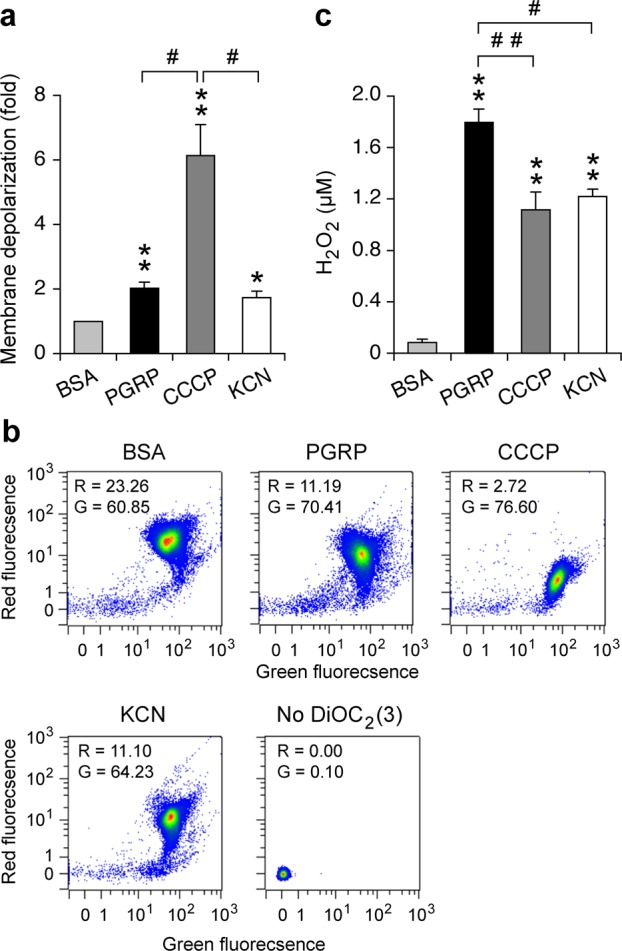
Comparison of membrane depolarization and H2O2 production. E. coli were treated with BSA, PGRP, CCCP, or KCN as indicated for 15 min. (a) Membrane depolarization was measured by flow cytometry with membrane potential sensitive dye DiOC2(3) and the results are the ratios of mean red fluorescence intensity in BSA/treated cells shown as means ± SEM from 6 experiments. (b) Representative dot plots with mean red (R) and green (G) fluorescence intensities. (c) Total amounts of H2O2 are shown as means ± SEM from 8 experiments. *P < 0.05, **P < 0.001, PGRP, CCCP, or KCN vs BSA; #P < 0.05, ##P < 0.001 as indicated; all other differences were not significant (P > 0.05).
We next tested whether membrane depolarization with CCCP or cytochrome inhibition with KCN would induce H2O2 production and whether the amount of H2O2 would correlate with the extent of membrane depolarization. Both CCCP and KCN induced similar and significant increases in H2O2 production compared with BSA-treated bacteria, but the amounts of CCCP- and KCN-induced H2O2 were significantly lower than in PGRP-treated bacteria (Fig. 7c). These results reveal that membrane depolarization with CCCP or cytochrome bo3 inhibition with KCN induce significant H2O2 production, but also show that there is no correlation between the extent of membrane depolarization and the amount of H2O2 produced, as PGRP induced low-level membrane depolarization and high amount of H2O2, whereas CCCP induced much higher level of membrane depolarization but lower amount of H2O2 than PGRP.
Discussion
E. coli has a complex branched respiratory chain, which allows the bacterium to quickly adapt to changes in the oxygen supply and other environmental conditions13. However, these multiple and essential functions of E. coli respiratory chain are also a target for human bactericidal innate immunity proteins, PGRPs, which induce a block in E. coli respiratory chain12. The results of this study show that PGRP-induced H2O2 production and bacterial killing require FDH-O, UQ, and cytochrome bd-I, in addition to the previously shown requirement for NDH-1 and NDH-212. PGRP-treated E. coli up-regulates its metabolism by increasing cAMP-Crp-controlled TCA cycle and supply of NADH, by increasing NADH oxidation by NDH-1 and NDH-212, and also by increasing oxidation of formate by FDH-O, perhaps in an attempt to overcome this block in the respiratory chain by increasing influx of electrons. The central and critical components of this proposed model are UQ and cytochrome bd-I, because increased function of all three dehydrogenases (FDH-O, NDH-1, and NDH-2) supplies electrons to UQ and reduces it to ubiquinol (UQ-H2), which then transfers electrons to cytochromes (Fig. 8).
Figure 8.
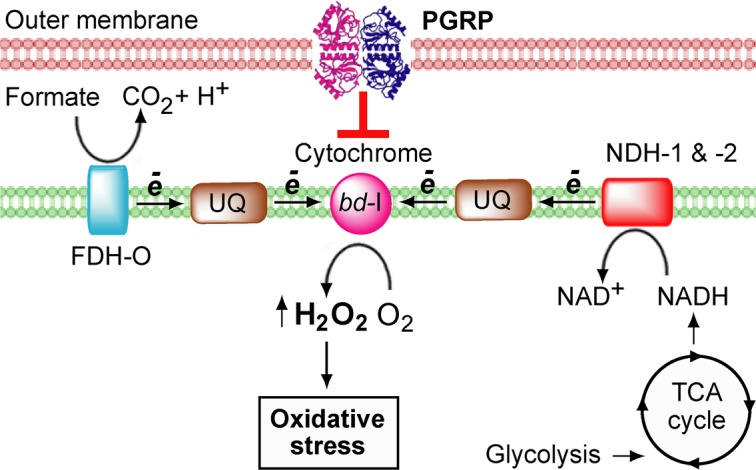
Proposed events in PGRP-induced oxidative stress in E. coli. Electrons from FDH-O, NDH-1, and NDH-2 substrates flow through UQ to cytochrome bd-I, which results in partial reduction of O2 to H2O2, likely at the level of cytochrome bd-I due to incomplete electron transfer from UQ-H2 to cytochrome bd-I or malfunction of cytochrome bd-I. The amount of H2O2 exceeds the maximum level that can be detoxified by the cell and induces oxidative stress.
We propose that cytochrome bd-I is the site of PGRP-induced H2O2 production and not the dehydrogenases (FDH and NDH) and UQ, because deleting UQ (downstream from FDH and NDH) or cytochrome bd-I (downstream from UQ) completely abolished PGRP-induced H2O2 production. If FDH, NDH or UQ were the sites of H2O2 production due to electron backup, deleting downstream components of the respiratory chain (UQ or cytochrome bd-I) would have had no effect or would have enhanced H2O2 production. Thus, our data showing that deleting dehydrogenases12, or UQ, or cytochrome bd-I all abolished PGRP-induced H2O2 production suggest that electrons are being transferred all the way down to cytochrome bd-I and that incomplete reduction of O2 to H2O2 is at the level of cytochrome bd-I, possibly due to incomplete electron transfer from UQ-H2 to cytochrome bd-I or malfunction of cytochrome bd-I (Fig. 8).
Consistent with this proposed model, there was a significant increase in UQ/UQ-H2 ratio at the peak of PGRP-induced H2O2 production (15 min), suggesting that the increased electron transfer from UQ-H2 to cytochrome bd-I at that time had already occurred and resulted in UQ-H2 oxidation to UQ. This high UQ/UQ-H2 ratio is maintained, because in PGRP-treated cells there is only a short-lived spike in the metabolism (5 to 10 min) followed by a decrease12, which limits further supply of electrons to UQ.
Decreasing O2 consumption at the time of PGRP-induced H2O2 production12 suggests that this H2O2 production is not a small byproduct of the usual O2 reduction to H2O by the cytochromes, because this would require a very large PGRP-induced increase in O2 consumption to produce such a large amount of H2O2 (as a byproduct). Therefore, the diminished O2 consumption12 concomitant with a high increase in H2O2 production can be best explained by incomplete reduction of the majority of O2 to H2O2 and thus even a decreasing O2 consumption could still produce the amounts of H2O2 that we detected. With continued PGRP treatment the function of the respiratory chain progressively deteriorates, eventually leading to almost complete loss of O2 consumption and a decline in PGRP-induced H2O2 production at 30 min12, which coincides with the cessation of all biosynthetic reactions in the cell10.
Our proposed model is energetically favorable for efficient transfer of electrons (exergonic)13. CO2/formate coupled to FDH has the lowest midpoint potential (Eo′ = −432 mV with donor/UQ ΔEo′ = 545 mV), followed by NAD+/NADH coupled to NDH-1 and NDH-2 (Eo′ = −320 mV with donor/UQ ΔEo′ = 433 mV), O2/H2O2 coupled to cytochrome bd-I (Eo′ = 280 mV with UQ-H2/acceptor ΔEo′ = 167 mV), and O2/H2O coupled to cytochrome bd-I (Eo′ = 820 mV with UQ-H2/acceptor ΔEo′ = 707 mV)13,14,24. Cytochrome bd-I has three hemes, b558, b595, and d, with Eo′ = 176 mV, 168 mV, and 258 mV, respectively, that can accept electrons14,24. E. coli UQ/UQ-H2 Eo′ = 113 mV and thus it is energetically favorable for cytochrome bd-I to accept electrons from UQ-H2. Because heme d is the main O2-binding and reducing site in cytochrome bd-I14,24, reducing O2 to H2O2 (O2/H2O2 Eo′ = 280 mV) at heme d is still energetically possible with ΔEo′ = 22 mV, although less favorable than reducing O2 to H2O (ΔEo′ = 562 mV). Cytochrome bo3 has two hemes, b and o3, and CuB that accept electrons with Eo′ = 280 mV, 280 mV, and 370 mV, respectively (with o3/CuB donating electrons to O2)14, and thus it is not energetically favorable for cytochrome bo3 to reduce O2 to H2O2, which may be the reason why deleting cytochrome bo3 has no effect on PGRP-induced H2O2 production.
How do PGRPs induce the respiratory chain malfunction that leads to H2O2 production? PGRPs have a peptidoglycan-binding groove specific for disaccharide-peptide fragments of peptidoglycan. In Gram-positive bacteria PGRPs selectively bind to the separation sites of the newly formed daughter cells, created by dedicated peptidoglycan-lytic endopeptidases, which separate daughter cells after cell division10. In Gram-negative bacteria, PGRPs bind to the entire outer membrane10 through a separate binding site specific for LPS5,9. This binding to the outer membrane is required for PGRP killing, because exogenous LPS blocks PGRP binding and PGRP killing of E. coli10. PGRPs do not enter the cytoplasm10 and induce the respiratory chain malfunction from the extracellular site, but it is not known whether after binding to the outer membrane they translocate to peptidoglycan in the periplasmic space and/or to the cytoplasmic membrane. Therefore, it is not known whether the effects of PGRPs on the respiratory chain are indirect (more likely) or direct.
We considered that PGRP-induced membrane damage or depolarization could be the cause of the respiratory chain malfunction and H2O2 production. However, cytoplasmic membrane is not permeabilized in PGRP-treated E. coli for up to 6 hrs6 and PGRP induced only low-level membrane depolarization. Moreover, there was no correlation between the extent of membrane depolarization and the amount of H2O2 produced, i.e., PGRP induced low membrane depolarization and high H2O2 production, whereas CCCP induced high membrane depolarization and lower H2O2 production (Fig. 7). These results are consistent with our previous analysis of gene expression11, which showed high induction of oxidative stress response genes in PGRP-treated E. coli, such as oxyS, ahpF, katG, soxS, and soxR (indicating high production of H2O2 and O2−), but no increase in CCCP-treated cells in the expression in oxyS, ahpF, and katG, and moderate increase in the expression of soxS and soxR (indicating production of some O2− but no or low amount of H2O2) and thus showing very limited oxidative stress response to CCCP. Altogether, these results suggest that PGRP-induced membrane depolarization may be the consequence of the decreased respiration rather than the primary cause of the respiratory chain malfunction and H2O2 production. However, other possibilities cannot be excluded, such as membrane depolarization as the initial event, or other effects of PGRP on the cytoplasmic membrane that interfere with the respiratory chain.
The subsequent events that follow PGRP interaction with bacteria and production of H2O2 and contribute to the eventual bacterial death include: (i) depletion of cellular thiols (peaks in 30 min); (ii) generation of HO• from H2O2, which then damage bacterial DNA, membrane, and proteins (30 min–2 hrs); (iii) increase in intracellular labile Zn2+ (peaks in 1 hr); and (iv) cessation of all biosynthetic reactions (30 min–2 hrs)10–12.
Our results also identify a new function for FDH-O. FDH-O and FDH-N are transmembrane dehydrogenases (formate-quinone oxidoreductases) with their catalytic sites facing the periplasmic space. They oxidize periplasmic formate to CO2 and reduce membrane quinones to quinols, which then transfer electrons to the terminal respiratory chain quinol oxidoreductases. Whereas much is known about the structure and function of FDH-N in anaerobic respiration on nitrite and nitrate13,16,17, very little is known about the function of aerobically expressed FDH-O16,17. The requirement for FDH-O in PGRP-induced bacterial killing and H2O2 production clearly show that FDH-O is active in aerobically growing E. coli and is an integral and important component of the aerobic respiratory chain and a major contributor of electrons to the quinone pool. Our results confirm abundant aerobic expression of FDH-O. The importance of FDH-O is also highlighted by recent results of Hughes et al.25 showing the ability of Enterobacteria to use formate oxidation by FDH-O and FDH-N to shuttle electrons to the respiratory chain cytochrome bd-I when oxygen becomes available. Hughes et al. results also suggests that O2 is the final electron acceptor for formate oxidation by both FDH-N and FDH-O (which is consistent with our results) and show that this mechanism gives Enterobacteria a competitive advantage in the inflamed gut, where oxygen is supplied by blood. Our results suggest that PGRPs can exploit this mechanism to kill bacteria.
Our results show that multiple dehydrogenases – FDH-O (this study) and NDH-1 and NDH-212 – are all required for PGRP-induced killing and H2O2 production. Moreover, elimination of even a single dehydrogenase results in a significantly increased resistance to PGRP-induced killing and in a drastic loss of PGRP-induced H2O2 production, rather than in a small incremental effect of each deletion. One possible explanation for this finding could be a threshold effect, in which simultaneous action of all the dehydrogenases is required to produce the amount of H2O2 that exceeds the maximum level that the cell can detoxify, and deletion of any single dehydrogenase decreases the amount of H2O2 below this threshold level.
Another possible explanation could be the formation of supercomplexes by the respiratory dehydrogenases and cytochromes, in which the function of each component is dependent on the presence and/or function of the other components in the supercomplex. Formation of such supercomplexes is well accepted in mitochondria26,27. In E. coli formation of three supercomplexes was reported: FDH-O:cytochrome bo3:cytochrome bd-I supercomplex, NDH-1:NDH-2 supercomplex, and SDH:cytochrome bd-II supercomplex, with each component of the complex required for the assembly and full enzymatic activity of the supercomplex26,28–30. Super-resolution microscopy and quantification revealed the presence of complexes of respiratory chain enzymes in E. coli membrane, but did not show co-localization of NDH-1, cytochrome bo3, cytochrome bd-I, SDH, and FoF1ATPase in these complexes27. These results do not support the presence of the above-mentioned supercomplexes and make this possibility a less likely explanation of our results, although co-localization of FDH-O and NDH-2 with other respiratory enzymes was not studied in this report27 and is still a possibility.
Cytochromes usually serve as electron sinks and under normal growth conditions protect bacteria from inadvertent production of H2O2 and oxidative stress, because their high affinity for O2 allows them to efficiently transfer 4 electrons to O2 for its complete reduction to H2O13,14,31. However, our results suggest that in PGRP-treated cells cytochrome bd-I malfunctions, which results in an incomplete 2-electron reduction of O2 to H2O2. Thus, the pathways and the final electron donors (cytochromes) for PGRP-induced H2O2 are likely different from the sources of the low-level H2O2 produced in control cells growing without PGRP, because deleting NDH-1 and NDH-2, or UQ, or cytochromes bo3 and bd-I increase the basal levels of H2O2 production in cells growing in a medium23, whereas, these deletions in PGRP-treated cells resulted in a decrease of PGRP-induced H2O2 production (ref. 12 and Figs. 5 and 6).
Purified cytochrome bd-I has peroxidase activity and can reduce H2O2 to H2O using quinol as an electron donor32. It is not known how this activity functions in intact cells, but its membrane localization suggests a role in scavenging periplasmic H2O2 and protection against environmental H2O2. This peroxidase activity, however, had negligible effect in our experiments, because deletion of cytochrome bd-I abolished (rather than enhanced) PGRP-induced H2O2 production.
Cytochrome bd-I is important for bacterial growth and virulence, for example in E. coli urinary tract infections33 or colitis25. Cytochrome bd-I is also an attractive target for antibacterial agents, because it is only present in prokaryotes, but not in eukaryotic mitochondria. Cytochrome bd-I protects mycobacteria from killing by drugs targeting cytochrome c34–37, which is the opposite effect to the requirement for cytochrome bd-I in PGRP-induced killing reported in this study. However, similar to our results with PGRP in E. coli, combining cytochrome c inhibition with oxidative stress-inducing drug (clofazimine) in mycobacteria induces cytochrome bd-I-dependent enhancement of killing and production of reactive oxygen species38.
Some antibacterial peptides, namely aurachin D, gramicidin S, and microcin J25, selectively inhibit E. coli cytochrome bd-I redox activity39–43, and microcin J25 also induces cytochrome bd-I-dependent production of O2–41–43. However, these effects have been only shown in isolated membranes or proteins, but not in cells in situ, and the sensitivity to microcin J25-induced killing was similar in cytochrome bd-I- and bo3-deficient mutants. Also, gramicidin S and microcin J25 have additional targets in bacteria that are most likely responsible for their antibacterial effect: gramicidin S destroys cytoplasmic membrane integrity40 and microcin J25 inhibits RNA polymerase41, and, thus, their effects on cytochrome bd-I appear secondary. Human antibacterial peptide, LL-37, was also shown to induce a cytochrome bd-I-dependent burst of O2− and HO• production in E. coli cells before permeabilizing their cytoplasmic membranes, which is the main mechanism of LL-37-induced killing44. However, again, this O2− and HO• production did not significantly contribute to LL-37-induced killing, which was the same in cytochrome bd-I- and bo3-deficient mutants. Thus, these antibacterial peptides often have intracellular targets or permeabilize cytoplasmic membrane, their effects on cytochrome bd-I in cells in situ are negligible or unknown, and they are often transported into the periplasm and cytoplasm by specific transporters41,43. By contrast, PGRPs are large proteins, stay bound to the bacterial envelope, do not enter the cytoplasm10, do not permeabilize cytoplasmic membranes4,6,10, and induce large amounts of peroxide readily detectable in PGRP-treated cells11,12, which is dependent on cytochrome bd-I and correlates with the increased resistance of cytochrome bd-I-deficient mutants to PGRP-induced killing. Thus, the mechanisms of bacterial killing by small antibacterial peptides and PGRP are different.
PGRPs are conserved in evolution from insects to mammals and have retained their antimicrobial effectiveness for millions of years with no frequent emergence of fully resistant strains. The multiple factors responsible for this continued antimicrobial effectiveness of PGRPs include their ability to: (i) bind to multiple components of bacterial envelope (peptidoglycan, lipoteichoic acid, and LPS); (ii) simultaneously induce oxidative, thiol, and metal stress responses in bacteria, which individually are bacteriostatic, but in combination are bactericidal; (iii) induce oxidative, thiol, and metal stress responses in bacteria through three independent pathways; (iv) affect multiple metabolic pathways; and (v) synergize with other innate immune molecules, such as antimicrobial peptides (reviewed in45). Thus, emergence of PGRP resistance and disabling these multiple mechanisms would require simultaneous acquisition of resistance to these multiple separate antimicrobial mechanisms – a very low probability event. Our current results further elucidate this intricate ability of PGRPs to control bacterial growth and survival.
In conclusion, our results identify the sequence of events in PGRP-induced bacterial killing and uncover a bactericidal mechanism that can be exploited in the future for the development of new approaches to enhance resistance to infections and increase effectiveness of antibacterial therapy.
Materials and Methods
Materials
Human recombinant PGLYRP4 (used as a representative bactericidal PGRP) was expressed in S2 cells and purified as previously described4,6 in a buffer containing 10 mM TRIS (pH 7.6), with 150 mM NaCl, 10 µM ZnSO4, and 10% glycerol, and used at 100 µg/ml (0.87 µM, as PGLYRP4 is a 115 kDa disulfide-linked dimer4) final concentration, unless otherwise indicated. Paraquat (methyl viologen) was from Acros Organics and CCCP (carbonyl cyanide 3-chlorophenylhydrazone) from Molecular Probes (dissolved in DMSO, with equivalent amount of DMSO added to other groups). Fatty acids-free purified bovine serum albumin (BSA, used as a negative control) and other reagents were from Sigma-Aldrich, unless otherwise indicated.
Bacteria, growth, and media
E. coli strains used in this study are listed in Supplementary Table S146. Bacteria were grown aerobically overnight at 37 °C in an orbital shaker (250 rpm) in LB, diluted to OD660 = 0.02 into fresh LB and grown to OD660 = 0.6. Bacteria were centrifuged and suspended in the “Assay Medium”, which was the same for all the killing or metabolic experiments here and in our previous killing experiments on E. coli6,10–12. This Assay Medium contained (final concentrations): 5 mM TRIS (pH 7.6) with 2.5% glycerol, 150 mM NaCl, 5 µM ZnSO4, and 1% of 100% LB. E. coli MG1655 generation time in this assay medium at 37 °C was 30 min. The change in the medium from LB to the Assay Medium did not create any significant stress for bacteria12. Also, pre-incubation of cells in this medium for 30 min did not change their response to PGRP, as measured by respiration, extracellular acidification rate, H2O2 production, and killing12.
Screening of Tn-mutant library
A highly saturated mini-Tn10 (Tn) insertion library in E. coli MG1655 containing ~200,000 unique mutants, generated and characterized previously15, was used in this study. Each mutant contained one transposon randomly inserted into the chromosome, with one insert per 20 bp on average and ~25 different transposon mutants for each gene/intergenic region, with nearly random distribution of insertions and the absence of large gaps or hot spots15. For each experiment, 5 µl of freshly thawed glycerol stock of the Tn library containing ~107 CFU/5 µl was inoculated into 5 ml of LB and grown aerobically at 37 °C in an orbital shaker (250 rpm) for 3 generations. The bacteria were sedimented by centrifugation and suspended at ~2.5 × 10⁶ bacteria/ml in 50 µl of fresh warm Assay Medium with addition of 100 µg/ml PGRP, or 220 µg/ml PGRP, or 200 µg/ml BSA (control) and incubated at 37 °C aerobically with 250 rpm shaking for 3 hrs. These PGRP treatments resulted in ~50% and >99% reduction in CFU, respectively (higher concentration of PGRP than in other assays was required because of the high number of bacteria used in these experiments); BSA treatment resulted in ~40-fold increase in CFU in 3 hrs, compared with the initial inoculum. After 3-hr incubation each entire 50 µl culture was diluted with saline and plated on LB agar for single colonies on multiple 15 cm plates, which were then incubated at 37 °C aerobically overnight. Approximately 100,000, 50,000, and 1,000 colonies from BSA- and PGRP-treated groups, respectively, were then scraped from the plates and thoroughly mixed. The lower numbers of colonies in PGRP-treated groups represented all the surviving mutants (more resistant to PGRP), with ~50% and >99% of mutants (most sensitive to PGRP) killed by 100 and 220 µg/ml PGRP, respectively. For each treatment group, genomic DNA was extracted from 1-ml aliquot of pooled colonies containing ~5 × 10⁹ CFU using a Gentra Puregene Yeast/Bacteria Kit (Qiagen) and subjected to deep sequencing analysis. The entire experiment was repeated 3 times (3 biological replicates).
Transposon sequencing (Tn-seq)
Illumina sequencing was carried out as described previously15,47. Briefly, genomic DNA was sonicated to produce 200- to 600-bp fragments. A poly(C) tail was added to DNA fragments by using terminal deoxynucleotidyl transferase. A first round of PCR with one transposon-specific primer (olj363) and one oligo (dG) primer (olj376) (Supplementary Table S2) was conducted to amplify the fragments. A second round of PCR with a nested primer (olj385) was conducted to add adaptors and bar codes for Illumina sequencing (with BSA, PGRP 50% survival, and PGRP <1% survival groups primers, bar codes are underlined in Supplementary Table S2). The sequencing was conducted on Illumina HiSeq 2000 at The Tufts University Core Facility (TUCF), Boston, MA, using olj386 custom sequencing primer and a standard Illumina index sequencing primer. The complete Tn-seq results have been deposited in NCBI SRA with accession number PRJNA549505 (samples SAMN12090400 - SAMN12090408) (https://www.ncbi.nlm.nih.gov/sra/PRJNA549505).
Tn-seq data analysis
Read mapping and calculations were carried out on the Tufts University Galaxy server as described previously15,47. Briefly, Illumina reads were aligned to the E. coli MG1655 genome sequence using Bowtie48. The Tufts Galaxy server custom script was applied to enumerate read number for each insertion site. The insertion sites were then aggregated by annotated genes. In order to fully cover all genes and promoter regions, a GenBank file containing all intergenic regions was generated to allow insertion sites to aggregate to intergenic regions. The predicted number of reads for each gene was calculated based on the length of the gene and the total number of reads in the library. We identified 2,540 genes and 570 intergenic regions that contained 3 or more Tn insertion sites and we used these genes for further analysis, because >3 insertion sites are needed for reliable identification of mutants with changed frequency in the library15. For each gene in both BSA- and PGRP-treated groups we calculated Dval, which represents the predicted frequency of each gene in the library based on the length of the gene, the total length of the genome, and the total number of reads in the library; Dval = the number of actual reads for the gene/predicted number of reads for the gene. For each gene we then calculated the survival index, SI = Dval in PGRP-treated group/Dval in control BSA-treated group. The SI reflects a change in the frequency of each gene (Tn insertion mutant) following PGRP treatment. A neutral mutation with no effect on survival in the presence of PGRP has SI = 1, whereas SI > 1 denotes mutation that makes bacteria more resistant to PGRP, and SI < 1 denotes mutation that makes bacteria more sensitive to PGRP.
Construction and verification of deletion mutants
We created gene deletion mutants (Supplementary Table S1) by replacing the entire coding sequence of the genes (in frame) with kanamycin resistance cassette using homologous recombination, as previously described12,49. We generated PCR fragments using primers (Supplementary Table S2) and individual mutants from the Keio collection46, digested the fragments with DpnI, gel purified, and electroporated into E. coli MG1655 or BW25113 carrying the Red helper plasmid pKD46 (CGSC #7669). Transformed cells were recovered in SOC media with ampicillin and L-arabinose at 30 °C with shaking overnight, and kanamycin (30 µg/ml) resistant colonies were picked and verified by colony PCR with kanamycin-specific and gene-specific primers (Supplementary Table S2). The gene deletions in each mutant were then further verified by capillary sequencing using gene-specific primers. To create double deletion mutants, the kanamycin resistance gene was first removed from a single mutant using pCP20 plasmid. This plasmid has ampicillin resistance, shows temperature-sensitive replication, and thermal induction of Flp recombinase50. Mutants were transformed with pCP20, and ampicillin-resistant transformants were selected at 30 °C, further colony purified nonselectively at 43 °C, and then tested for loss of ampicillin as well as kanamycin resistance. Then, the second mutation was introduced by transforming pKD46 into the mutant whose kanamycin cassette had been removed, followed by the gene disruption protocol described above for generation of single deletion mutants.
PGRP killing assay
E. coli were grown as described above in “Bacteria, growth, and media” section and suspended at 0.25 × 10⁶ bacteria/ml in 50 µl of fresh warm Assay Medium with addition of BSA or PGRP (100 µg/ml, except for Fig. 4a, where 50 µg/ml was used) and incubated at 37 °C aerobically with 250 rpm shaking for 3 hrs. The numbers of bacteria were then determined by colony counts10–12.
H2O2 assay
H2O2 production was measured as previously described12 using Amplex Red Hydrogen Peroxide/Peroxidase Assay Kit (InVitrogen/Molecular Probes), based on enzymatic detection of H2O2 by horseradish peroxidase. E. coli were grown and suspended in 50 µl of Assay Medium at OD660 = 0.15 (~50 × 106 bacteria/ml) as described above in “Bacteria, growth, and media” section, with addition of BSA (100 µg/ml), PGRP (100 µg/ml), paraquat (100 µM), CCCP (20 µM), or KCN (100 µM). Bacteria were then incubated aerobically at 37 °C on a shaker for 15 min (unless otherwise indicated). The reactions were then stopped by lysing bacteria with 40 mM HEPES, 4 mM EDTA, 400 mM KCl, 0.2% Triton X-100, pH 8.1 in a bath sonicator on ice for 5 min, and total amount of H2O2 was determined by measuring fluorescence12.
Quinone assay
Quinones were extracted as described by Bekker et al.22,51. E. coli were grown as described above in “Bacteria, growth, and media” section and suspended at ~85 × 106 bacteria/ml in 2.5 ml of fresh warm Assay Medium with addition of 300 µg/ml BSA or PGRP and incubated in 50-ml tubes at 37 °C aerobically with 250 rpm shaking for 15 min (higher concentration of PGRP than in other assays was required because of the high number of bacteria used in these experiments, which was needed to obtain sufficient amounts of quinones). Samples were immediately quenched with 7.5 ml of ice-cold methanol, immediately followed by addition of 7.5 ml of petroleum ether at 40–60 °C and vortexing for 1 min. The samples were centrifuged for 2 min at 900 g at 4 °C and the upper petroleum ether phase was transferred to a glass test tube and evaporated to dryness under a flow of nitrogen. The dried sample was re-extracted with another 7.5 ml of petroleum ether and evaporated to dryness under a flow of nitrogen as above, sealed in a nitrogen-purged glass tube, placed at −80 °C in the dark, and analyzed within 48 hrs. The extracted dried samples were reconstituted in 50 µL of 100% methanol just prior to the analysis, and oxidized and reduced quinones were quantified by LC/MS/MS as previously described52 at the Purdue University Bindley Bioscience Center Core Facility, West Lafayette, IN. Oxidized ubiquinone 9 (UQ9) and menaquinone 7 (MK7) were purchased from Cayman Chemicals and used as standards. Stock solutions were prepared in methanol and stored at −20 °C in the dark. Reduced forms were prepared daily by reduction with sodium borohydride and extraction with hexane, followed by reconstitution with methanol according to Ruiz-Jiménez et al.52.
An Agilent 6460 QQQ coupled to an Agilent 1200 Rapid Res LC system was used for the analysis. Water’s Xterra C18 2.1 × 100 mm, 3.5 µm column was used for the LC separation. The LC buffers were: (A) methanol:water:formic acid (74:25:1) with 5 mM ammonium formate and (B) methanol:formic acid (99:1) with 5 mM ammonium formate. The linear gradient was as follows: time 0 mins, 0% B; time 5 minutes, 100% B; time 15 minutes, 100% B; time 16 minutes, 0% B; time 20 minutes, 0% B. The auto sampler was set to 4 °C and in total darkness during the instrument acquisition. The data were acquired in multiple reaction monitoring mode (MRM). The source was set to a gas temperature of 330 °C, gas flow of 9 L/min, nebulizer pressure of 40 psi, sheath gas temperature of 250 °C, sheath gas flow of 7 L/min, the capillary was positive 4000 V, nozzle 1000 V, and ΔEMV of +400 V. Agilent Masshunter Quantitative analysis (v6.0) was used for the data analysis. E. coli UQ8, UQ8-H2, UQ9, UQ9-H2, and MK8 were detected and quantified based on UQ9, UQ9-H2, MK7, and MK7-H2 standards, consistent with the previously reported predominant synthesis of quinones with 8 and minor synthesis of quinones with 9 isoprenoid subunits in E. coli20,22.
Membrane depolarization
Membrane depolarization was measured by flow cytometry with the membrane potential sensitive fluorescent probe DiOC2(3) (3,3-diethyloxacarbocyanine iodide) using BacLight™ Bacterial Membrane Potential Kit (from Molecular Probes, ThermoFisher Scientific B34950)53 as recommended by the manufacturer. DiOC2(3) accumulates in the cell membrane and changes fluorescence from green to red at high membrane potential, and thus membrane depolarization is reflected by a decrease in red fluorescence. E. coli MG1655 were grown and suspended in 50 µl of Assay Medium at OD660 = 0.02 as described above in “Bacteria, growth, and media” section. DiOC2(3) (30 µM) and BSA (100 µg/ml), PGRP (100 µg/ml), CCCP (20 µM, concentration that caused complete membrane depolarization), or KCN (100 µM) were added, cultures were incubated aerobically at 37 °C on a shaker for 15 min, and fluorescence of ~5 × 10⁵ bacteria/culture was immediately measured by flow cytometry using MACSQuant (Miltenyi) flow cytometer with FITC (green) and PE (red) excitation and emission settings for green and red DiOC2(3) fluorescence. The extent of membrane depolarization was expressed as the ratios of mean red fluorescence intensity in BSA/treated cells ± SEM, with representative dot plots of green and red fluorescence intensity also shown.
Gene expression arrays
Preparation of the whole genome expression arrays was described previously11 and the entire data for all the arrays were deposited in NCBI GEO with accession number GSE44211 (http://www.ncbi.nlm.nih.gov/geo/query/acc.cgi?acc=GSE44211). Here, from these arrays, we present and analyze for albumin- and PGRP-treated E. coli the expression of genes for formate dehydrogenases, proteins required for the assembly and activity of formate dehydrogenases, formate synthesis and transport, quinone synthesis, and cytochromes, which are the subject of this study and were not analyzed or presented previously. Briefly, exponentially growing E. coli MG1655 were suspended in the Assay Medium at OD660 = 0.3 as in “Bacteria, growth, and media” section, and incubated aerobically at 37 °C with 100 µg/ml albumin (control) or PGRP (human PGLYRP4) with 250 rpm shaking. RNA was then extracted using Ambion RiboPure-bacteria RNA extraction kit, cDNA was synthesized with random hexamer primers, fragmented, labeled with terminal transferase and biotin, and hybridized to whole genome Affymetrix E. coli Genome 2.0 Array GPL3154 using Affymetrix Hybridization Oven 640 and Affymetrix GeneChip Fluidics Station 450 and protocols provided by Affymetrix GeneChip Technical Manual. Scanning and data extraction were done using Affymetrix GeneChip Scanner 3000 and protocols provided by Affymetrix GeneChip Technical Manual. cDNA synthesis, labeling, hybridization, and scanning were performed at the Genomic and RNA Profiling Core facility, Baylor College of Medicine, Houston, TX. The entire experiment was repeated 3 times. Hybridization intensity data signals were normalized and analyzed as described11 using Affymetrix GeneChip Command Console Software. Signal intensities from 3 experiments (3 biological replicates) were used to calculate geometric means ± SEM. Transformed Ln(signal intensity) values were used for direct statistical comparisons of expression signals between PGRP-treated and control (albumin) groups.
Annotation of gene functions
The functions of genes were annotated using the following web databases: EcoCyc: https://ecocyc.org/17 and RegulonDB: http://regulondb.ccg.unam.mx/index.jsp.
Statistical analyses
Quantitative results are presented as arithmetic or geometric means ± SEM, with statistical significance of the differences between groups determined by the two-sample two-tailed Student’s t-test or paired Student’s t-test using Microsoft Excel; P ≤ 0.05 was considered significant. The n and P values are indicated in the figures.
Supplementary information
Acknowledgements
We are grateful to Kim Lewis for donating E. coli Tn10 insertion library. This study was supported by the grant 5R01AI120962 from United States Public Health Service National Institutes of Health (to R.D.).
Author contributions
D.R.K., D.G. and R.D. conceived and designed the experiments; D.R.K., D.A.K. and C.-K.Y. performed the experiments; Y.S. generated Tn10 insertion library and contributed analysis tools; D.R.K., D.A.K., D.G. and R.D. analyzed the data; R.D. wrote the manuscript with contributions from D.R.K. and D.G.
Data availability
All data generated or analyzed during this study are included in this published article (and its Supplementary Information) or have been deposited in NCBI as cited in the text under the accession numbers PRJNA549505 and GSE44211.
Competing interests
The authors declare no competing interests.
Footnotes
Publisher’s note Springer Nature remains neutral with regard to jurisdictional claims in published maps and institutional affiliations.
Supplementary information
is available for this paper at 10.1038/s41598-020-58302-1.
References
- 1.Royet J, Dziarski R. Peptidoglycan recognition proteins: pleiotropic sensors and effectors of antimicrobial defenses. Nature Rev. Microbiol. 2007;5:264–277. doi: 10.1038/nrmicro1620. [DOI] [PubMed] [Google Scholar]
- 2.Dziarski, R., Royet, J. & Gupta, D. Peptidoglycan recognition proteins and lysozyme. In Encyclopedia of Immunobiology, (ed. Ratcliffe, M. J. H.), vol. 2, 389–403 (Elsevier, 2016).
- 3.Tydell CC, Yount N, Tran D, Yuan J, Selsted ME. Isolation, characterization, and antimicrobial properties of bovine oligosaccharide-binding protein. A microbicidal granule protein of eosinophils and neutrophils. J. Biol. Chem. 2002;277:19658–19664. doi: 10.1074/jbc.M200659200. [DOI] [PubMed] [Google Scholar]
- 4.Lu X, et al. Peptidoglycan recognition proteins are a new class of human bactericidal proteins. J. Biol. Chem. 2006;281:5895–5907. doi: 10.1074/jbc.M511631200. [DOI] [PubMed] [Google Scholar]
- 5.Tydell CC, Yuan J, Tran P, Selsted ME. Bovine peptidoglycan recognition protein-S: antimicrobial activity, localization, secretion and binding properties. J. Immunol. 2006;176:1154–1162. doi: 10.4049/jimmunol.176.2.1154. [DOI] [PubMed] [Google Scholar]
- 6.Wang M, et al. Human peptidoglycan recognition proteins require zinc to kill both Gram-positive and Gram-negative bacteria and are synergistic with antibacterial peptides. J. Immunol. 2007;178:3116–3125. doi: 10.4049/jimmunol.178.5.3116. [DOI] [PubMed] [Google Scholar]
- 7.Gelius E, Persson C, Karlsson J, Steiner H. A mammalian peptidoglycan recognition protein with N-acetylmuramoyl-L-alanine amidase activity. Biochem. Biophys. Res. Commun. 2003;306:988–994. doi: 10.1016/S0006-291X(03)01096-9. [DOI] [PubMed] [Google Scholar]
- 8.Wang ZM, et al. Human peptidoglycan recognition protein-L is an N-acetylmuramoyl-L-alanine amidase. J. Biol. Chem. 2003;278:49044–49052. doi: 10.1074/jbc.M307758200. [DOI] [PubMed] [Google Scholar]
- 9.Sharma P, et al. Structural basis of recognition of pathogen-associated molecular patterns and inhibition of proinflammatory cytokines by camel peptidoglycan recognition protein. J. Biol. Chem. 2011;286:16208–16217. doi: 10.1074/jbc.M111.228163. [DOI] [PMC free article] [PubMed] [Google Scholar]
- 10.Kashyap DR, et al. Peptidoglycan recognition proteins kill bacteria by activating protein-sensing two-component systems. Nature Med. 2011;17:676–683. doi: 10.1038/nm.2357. [DOI] [PMC free article] [PubMed] [Google Scholar]
- 11.Kashyap DR, et al. Peptidoglycan recognition proteins kill bacteria by inducing oxidative, thiol, and metal stress. PLoS Pathog. 2014;10:e1004280. doi: 10.1371/journal.ppat.1004280. [DOI] [PMC free article] [PubMed] [Google Scholar]
- 12.Kashyap DR, Kuzma M, Kowalczyk DA, Gupta D, Dziarski R. Bactericidal peptidoglycan recognition protein induces oxidative stress in Escherichia coli through a block in respiratory chain and increase in central carbon catabolism. Mol. Microbiol. 2017;105:755–776. doi: 10.1111/mmi.13733. [DOI] [PMC free article] [PubMed] [Google Scholar]
- 13.Unden, G., Steinmetz, P. A. & Degreif-Dünnwald, P. The aerobic and anaerobic respiratory chain of Escherichia coli and Salmonella enterica: enzymes and energetics. EcoSal Plus6, https://www.asmscience.org/content/journal/ecosalplus/10.1128/ecosalplus.ESP-0005-2013 (2014). [DOI] [PubMed]
- 14.Borisov, V. B. & Verkhovsky, M. I. Oxygen as acceptor. EcoSal Plus6, https://www.asmscience.org/content/journal/ecosalplus/10.1128/ecosalplus.ESP-0012-2015 (2015). [DOI] [PMC free article] [PubMed]
- 15.Shan, Y., Lazinski, D., Rowe, S., Camilli, A. & Lewis, K. Genetic basis of persister tolerance to aminoglycosides in Escherichia coli. MBio6, pii: e00078-15, https://mbio.asm.org/content/mbio/6/2/e00078-15 (2015). [DOI] [PMC free article] [PubMed]
- 16.Pinske, C. & Sawers, R. G. Anaerobic formate and hydrogen metabolism. EcoSal Plus7, https://www.asmscience.org/content/journal/ecosalplus/10.1128/ecosalplus.ESP-0011-2016 (2016). [DOI] [PMC free article] [PubMed]
- 17.Keseler IM, et al. The EcoCyc database: reflecting new knowledge about Escherichia coli K-12. Nucleic Acids Res. 2017;45:D543–D550. doi: 10.1093/nar/gkw1003. [DOI] [PMC free article] [PubMed] [Google Scholar]
- 18.Hassan HM, Fridovich I. Paraquat and Escherichia coli. Mechanism of production of extracellular superoxide radical. J. Biol. Chem. 1979;254:10846–10852. [PubMed] [Google Scholar]
- 19.Cochemé HM, Murphy MP. Complex I is the major site of mitochondrial superoxide production by paraquat. J. Biol. Chem. 2008;283:1786–1798. doi: 10.1074/jbc.M708597200. [DOI] [PubMed] [Google Scholar]
- 20.Meganathan, R. & Kwon, O. Biosynthesis of menaquinone (vitamin K2) and ubiquinone (coenzyme Q). EcoSal Plus3, https://www.asmscience.org/content/journal/ecosalplus/10.1128/ecosalplus.3.6.3.3 (2009). [DOI] [PMC free article] [PubMed]
- 21.Gu M, Imlay JA. The SoxRS response of Escherichia coli is directly activated by redox-cycling drugs rather than by superoxide. Mol. Microbiol. 2011;79:1136–1150. doi: 10.1111/j.1365-2958.2010.07520.x. [DOI] [PMC free article] [PubMed] [Google Scholar]
- 22.Bekker M, et al. Changes in the redox state and composition of the quinone pool of Escherichia coli during aerobic batch-culture growth. Microbiology. 2007;153:1974–1980. doi: 10.1099/mic.0.2007/006098-0. [DOI] [PubMed] [Google Scholar]
- 23.Korshunov S, Imlay JA. Two sources of endogenous hydrogen peroxide in Escherichia coli. Mol. Microbiol. 2010;75:1389–1401. doi: 10.1111/j.1365-2958.2010.07059.x. [DOI] [PMC free article] [PubMed] [Google Scholar]
- 24.Borisov VB, Gennis RB, Hemp J, Verkhovsky MI. The cytochrome bd respiratory oxygen reductases. Biochim. Biophys. Acta. 2011;1807:1398–1413. doi: 10.1016/j.bbabio.2011.06.016. [DOI] [PMC free article] [PubMed] [Google Scholar]
- 25.Hughes ER, et al. Microbial respiration and formate oxidation as metabolic signatures of inflammation-associated dysbiosis. Cell Host Microbe. 2017;21:208–219. doi: 10.1016/j.chom.2017.01.005. [DOI] [PMC free article] [PubMed] [Google Scholar]
- 26.Melo AM, Teixeira M. Supramolecular organization of bacterial aerobic respiratory chains: From cells and back. Biochim. Biophys. Acta. 2016;1857:190–197. doi: 10.1016/j.bbabio.2015.11.001. [DOI] [PubMed] [Google Scholar]
- 27.Llorente-Garcia I, et al. Single-molecule in vivo imaging of bacterial respiratory complexes indicates delocalized oxidative phosphorylation. Biochim. Biophys. Acta. 2014;1837:811–824. doi: 10.1016/j.bbabio.2014.01.020. [DOI] [PubMed] [Google Scholar]
- 28.Sousa PM, et al. Supramolecular organizations in the aerobic respiratory chain of Escherichia coli. Biochimie. 2011;93:418–425. doi: 10.1016/j.biochi.2010.10.014. [DOI] [PubMed] [Google Scholar]
- 29.Sousa PM, et al. The aerobic respiratory chain of Escherichia coli: from genes to supercomplexes. Microbiology. 2012;158:2408–2418. doi: 10.1099/mic.0.056531-0. [DOI] [PubMed] [Google Scholar]
- 30.Sousa PM, Videira MA, Melo AM. The formate:oxygen oxidoreductase supercomplex of Escherichia coli aerobic respiratory chain. FEBS Lett. 2013;587:2559–2564. doi: 10.1016/j.febslet.2013.06.031. [DOI] [PubMed] [Google Scholar]
- 31.Paulus A, Rossius SG, Dijk M, de Vries S. Oxoferryl-porphyrin radical catalytic intermediate in cytochrome bd oxidases protects cells from formation of reactive oxygen species. J. Biol. Chem. 2012;287:8830–8838. doi: 10.1074/jbc.M111.333542. [DOI] [PMC free article] [PubMed] [Google Scholar]
- 32.Al-Attar, S. et al. Cytochrome bd displays significant quinol peroxidase activity. Sci. Rep. 6, 27631, https://www.nature.com/articles/srep27631 (2016). [DOI] [PMC free article] [PubMed]
- 33.Shepherd, M. et al. The cytochrome bd-I respiratory oxidase augments survival of multidrug-resistant Escherichia coli during infection. Sci. Rep. 6, 35285, https://www.nature.com/articles/srep35285 (2016). [DOI] [PMC free article] [PubMed]
- 34.Berney, M., Hartman, T. E. & Jacobs, W. R Jr. A Mycobacterium tuberculosis cytochrome bd oxidase mutant is hypersensitive to bedaquiline. MBio5, e01275-14. https://mbio.asm.org/content/mbio/5/4/e01275-14 (2014). [DOI] [PMC free article] [PubMed]
- 35.Moosa, A. et al. Susceptibility of Mycobacterium tuberculosis cytochrome bd oxidase mutants to compounds targeting the terminal respiratory oxidase, cytochrome c. Antimicrob. Agents Chemother. 61, pii: e01338-17, https://aac.asm.org/content/61/10/e01338-17 (2017). [DOI] [PMC free article] [PubMed]
- 36.Lu, P. et al. The anti-mycobacterial activity of the cytochrome bcc inhibitor Q203 can be enhanced by small-molecule inhibition of cytochrome bd. Sci. Rep. 8, 2625, https://www.nature.com/articles/s41598-018-20989-8 (2018). [DOI] [PMC free article] [PubMed]
- 37.Zeng, S. et al. Isoniazid bactericidal activity involves electron transport chain perturbation. Antimicrob. Agents Chemother. 63, pii: e01841-18, https://aac.asm.org/content/63/3/e01841-18 (2019). [DOI] [PMC free article] [PubMed]
- 38.Lamprecht, D. A. et al. Turning the respiratory flexibility of Mycobacterium tuberculosis against itself. Nat. Commun. 7, 12393, https://www.nature.com/articles/ncomms12393 (2016). [DOI] [PMC free article] [PubMed]
- 39.Meunier B, Madgwick SA, Reil E, Oettmeier W, Rich PR. New inhibitors of the quinol oxidation sites of bacterial cytochromes bo and bd. Biochemistry. 1995;34:1076–1083. doi: 10.1021/bi00003a044. [DOI] [PubMed] [Google Scholar]
- 40.Mogi T, Ui H, Shiomi K, Omura S, Kita K. Gramicidin S identified as a potent inhibitor for cytochrome bd-type quinol oxidase. FEBS Lett. 2008;582:2299–2302. doi: 10.1016/j.febslet.2008.05.031. [DOI] [PubMed] [Google Scholar]
- 41.Bellomio A, Vincent PA, de Arcuri BF, Farías RN, Morero RD. Microcin J25 has dual and independent mechanisms of action in Escherichia coli: RNA polymerase inhibition and increased superoxide production. J. Bacteriol. 2007;189:4180–4186. doi: 10.1128/JB.00206-07. [DOI] [PMC free article] [PubMed] [Google Scholar]
- 42.Galván AE, et al. Microcin J25 inhibits ubiquinol oxidase activity of purified cytochrome bd-I from Escherichia coli. Biochimie. 2019;160:141–147. doi: 10.1016/j.biochi.2019.02.007. [DOI] [PubMed] [Google Scholar]
- 43.Galván AE, et al. Cytochromes bd-I and bo3 are essential for the bactericidal effect of microcin J25 on Escherichia coli cells. Biochim. Biophys. Acta Bioenerg. 2018;1859:110–118. doi: 10.1016/j.bbabio.2017.10.006. [DOI] [PubMed] [Google Scholar]
- 44.Choi, H., Yang, Z. & Weisshaar, J. C. Oxidative stress induced in E. coli by the human antimicrobial peptide LL-37. PLoS Pathog. 13, e1006481, https://journals.plos.org/plospathogens/article?id=10.1371/journal.ppat.1006481 (2017). [DOI] [PMC free article] [PubMed]
- 45.Dziarski R, Gupta D. How innate immunity proteins kill bacteria and why they are not prone to resistance. Cur. Genetics. 2018;64:125–129. doi: 10.1007/s00294-017-0737-0. [DOI] [PMC free article] [PubMed] [Google Scholar]
- 46.Baba, T. et al. Construction of Escherichia coli K-12 in-frame, single-gene knockout mutants: the Keio collection. Mol. Syst. Biol. 2, https://www.embopress.org/doi/full/10.1038/msb4100050 (2006). [DOI] [PMC free article] [PubMed]
- 47.Klein BA, et al. Identification of essential genes of the periodontal pathogen Porphyromonas gingivalis. BMC Genomics. 2012;13:578. doi: 10.1186/1471-2164-13-578. [DOI] [PMC free article] [PubMed] [Google Scholar]
- 48.Langmead, B., Trapnell, C., Pop, M. & Salzberg, S. L. Ultrafast and memory-efficient alignment of short DNA sequences to the human genome. Genome Biol. 10, R25, https://genomebiology.biomedcentral.com/articles/10.1186/gb-2009-10-3-r25 (2009). [DOI] [PMC free article] [PubMed]
- 49.Datsenko KA, Wanner BL. One-step inactivation of chromosomal genes in Escherichia coli K-12 using PCR products. Proc. Natl. Acad. Sci. USA. 2000;97:6640–6645. doi: 10.1073/pnas.120163297. [DOI] [PMC free article] [PubMed] [Google Scholar]
- 50.Cherepanov PP, Wackernagel W. Gene disruption in Escherichia coli: TcR and KmR cassettes with the option of Flp-catalyzed excision of the antibiotic-resistance determinant. Gene. 1995;158:9–14. doi: 10.1016/0378-1119(95)00193-A. [DOI] [PubMed] [Google Scholar]
- 51.Bekker M, et al. The ArcBA two-component system of Escherichia coli is regulated by the redox state of both the ubiquinone and the menaquinone pool. J. Bacteriol. 2010;192:746–754. doi: 10.1128/JB.01156-09. [DOI] [PMC free article] [PubMed] [Google Scholar]
- 52.Ruiz-Jiménez J, Priego-Capote F, Mata-Granados JM, Quesada JM, Luque de Castro MD. Determination of the ubiquinol-10 and ubiquinone-10 (coenzyme Q10) in human serum by liquid chromatography tandem mass spectrometry to evaluate the oxidative stress. J. Chromatogr. A. 2007;1175:242–248. doi: 10.1016/j.chroma.2007.10.055. [DOI] [PubMed] [Google Scholar]
- 53.Novo D, Perlmutter NG, Hunt RH, Shapiro HM. Accurate flow cytometric membrane potential measurement in bacteria using diethyloxacarbocyanine and a ratiometric technique. Cytometry. 1999;35:55–63. doi: 10.1002/(SICI)1097-0320(19990101)35:1<55::AID-CYTO8>3.0.CO;2-2. [DOI] [PubMed] [Google Scholar]
Associated Data
This section collects any data citations, data availability statements, or supplementary materials included in this article.
Supplementary Materials
Data Availability Statement
All data generated or analyzed during this study are included in this published article (and its Supplementary Information) or have been deposited in NCBI as cited in the text under the accession numbers PRJNA549505 and GSE44211.