In the original article, there were mistakes in Figure 2D, Figure 2E, Figure 7C, Figure 10 (blot image), Figure 11A and Figure 11C as published.
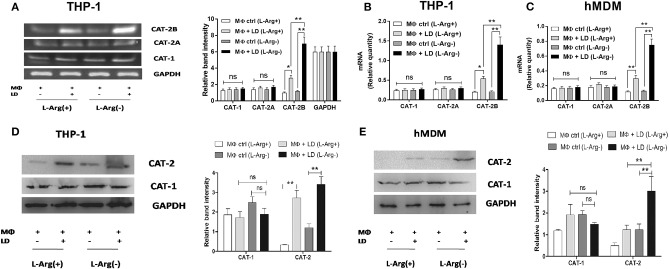
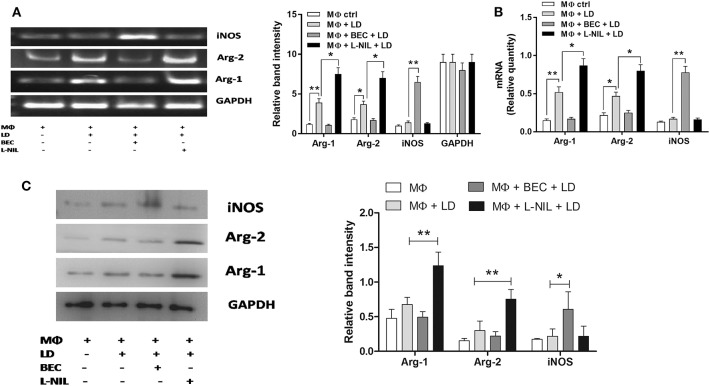
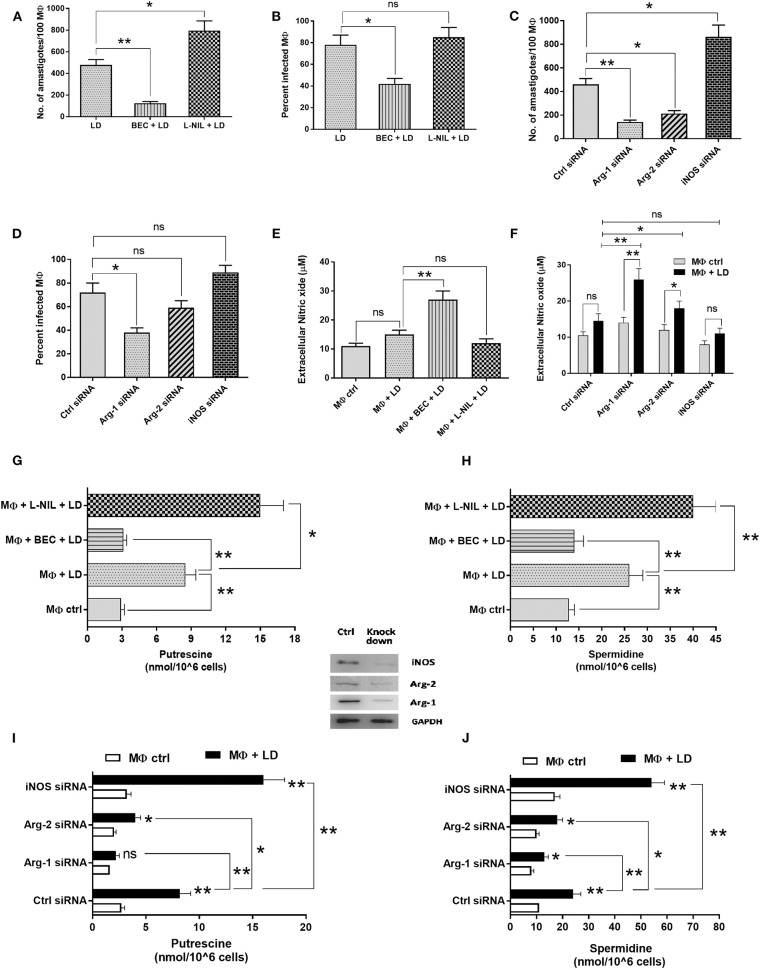
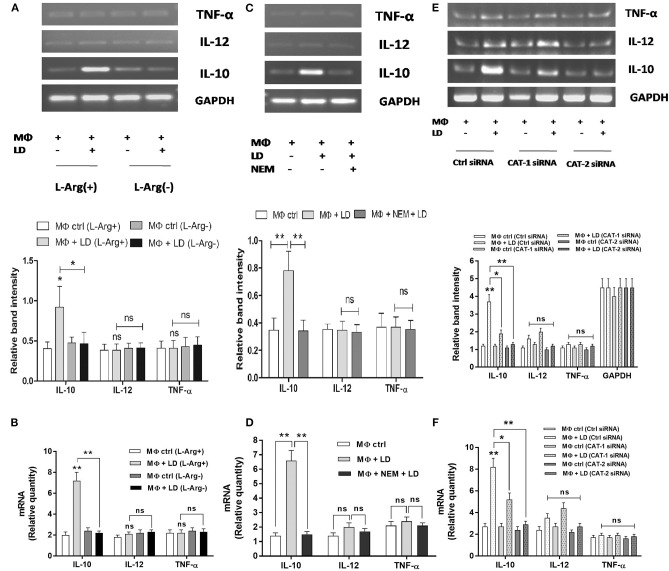
The same image was unintentionally provided for (1) CAT-2 panel in Figure 2D and Figure 2E (2) Arg-1 panel in Figure 7C and Figure 10 (blot image) (3) GAPDH panel in Figure 11A and Figure 11C. The corrected Figures 2, 7, 10, and 11 appear below.
Figure 2.
Effect of Leishmania infection on expression of CAT-1 and CAT-2. THP-1 monocyte-derived MΦs (A,B,D) and human monocyte-derived macrophages (hMDM) (C,E) (1 × 10⁶ cells/ml) were grown in l-arginine-supplemented and l-arginine-depleted RPMI medium followed by infection with Leishmania donovani (multiplicity of infection 1:10) for 48 h. The expression of CAT-1 and CAT-2 (CAT-2A and CAT-2B) were evaluated at the transcript level by semi-quantitative RT-PCR (A) and real-time PCR (B,C) and protein level by western blotting (D,E). The intensity of the bands were quantified by densitometry in Quantity one software. Each experiment was repeated three times. Semi-QRT PCR gel images and western blots are representative of three experiments. Densitometric plots are shown adjacent to the gel images. Data are mean ± SD (n = 3) (*p < 0.05; **p < 0.001; ns, non-significant) (Mann–Whitney U test).
Figure 7.
Regulation of Arg-1, Arg-2, and inducible nitric oxide synthase (iNOS) expression in case of Leishmania donovani infection. THP-1 monocyte-derived MΦs (1 × 10⁶ cells/ml) were either left untreated or preincubated with BEC (200 μM) or L-NIL (100 ng/ml) for 3 h followed by infection with L. donovani for 48 h (A–C). The expression of Arg-1, Arg-2, and iNOS was determined at the transcript level by semi-quantitative RT-PCR (A) and real-time PCR (B) and protein level by western blotting (C). The intensity of the bands was quantified by densitometry using Quantity one software. Each experiment was repeated three times. Each determination was made in triplicate and the values were expressed as mean ± SD for three independent experiments. Semi-QRT PCR gel images and western blots are representative of three experiments. Densitometric plots are shown adjacent to the gel images. Kruskal–Wallis with Dunn's multiple comparison test was used to evaluate statistical significance for comparing three or more groups; *p < 0.05; **p < 0.005.
Figure 10.
Effect of regulation of arginase-inducible nitric oxide synthase (iNOS) balance in Leishmania donovani survival inside macrophages. THP-1 monocyte-derived MΦs were either left untreated or preincubated with BEC (200 μM) or L-NIL (100 ng/ml) for 3 h followed by infection with L. donovani for 48 h (A,B,E,G,H). In another experiment, THP-1 MΦs were transfected with control siRNA, Arg-1, Arg-2, or iNOS siRNA followed by infection with L. donovani for 48 h (C,D,F,I,J). Intracellular parasites were visualized by staining the cells with Giemsa followed by optical microscopy at 100× oil immersion. The parasite load was measured by counting the number of intracellular amastigotes per 100 macrophages (A,C). The rate of infection was analyzed by counting the percent infected macrophages (B,D). Extracellular nitrite level was measured by Griess method using NaNO2 as standard (E,F). The polyamines (putrescine and spermidine) were extracted by TCA precipitation followed by dansyl chloride derivatization, separation by reverse-phase high performance liquid chromatography as described in “Materials and Methods.” Dansylated putrescine (G,I) and dansylated spermidine (H,J) were quantified by fluorescence spectrometry. Each experiment was repeated three times. Each determination was made in triplicate and the values were expressed as mean ± SD for three independent experiments. Kruskal–Wallis with Dunn's multiple comparison test was used to evaluate statistical significance for comparing three or more groups; *p < 0.05; **p < 0.005; ns, non-significant.
Figure 11.
l-Arginine availability and transport regulate expression of pro-inflammatory and anti-inflammatory cytokines in infected macrophages. THP-1 monocyte-derived MΦs (1 × 10⁶ cells/ml) were grown in l-arginine-supplemented and l-arginine-depleted RPMI medium followed by infection with Leishmania donovani (multiplicity of infection 1:10) for 48 h (A,B). In a separate experiment, THP-1 MΦs (1 × 10⁶ cells/ml) were either left untreated or preincubated with 250 μM NEM for 10 min followed by infection with L. donovani for 48 h (C,D). In another experiment, THP-1 MΦs (1 × 10⁶ cells/ml) were transfected with control siRNA, CAT-1, or CAT-2 siRNA followed by infection with L. donovani for 48 h (E,F). The expression of IL-10, IL-12, and TNF-α were determined at the transcript level by semi-quantitative RT-PCR (A,C,E) and quantitative real-time PCR (B,D,F). The intensity of the bands was quantified by densitometry in Quantity one software. Each experiment was repeated three times. Each determination was made in triplicate and the values were expressed as mean ± SD for three independent experiments. Semi-QRT PCR gel images are representative of three experiments. Densitometric plots are shown below the gel images. Kruskal–Wallis with Dunn's multiple comparison test was used to evaluate statistical significance for comparing three or more groups; *p < 0.05; **p < 0.005; ns, non-significant.
The authors apologize for this error and state that this does not change the scientific conclusions of the article in any way. The original article has been updated.


