

Abstract
In shale gas reservoirs, CH4 and CO2 have finite aqueous solubilities at high-pressure conditions and their dissolutions in water affect the determination of the original gas in place and the CO2 sequestration. In addition, the dissolution of CO2 decreases the pH of connate water, and the geochemical reactions may thus occur in carbonate-rich shale reservoirs. The comprehensive simulations of this work quantify the effects of aqueous solubility and geochemistry on the performance CO2 huff-n-puff process in shale gas reservoir. Accounting for the aqueous solubility of CH4 increases the initial natural gas storage and natural gas production. The effect of the aqueous solubility of CO2 enables to sequester additional CO2 via solubility trapping. Considering the geochemical reactions, the application of the CO2 huff-n-puff process causes the dissolution of carbonate minerals and increases the porosity enhancing the gas flow and the gas recovery. Incorporation of geochemistry also predicts the less CO2 sequestration capacity. Therefore, this study recommends the consideration of aqueous solubility and geochemical reactions for the accurate prediction of gas recovery and CO2 sequestration in shale gas reservoirs during the CO2 huff-n-puff process.
Subject terms: Natural gas, Carbon capture and storage
Introduction
Significant shale gas is reported to be distributed in the U.S. as well as Canada1–4. The Energy Information Administration reported that shale gas resources in U.S. are estimated to be 308 trillion cubic feet5. The gas production from shale gas and tight oil reservoirs is approximately half of the total gas production in the U.S. The U.S. dry natural gas production exceeded the U.S. natural gas consumption in 2017. In the shale formations, the methane occupies more than 94% of the total gas and it is stored via a number of forms such as adsorption, free, and dissolution within the pore structure6–8. The development of horizontal wells and multistage fracturing technologies allows the rapid expansion of natural gas production from shale reservoirs, but the production is primarily attributed to free gas obtained through the fracture network which connects separated fractures. The shale reservoirs contain organic matter and a fraction of the initial gas storage is attributed to the adsorption of CH4 on the internal surface areas of organic matter. The physical adsorption on both the organic matter and clays contributes to a fraction of initial natural gas storage6,9. However, natural depletion process with the use of the technologies (horizontal wells and multistage fracturing) hardly recovers the adsorbed gas from shale reservoirs. The rapid decline in gas production within a few years is indicative of the low production of the adsorbed shale gas via natural depletion.
The development of enhanced gas recovery (EGR) methodologies is required to overcome the low production of natural depletion process and to produce a remained CH4 via the adsorption mechanism from shale formations. The CO2 injection has been proposed as a promising EGR technology to accelerate the CH4 desorption by encouraging the CO2 adsorption in the organic-rich shale system. While the adsorptions of CH4 and CO2 depend on the conditions of shale formation, CO2 has a higher potential of adsorption than CH4. Considering the competitive adsorption behaviors of CO2 and CH4, extensive studies have investigated the EGR of CO2 injection in shale gas formations10–15. In addition, shale gas formation is proposed as a potential option for sequestrating CO216. The CO2 injection is an attractive EGR incorporating CO2 storage in shale gas formations10,16–19. Experimentally, a number of factors (adsorption behaviors of CH4 and CO2, pore size distribution, geochemical reactions, fracturing, and wettability) have been evaluated for storing CO2 in shale formations20–24.
Extensive studies thoroughly investigated the potentials of EGR and CO2 sequestration via CO2 injection for shale gas reservoirs. Many studies10–15,17,19–29 numerically demonstrated the potentials in shale formations. However, they ignored some factors of considerable importance affecting the storage and transport of CO2 and CH4 during the CO2 injection into the shale gas formation. The studies10–15,17,19–29 neglected the solubilities of CH4 and CO2 in the formation water, which affect the gas storage of CH4 and CO2 in shale gas reservoirs. In addition, the effect of the geochemical reactions on the EGR and CO2 sequestration has not been investigated in the numerical studies10–15,17,19–29. Experimental studies22,30–32 have explored the role of geochemical reactions in shale formations. The study22 designed the characterization method consisting of optical microscope, X-ray diffraction, element analysis, low-pressure gas adsorption, and Fourier transform infrared spectroscopy to access geochemical changes when CO2 was injected into carbonate-rich shale rock samples. It was observed that CO2 dissolution in brine decreased the pH of brine resulting in mineral reactions and pore structure change. Another study32 also observed carbonate mineral dissolution in the system of carbonate-rich shale/formation water/CO2 by in-situ Fourier transform infrared spectroscopy. The experimental studies clarified the geochemical reactions in the system of carbonate-rich shale/formation water/CO2 and observed the changes in physical properties of shale rock samples. However, the experimental studies have not quantified the effect of geochemical reactions on EGR and CO2 storage during CO2 injection for shale gas reservoirs.
Therefore, it is necessary to advance the understanding of CO2 injection in tight shale reservoirs by implementing potential factors into the numerical simulations: (1) aqueous solubilities of CO2 and CH4 and (2) chemical reactions occurred in the system of gas/brine/shale formation. In this numerical study, an improved model of the CO2 injection has been developed to account for the solubilities of CO2 and CH4 in formation water and geochemical reactions in the shale gas reservoirs. The effects of potential factors on the EGR and CO2 storage have been analyzed with a series of runs with the developed model. The developed model is examined in the Eagle Ford shale gas reservoirs which have a high fraction of carbonate minerals. The Eagle Ford shale play is late Cretaceous in age and is located in the South Texas, USA33,34. It is 50 miles wide and 400 miles long and covers the 23 counties in South-Central Texas. Its depth varies between 2,500 ft and 14,000 ft and thickness ranges from 120 ft to 350 ft. The Eagle Ford shale consists of Cretaceous mudstone and carbonate that are the source rock for the Austin Chalk formation. The carbonate content of the Eagle Ford shale varies. According to Hsu and Nelson33, an average carbonate content of 10% was reported based on 119 samples. The EIA34 reported 40–90% carbonate minerals content in the Eagle Ford formation. For the carbonate-rich shale formation, this study simulates the improved model of the CO2 injection and investigates the roles of the potential factors on the EGR and CO2 sequestration of CO2 injection.
Mathematical Formulations
Adsorption
The multi-component adsorption from the gas phase on the reservoir rocks could be modeled based on an extended Langmuir isotherm model. The extended Langmuir isothermal model of CO2 and CH4 is a function of pressure and is described in Eq. 1.
| 1 |
where k and i indicate the component, e.g., CO2 and CH4; ωk denotes the moles of the adsorbed component k per unit mass of rock; ωk, max is the maximum number of moles of adsorbed component k per unit mass of rock; p is the pressure; yi, g is the molar fraction of the adsorbed component k in the gaseous phase; and B is a parameter of extended Langmuir isotherm model.
Solubility in water
The gaseous components (CO2 and CH4) could dissolve in water at the high pressure condition. In shale gas reservoirs, a fraction of CH4 might dissolves in formation water. Once the CO2 is injected into the water-bearing gas reservoir, the CO2 dissolves in the water as well. In this system, the aqueous solubilities of CO2 and CH4 are determined by equating their fugacities in the aqueous and gaseous phases (Eq. 2). While the Peng-Robinson equation of state (PR-EoS) determines the fugacities of gaseous components in the gaseous phase, Henry’s law calculates their fugacities in the aqueous phase (Eq. 3). Introducing the Henry’s law constant, it determines the amount of dissolution in the aqueous phase at specific temperature and pressure conditions (Eq. 4). Harvey35 published the correlations of Henry’s law constants for CO2 and CH4 (Eqs. 5 and 6). In addition, solubilities of CO2 and CH4 in aqueous phase are affected by the aqueous salinity. The relationship between solubility and salinity is formulated by introducing a salting-out coefficient (Eq. 7). The Henry’s law constants of CO2 and CH4 at specific salinity are determined by incorporating their Henry’s law constants in pure water and salting-out coefficients. The correlations predicting the salting-out coefficients of CO2 and CH4 are developed as shown in Eqs. 8 and 936.
| 2 |
| 3 |
| 4 |
| 5 |
| 6 |
| 7 |
| 8 |
| 9 |
where fi,j indicates the fugacity of species i, i.e., CO2 and CH4, in phase j; Hi is Henry’s law constant for species i; xi is the mole fraction of species i in the aqueous phase; is the Henry’s law constant at the saturation pressure of H2O, temperature, and zero salinity; is the saturation pressure of H2O; is the partial molar volume of species i; is the reduced temperature of H2O; is the Henry’s law constant at the specific salinity condition; is the salting-out coefficient; msalt is the molaltiy of the dissolved salt; and and T are the temperatures with °C and K.
Geochemical reactions
During CO2 injection, a fraction of dissolved CO2 in water may react with water. It would produce H+ and lower pH via aqueous reactions. Because the Eagle Ford reservoir has a high content of carbonate minerals, significant dissolution of carbonate minerals may occur at low-pH conditions. Therefore, it is important to consider the major geochemical reactions, including the aqueous and mineral reactions. The mathematical formulations and database of the geochemical reactions are referred from the works36–39. The aqueous reaction is a homogeneous reaction, thus implying that the reactions occur only in the aqueous phase. In aqueous reactions, ions may either form complexes with other ions, or aqueous complexes may decompose to form ions. Because the aqueous reaction is fast, it obeys the law of mass action introducing the ion activity product (Eqs. 10 and 11). The acitivity of ion, i.e., an effective concentration of ion, is defined as a function of acitivity coefficient and molality of ion (Eq. 12). The B-dot model is employed to calculate the acitivity coefficient incorporating ionic strength and charge of the ion (Eq. 13).
| 10 |
| 11 |
| 12 |
| 13 |
where denotes aqueous reaction; is the equilibrium constant of aqueous reaction; is the ion activity product of aqueous reaction; is the number of reactions between components in aqueous phase; i indicates the component of aqueous reaction; is the total number of components in the aqueous phase; is the number of gaseous components that are soluble in the aqueous phase; is the aqueous components that exist only in the aqueous phase; ai is the activity; is the ionic activity coefficient; mi is the molality; I is the ionic strength; is the charge of the ion; is the ion size parameter; and , , and are the temperature-dependent parameters.
The mineral reaction of dissolution or precipitation is a heterogeneous reaction involving multiple phases, i.e., the solid and aqueous phases. Because the mineral reaction is a slow kinetic reaction, it requires enough time to achieve the equilibrium state in accordance with the rate law (Eqs. 14 and 15).
| 14 |
| 15 |
where β denotes mineral reaction; is the mineral reaction rate; is the reaction rate constant of mineral reaction; is the reactive surface area of a mineral; is the solubility product constant of the mineral reaction; Qβ is the ion activity product of the mineral reaction; Rmn is the number of reactions between minerals and aqueous components; k indicates the component in mineral reaction; is the number of mineral components; is the activity of component k; and is the stoichiometric coefficient of the mineral reaction.
The mineral reaction generates or consumes the aqueous species in water. The formation/consumption rate of the aqueous species depends on the mineral reaction rate (Eq. 16). In addition, the mineral dissolution or precipitation changes the pore volume of the reservoir. The change in the total moles of the mineral results in the change of the pore volume, i.e., porosity (Eq. 17). The increasing or decreasing porosity also affects the permeability of the reservoir (Eq. 18).
| 16 |
| 17 |
| 18 |
where is the stoichiometric coefficient of the mineral reaction; is the consumption or production rate of ionic species in brine owing to the mineral reaction; ϕ0 and ϕ are the porosities before and after mineral reaction; and Nβ are the total moles of mineral per bulk volume before and after mineral reaction; ρβ is the mineral molar density; and k0 and k are the permeabilities before and after mineral reaction.
Numerical Simulations
This study uses the GEMTM software, developed by CMG Ltd, to simulate multi-phase and multi-component flows coupled with aqueous solubility and geochemical reactions. The target reservoir is constructed based on the published studies of the Eagle Ford shale gas reservoir11,40–42. A description of the reservoir is represented in Fig. 1. The reservoir’s dimensions are 2,500 × 1,050 × 200 ft3. It is discretized with 50 × 11 × 1 grid blocks. The horizontal well and hydraulic fracturing technologies are simulated in the reservoir. A total of 10 sets of transverse fractures are induced in the reservoir along with the horizontal well. This study simulates only one stage of the hydraulically fractured stimulated reservoir based on symmetry to save computation time and storage. The properties of the system are described in Table 1. The size of the fractured width is assumed to be equal to 0.001 ft referring the Rubin’s work41. The extended Langmuir adsorption model is used to describe the adsorptions of CH4 and CO2 on the rock surface. The parameters of the model are listed in Table 243.
Figure 1.

Schematic of the shale gas reservoir and its dimensions.
Table 1.
Reservoir properties.
| Properties | Values |
|---|---|
| Depth | 8,608 ft |
| Reservoir pressure | 6,568 psia |
| Reservoir temperature | 242°F |
| Matrix permeability | 1 × 10⁻⁴ md |
| Fracture permeability | 8 × 10⁻² md |
| Matrix porosity | 6 × 10⁻² |
| Fracture porosity | 1 × 10⁻⁵ |
| Hydraulic fracture at half-length | 500 ft |
| Hydraulic fracture spacing | 250 ft |
| Hydraulic fracture conductivity | 83.3 md·ft |
Table 2.
Parameters of adsorptions of CH4 and CO2.
| Components | Parameters | Values |
|---|---|---|
| CH4 | Langmuir pressure (pL) | 694.7 psia |
| Langmuir volume (VL) | 12.7 scf/ton | |
| CO2 | Langmuir pressure (pL) | 409.6 psia |
| Langmuir volume (VL) | 33.1 scf/ton |
The CO2 huff-n-puff process is adopted as the CO2 injection to enhance natural gas production from shale reservoir. Prior to the execution of the CO2 huff-n-puff process, natural depletion process recovers the gas over a two-year period. When the gas production by natural depletion becomes negligible, the CO2 huff-n-puff process is deployed for the next two-year period. The bottom-hole pressure of the producer is set to 1,875 psi. During the CO2 huff-n-puff, the CO2 is injected with 2 MMscf/day until the bottom-hole pressure of the injector reaches 9,000 psi. A total of 12 cycles of CO2 huff-n-puff are designed. Each cycle comprises two processes for two months—CO2 injection for one month and production for another month.
Results
This study consists of two sections: (1) simulations incorporating aqueous solubilities of CO2 and CH4 and (2) simulations coupled with geochemistry. The first section of the simulations investigates the effect of aqueous solubility on the hydrocarbon production and CO2 sequestration during the CO2 huff-n-puff process. The second section quantifies the effect of the geochemical reactions—which is attributed to the CO2 dissolution in water—on the performance of the CO2 huff-n-puff process in the shale gas reservoir.
CO2 huff-n-puff process and consideration of the aqueous solubility
The original gas in place (OGIP) is initially determined to be equal to 6.7 × 10⁸ moles. This corresponds to 563.5 MMscf of which free and adsorbed gases respectively occupy 94.1% and 5.9% of OGIP. For a comparison to the simulation of the CO2 huff-n-puff process, the primary recovery process of natural depletion is simulated for a period of four years. Figure 2 describes the cumulative gas production of CH4 from the shale reservoir. The primary recovery process recovers 70% of OGIP. During the pressure depletion, 21% of adsorbed CH4 is produced and it corresponds to 1.7% of the total CH4 production (Figs. 2 and 3A). Most of the gas production is attributed to the production of free CH4 gas. Because the free gas production is relatively fast, the gas production rate significantly decreases after one year. The rapid decline in the early production initiates the CO2 huff-n-puff process. Firstly, the simulation of the CO2 huff-n-puff process neglects the aqueous solubility and it is the base case of the CO2 huff-n-puff process. The CO2 injection would pressurize the depleted reservoir and cause more desorption of CH4 due to the increasing adsorption of CO2 (Fig. 3). The CO2 huff-n-puff process injects 734.5 MMscf of CO2 (or equivalently 8.8 × 10⁸ mol), and 10.1% of the injected CO2 is adsorbed on the rock surface (Fig. 3B). As a result, the CO2 huff-n-puff process produces a total 84.7% of OGIP, which corresponds to a 14.7% higher production of OGIP than the primary recovery process for four years (Fig. 2). The CO2 huff-n-puff process introduces two effects of more CH4 desorption and re-pressurization, thereby enhancing gas recovery over primary recovery process. The CH4 desorption caused by CO2 adsorption is responsible for 5.2% of the OGIP, and corresponds to 87.4% of the initial amount of the adsorbed CH4 (Fig. 3A). Re-pressurization by CO2 injection contributes enhanced gas production as much as 9.5% of the OGIP. The CO2 huff-n-puff process is also effective in storing CO2 in the depleted reservoirs. This simulation observes that 45.1% and 10.1% of injected CO2 are sequestrated by geological and adsorption trappings, respectively (Figs. 3B and 4).
Figure 2.
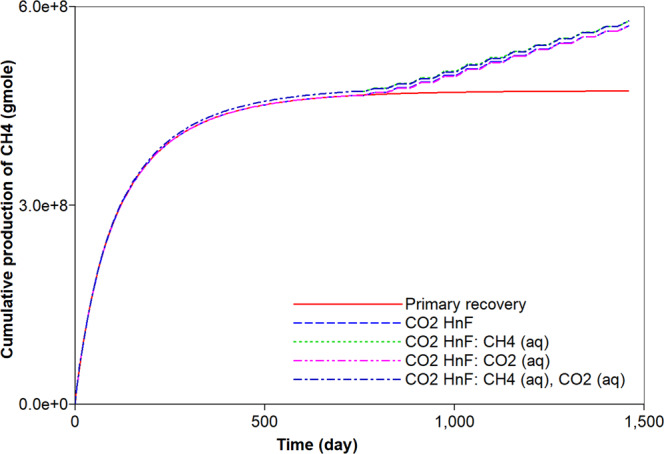
Effects of aqueous solubility of CO2 and CH4 on cumulative gas production (mole) during primary recovery and CO2 huff-n-puff processes.
Figure 3.
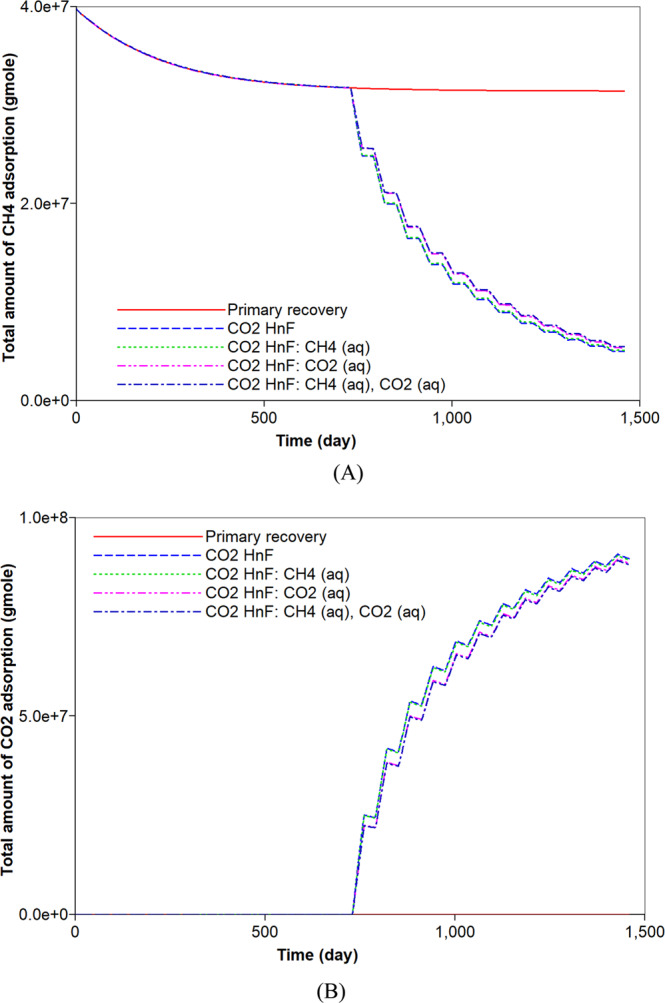
Effects of aqueous solubility of CO2 and CH4 on the adsorption (moles) of (A) CH4 and (B) CO2 during primary recovery and CO2 huff-n-puff processes.
Figure 4.
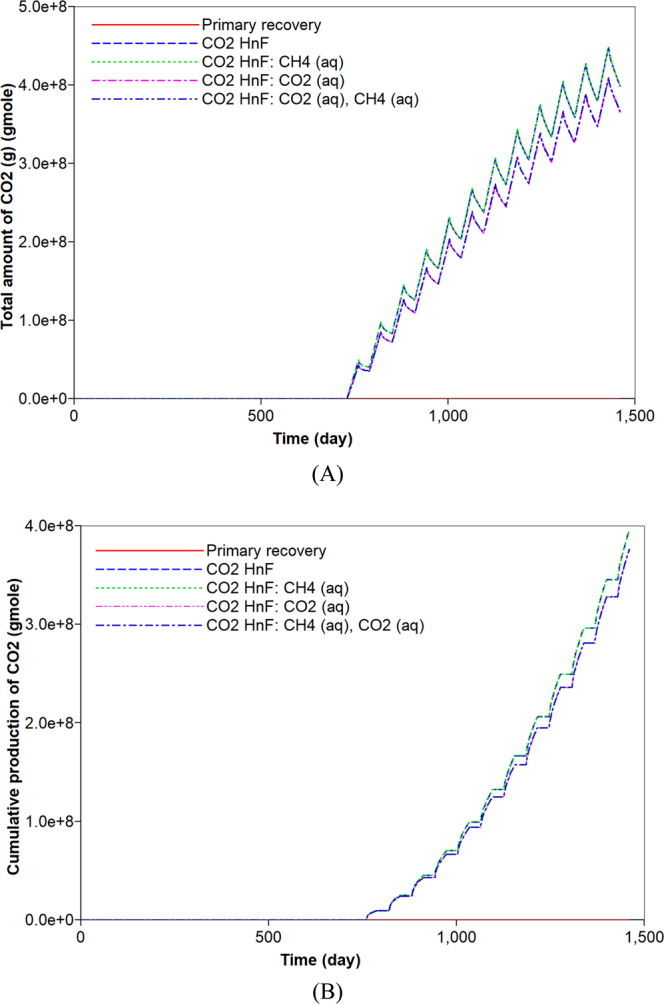
Effects of aqueous solubility of CO2 and CH4 on (A) CO2 storage by free gas (moles) in a shale reservoir and (B) cumulative production (moles) of CO2 during primary recovery and CO2 huff-n-puff processes.
Generally, CH4 can dissolve in water owing to high pressure condition. Because high-pressure conditions exist within the reservoir, ignoring the aqueous solubility of CH4 leads to the underestimation of the initial OGIP in shale formations. When the initial gas storage process takes into consideration the mechanism of the aqueous solubility of CH4, the initial OGIP slightly increases by 1.9%. Because the dissolved CH4 in water is gasified by pressure depletion, it can be recovered (Fig. 5A). The CO2 huff-n-puff process is simulated in the system. The desorption of CH4 does not change, regardless of the aqueous solubility of CH4 (Fig. 3A). As a result, the CO2 huff-n-puff process that has accounted for the aqueous solubility of CH4 recovers 1.3% more CH4 compared to the base case (Fig. 2). The increase in the production is fully attributed to an increase in the OGIP owing to the aqueous solubility of CH4 (Fig. 5A). In addition, the aqueous solubility of CH4 hardly influence the potential of CO2 sequestration compared to the base case (Fig. 4B).
Figure 5.
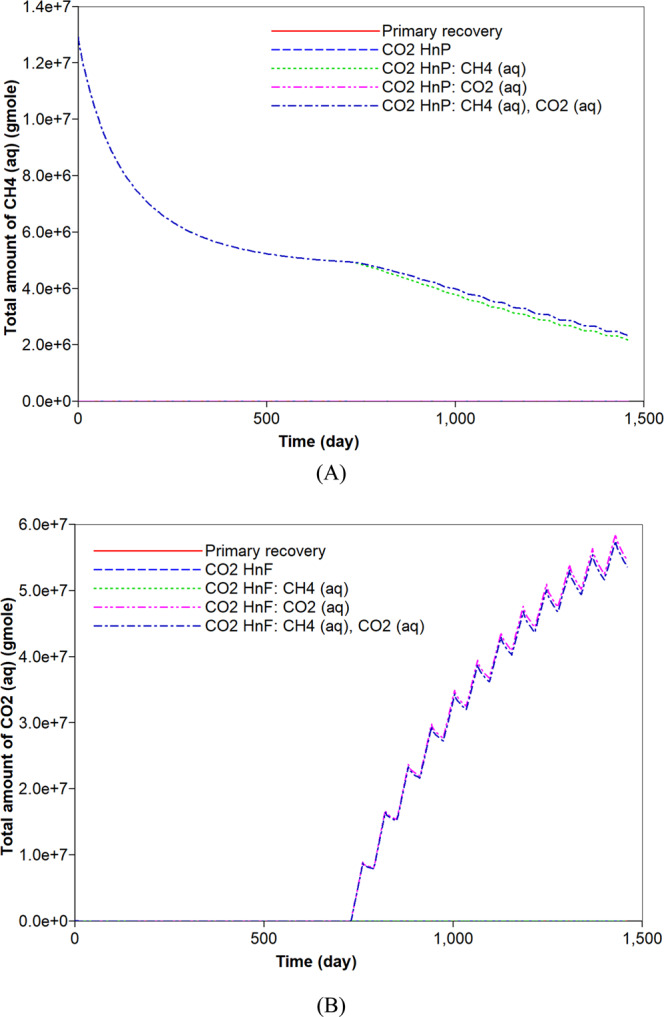
Effects of aqueous solubility of CO2 and CH4 on the dissolved (A) CH4 (moles) and (B) CO2 (moles) in water during primary recovery and CO2 huff-n-puff processes.
CO2 is also soluble in water. Its solubility is higher than that of CH444. When the aqueous solubility of CO2 is accounted for in the simulation of the CO2 huff-n-puff process, there is a negligible change in the total hydrocarbon production compared to the base case (Fig. 2). However, the capacity of CO2 storage would be increased, and the less production of CO2 is observed (Fig. 4B). In this simulation, 41.2% and 10.1% of the injected CO2 are sequestrated in the geological and adsorption forms, respectively (Figs. 3B and 4A). In addition, 6.2% of the injected CO2 is captured based on an aqueous solubility mechanism (Fig. 5B) that constitutes one of the CO2 storage mechanisms45. Compared to the previous simulation that accounts for the aqueous CH4 solubility, the simulation that accounts for the aqueous solubility of CO2 leads to a smaller storage of CO2 via geological and adsorption trappings (Figs. 3B and 4A), but stores additional CO2 based on aqueous solubility (Fig. 5B). When the simulation of the CO2 huff-n-puff process considers the aqueous solubilities of CH4 and CO2, increasing CH4 production and CO2 sequestration are obtained comparing to the base case (Figs. 2, 3B, 4B and 5B).
CO2 huff-n-puff coupling with geochemistry
Previous simulations investigate the effect of the aqueous solubility on the gas recovery and CO2 sequestration during the CO2 huff-n-puff process in the shale formation. Once the CO2 dissolves in brine with a decreasing pH, geochemical reactions occur in carbonate-rich shale reservoirs. This section explores the role of geochemistry on the performance of the CO2 huff-n-puff process in carbonate-rich shale reservoirs. Table 3 lists the geochemical reactions of the aqueous and mineral reactions for their implementations in the simulations. The reservoir is assumed to have 30% of carbonate minerals (calcite, dolomite, and magnesite) to represent a carbonate-rich shale reservoir. Simulations of the primary recovery and the CO2 huff-n-puff processes are conducted for the shale reservoir once the geochemical reactions have been incorporated in the simulation framework. The findings are compared to those obtained from the base case, which is the simulation of the CO2 huff-n-puff process based on the consideration of the aqueous solubility of CO2 (but not based on geochemistry). Additional application of the CO2 huff-n-puff process pertaining to the reservoir which has no carbonate mineral is simulated to quantify the role of the mineral. Lastly, the effect of the aqueous solubility of CH4 is also confirmed when the CO2 huff-n-puff process has accounted for geochemistry and is deployed in the carbonate-rich shale gas reservoir.
Table 3.
Geochemical reactions.
| Reactions | |
|---|---|
| Aqueous reactions | CO2 + H2O↔H+ + HCO3− |
| H+ + OH−↔H2O | |
| H+ + CaOH+↔Ca2+ + HCO3− | |
| CaHCO3+↔Ca2+ + HCO3− | |
| CaSO4↔Ca2+ + SO42− | |
| Mineral reaction | Calcite + H+↔Ca2+ + HCO3− |
| Dolomite + H+↔Ca2+ + Mg2+ + 2HCO3− | |
| Magnesite + H+↔Mg2+ + HCO3− |
First, the simulation results of the carbonate-rich shale reservoir are analyzed. Prior to the CO2 huff-n-puff process, the precipitation of carbonate minerals mainly occurs during the natural depletion process (Fig. 6). The precipitation of carbonate minerals slightly decreases the pore volume of the reservoir, but the effect of the rock’s compressibility owing to the pressure depletion overwhelmingly decreases the pore volume (Fig. 6). Once the CO2 huff-n-puff process is initiated, the dissolution of CO2 in water produces H+ and decreases pH (Fig. 7A). In low-pH conditions, carbonate minerals dissolve. The mineral dissolution leads to an increase in the pore volume (Fig. 6). During the CO2 huff-n-puff process, the pore volume of the reservoir is still lower than initial volume despite of re-pressurization. The dissolution of carbonate minerals enlarges the pore volume, i.e., the porosity (Fig. 7B). This is equivalent to a minor increase in the permeability of the matrix. The behaviors of adsorption and desorption of CH4 and CO2 hardly change regardless of geochemistry (Fig. 8). As a result, the simulation of the CO2 huff-n-puff process incorporating geochemistry recovers additional amount of CH4 by 1.7% compared to the base case (Fig. 9). The increase in the gas production is attributed to the dissolution of carbonate minerals enlarging the porosity during the CO2 huff-n-puff process. This can be confirmed by comparing these findings to the simulation findings of the CO2 huff-n-puff process for the reservoir which contains no carbonate minerals. When the process is deployed into the reservoir, any increase in the cumulative production is not observed (Fig. 9). When the CO2 huff-n-puff process incorporating the aqueous solubility of CH4 as well as geochemistry is simulated in the carbonate-rich shale formation, the cumulative production of CH4 is increased by 2.6% compared to the base case (Fig. 9). Because the geochemical reactions and aqueous solubility of CH4 negligibly affect the adsorption and desorption of CO2 and CH4 (Fig. 8), an increase in hydrocarbon production is attributed to an increase in the initial OGIP owing to the solubilized CH4 in water, and to the porosity changes owing to dissolution of carbonate minerals.
Figure 6.
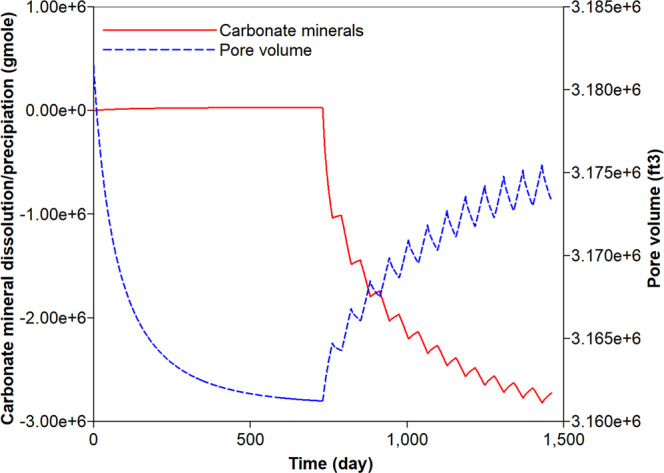
Dissolution/precipitation of carbonate minerals (moles) and pore volume (ft3) of shale reservoir during the CO2 huff-n-puff process considering geochemistry.
Figure 7.

Distribution of (A) pH and (B) porosity change in the shale reservoir after the CO2 huff-n-puff process considering geochemistry.
Figure 8.
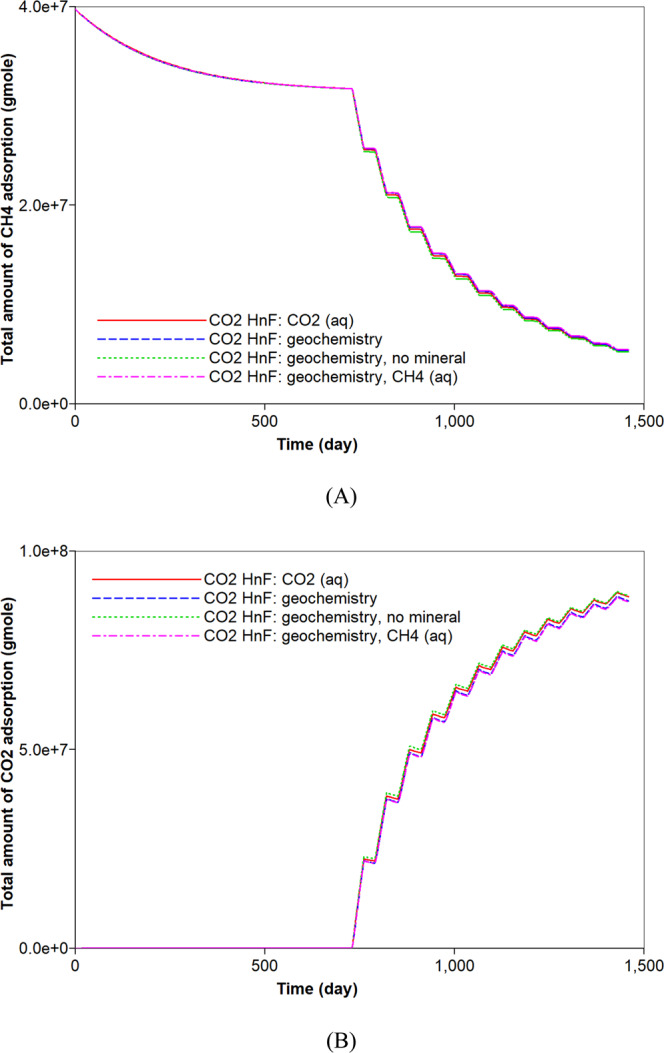
Effects of aqueous solubility and geochemistry on the adsorption (moles) of (A) CH4 and (B) CO2 during CO2 huff-n-puff processes.
Figure 9.
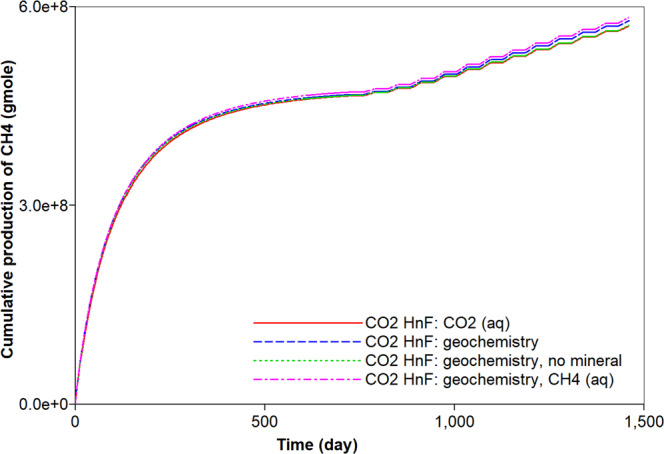
Effects of aqueous solubility and geochemistry on cumulative gas production (moles) of CH4 during CO2 huff-n-puff processes.
The mineral dissolution influences the concentration of ions in water. It produces HCO3− in water buffering pH of in-situ brine. When the reservoir has no carbonate minerals, higher concentrations of H+ and lower concentrations of HCO3− are observed during the CO2 huff-n-puff process (Fig. 10). The geochemical reactions also affect the CO2 storage capacity. Precipitation of carbonate minerals contributes to the long-term CO2 sequestration that constitutes one of the CO2 storage mechanisms45. The dissolution of carbonate minerals observed in the CO2 huff-n-puff process is unfavorable to the CO2 storage. In addition, the dissolved CO2 in water via solubility trapping mechanism can exist in different forms of carbon dioxide complexes, e.g., HCO3−, CaHCO3+. As a result, the CO2 huff-n-puff process with geochemistry sequesters a smaller amount of CO2 in water (approximately 14.6%) compared to the base case (Fig. 11A). Because there is a negligible change in the adsorption of CO2 (Fig. 8B), a smaller CO2 storage in water mainly causes an increased CO2 production of up to 8.6% (Fig. 11B). When the reservoir has no carbonate minerals, the sequestered CO2 in water decreases by at most 13.2% compared to the simulation result with the carbonate-rich shale reservoir (Fig. 11A). A smaller production of CO2 (up to 6.0%) is expected when the reservoir does not contain any carbonate minerals (Fig. 11B). Lastly, simulations investigate whether the aqueous solubility of CH4 affects the CO2 storage of CO2 huff-n-puff process considering geochemistry or not. Because the aqueous dissolution of CH4 has no impact on the geochemical reactions, it hardly affects the capacity of CO2 sequestration (Fig. 11B).
Figure 10.
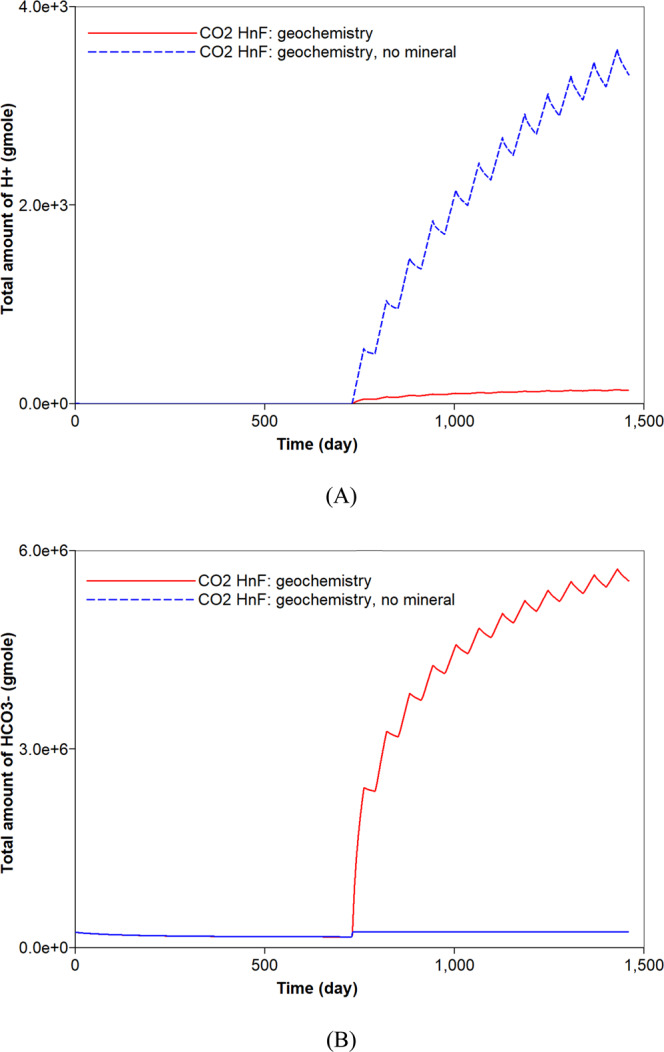
Effect of mineral reactions on the total amount (moles) of (A) H+ and (B) HCO3− in the shale reservoir during CO2 huff-n-puff processes considering geochemistry.
Figure 11.
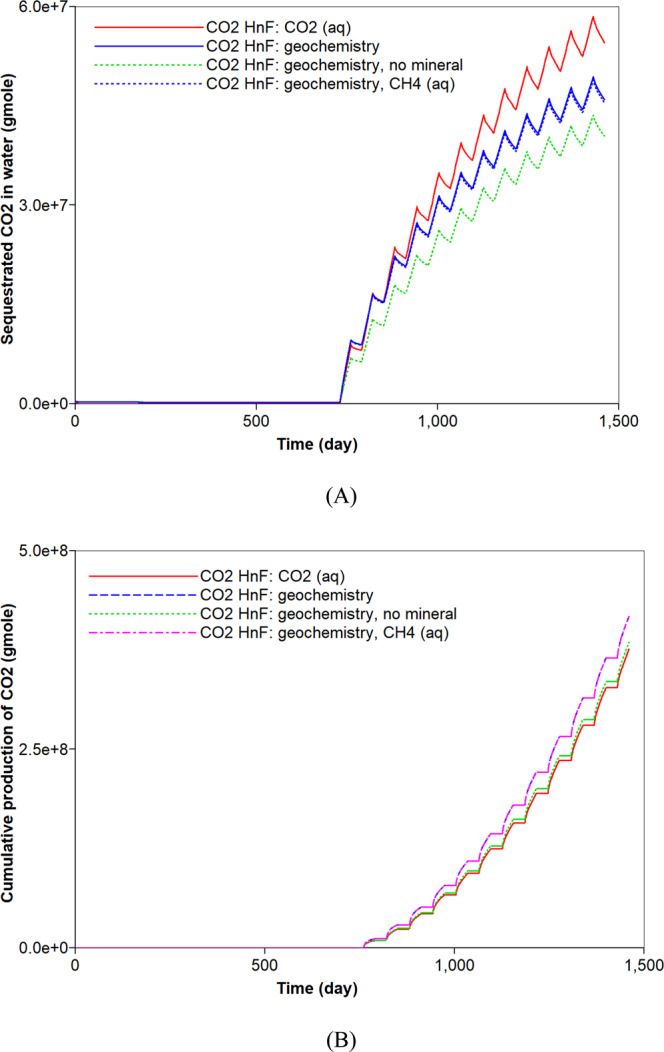
Effects of aqueous solubility and geochemistry on the (A) dissolved CO2 (moles) in water and (B) cumulative production (moles) of CO2 during CO2 huff-n-puff processes.
Conclusions
This study assessed the hydrocarbon recovery and CO2 storage during the CO2 huff-n-puff process in shale gas reservoirs. It explored the roles of aqueous solubility and geochemistry on the performance of the CO2 huff-n-puff process. The following conclusions have been drawn based on the findings of the numerical study.
While most of the OGIP in the shale gas reservoir consisted of free gas and the adsorbed CH4, neglecting the aqueous solubility of CH4 was shown to underestimate the OGIP by 1.9% and gas recovery by 1.3%. Because the dissolved CH4 in water can be recoverable during the natural depletion and the CO2 huff-n-puff process, accurate prediction of the hydrocarbon recovery required the consideration of the aqueous solubility of CH4.
Consideration of the aqueous solubility of CO2 did not affect the gas recovery of CH4 from the shale formation. However, it sequestered additional 6.1% of injected CO2 in the shale formation via the aqueous solubility. During the CO2 huff-n-puff process, accurate prediction of CO2 sequestration should consider storing CO2 via forms of geological trapping, adsorption, and solubility trapping in depleted shale formation.
With the incorporation of geochemistry in the simulation of the CO2 huff-n-puff process, the dissolution of CO2 promoted the recovery of CH4 from the carbonate-rich shale gas reservoir. Once the CO2 dissolved in water, the pH of brine decreased and the dissolution of carbonate minerals occurred in low-pH condition. This resulted in a slight increase in the pore volume, i.e., porosity, and in a parallel increase in permeability, and then an increase in the hydrocarbon production of the order of 2.6% was obtained. Therefore, it is necessary to consider the effect of geochemistry for accurate prediction of shale gas production of CO2 huff-n-puff in carbonate-rich shale formations.
Ignoring the geochemical reactions was associated with the risk of overestimating the CO2 sequestration during the CO2 huff-n-puff process. Because of the geochemical reactions, dissolved CO2 can be sequestered into the forms of carbon dioxide complexes in water. Therefore, consideration of the geochemical reaction predicted a smaller potential of CO2 sequestration by 14.6% during the CO2 huff-n-puff process in the depleted shale gas reservoir.
Acknowledgements
This work was financially supported by the Energy Efficiency & Resources of the Korea Institute of Energy Technology Evaluation and Planning (KETEP) grant funded by the Korea government Ministry of Knowledge Economy (No. 20172510102290).
Author contributions
Ji Ho Lee designed the overall study and analyzed the results of this numerical work. Ji Ho Lee and Jinhyung Cho reviewed and revised the manuscript. Kun Sang Lee supervised the work.
Competing interests
The authors declare no competing interests.
Footnotes
The original online version of this Article was revised: The original version of the Article contained an error in the Author Information section, where the statement of equal contribution was implemented erroneously: “These authors contributed equally: Ji Ho Lee, Jinhyung Cho and Kun Sang Lee.”. Ji Ho Lee is the first author, Jinhyung Cho is the second author and Kun Sang Lee is the corresponding author of this Article.
Publisher’s note Springer Nature remains neutral with regard to jurisdictional claims in published maps and institutional affiliations.
Change history
12/27/2021
A Correction to this paper has been published: 10.1038/s41598-021-04141-7
References
- 1.Montgomery SL, Jarvie DM, Bowker KA, Pallastro RM. Mississippian Barnett Shale, Fort Worth basin, north-central Texas: gas-shale play with multi-trillion cubic foot potential. AAPG Bull. 2005;89:155–175. doi: 10.1306/09170404042. [DOI] [Google Scholar]
- 2.Jarvie DM, Hill RJ, Ruble TE, Pollastro RM. Unconventional shale-gas systems: the Mississippian Barnett Shale of north central Texas as one model for thermogenic shale-gas assessment. AAPG Bull. 2007;91:475–499. doi: 10.1306/12190606068. [DOI] [Google Scholar]
- 3.Chalmers GRL, Bustin RM. Lower Cretaceous gas shales in northeastern British Columbia, Part 2: evaluation of regional potential gas resources. Bull Can Petrol Geol. 2008;56(1):22–61. doi: 10.2113/gscpgbull.56.1.22. [DOI] [Google Scholar]
- 4.Ross DJK, Bustin RM. Characterizing the shale gas resource potential of Devonian-Mississippian strata in Western Canada sedimentary basin: application of an integrated formation evaluation. AAPG Bull. 2008;92(1):87–125. doi: 10.1306/09040707048. [DOI] [Google Scholar]
- 5.U.S. Energy Information Administration. U.S. crude oil and natural gas proved reserves, year-end 2017. Washington D.C: U.S. Department of Energy; 2008.
- 6.Rani S, Padmanabhan E, Prusty BK. Review of gas adsorption in shales for enhanced methane recovery and CO2 storage. J Pet Sci Eng. 2019;175:634–643. doi: 10.1016/j.petrol.2018.12.081. [DOI] [Google Scholar]
- 7.Curtis JB. Fractured shale-gas systems. AAPG Bull. 2002;86(11):1921–1938. doi: 10.1306/61EEDDBE-173E-11D7-8645000102C1865D. [DOI] [Google Scholar]
- 8.Bernard S, et al. Multi-scale detection of organic and inorganic signatures provides insights into gas shale properties and evolution. Chem. Erde. 2010;70(S3):119–133. doi: 10.1016/j.chemer.2010.05.005. [DOI] [Google Scholar]
- 9.Clarkson, C. R. & Haghshenas, B. Modeling of supercritical fluid adsorption on organic-rich shales and coal. Paper presented at the SPE Unconventional Resources Conference-USA, The Woodlands, Texas, USA, 10–12 April 2013.
- 10.Eshkalak, M. O., Al-shalabi, E. W., Sanaei, A., Aybar, U. & Sepehrnoori K. Enhanced gas recovery by CO2 sequestration versus re-fracturing treatment in unconventional shale gas reservoirs. Paper presented at Abu Dhabi International Petroleum Exhibition and Conference, Abu Dhabi, UAE, 10-13 November 2014.
- 11.Wan, T., Meng, X., Sheng, J. J. & Watson, M. Compositional modeling of EOR process in stimulated shale oil reservoirs by cyclic gas injection. Paper presented at SPE Improved Oil Recovery Symposium, Tulsa, Oklahoma, USA, 12–16 April 2014.
- 12.Yu, W., Al-Shalabi, E. W. & Sepehrnoori, K. A sensitivity study of potential CO2 injection for enhanced gas recovery in Barnett shale reservoirs. Paper presented at SPE Unconventional Resources Conference, The Woodlands, Texas, USA, 1–3 April 2014.
- 13.Zhang, K. et al. Investigation of CO2 enhanced gas recovery in shale plays. Paper presented at SPE Europec featured at 78th EAGE Conference and Exhibition, Vienna, Austria, 30 May–2 June 2016.
- 14.Santiago, C. J. S. & Kantzas, A. Enhanced recovery by injection of nitrogen and carbon dioxide mixtures in tight reservoirs: a combination of partial pressure reduction and competitive adsorption. Paper presented at SPE Canada Unconventional Resources Conference, Calgary, Alberta, Canada, 13–14 March 2018.
- 15.Zhan, J. et al. A systematic reservoir simulation study on assessing the feasibility of CO2 sequestration in liquid-rich shale gas reservoirs with potential enhanced gas recovery. Paper presented at Offshore Technology Conference Asia, Kuala Lumpur, Malaysia, 20–23 March 2018.
- 16.National Energy Technology Laboratory. Carbon sequestration Atlas of the United States and Canada (fourth ed.), U.S. Department of Energy; 2012.
- 17.Jikich, S. A., Smith, D. H., Sams, W. N. & Bromhal, G. S. Enhanced gas recovery (EGR) with carbon dioxide sequestration: a simulation study of effects of injection strategy and operational parameters. Paper presented at SPE Eastern Regional Meeting, Pittsburgh, Pennsylvania, 6–10 September 2003.
- 18.Godec M, Koperna G, Petrusak R, Oudinot A. Enhanced gas recovery and CO2 storage in gas shales: a summary review of its status and potential. Energy Procedia. 2014;63:5849–5857. doi: 10.1016/j.egypro.2014.11.618. [DOI] [Google Scholar]
- 19.Carpenter, C. Enhanced gas recovery by CO2 sequestration vs. refracturing treatment. JPT; 67(07):125–127, 10.1016/j.egypro.2014.11.618.
- 20.Wang L, et al. CO2 injection-induced fracturing in naturally fractured shale rocks. Energy. 2017;139:1094–1110. doi: 10.1016/j.energy.2017.08.031. [DOI] [Google Scholar]
- 21.Pan B, Li Y, Wang H, Jones F, Iglauer S. CO2 and CH4 wettabilities of organic-rich shale. Energy Fuels. 2018;32(2):1914–1922. doi: 10.1021/acs.energyfuels.7b01147. [DOI] [Google Scholar]
- 22.Pan Y, et al. Experimental investigation of the geochemical interactions between supercritical CO2 and shale: implications for CO2 storage in gas-bearing shale formations. Energy Fuels. 2018;32(2):1963–1978. doi: 10.1021/acs.energyfuels.7b03074. [DOI] [Google Scholar]
- 23.Tripathy A, Srinivasan V, Singh TN. A comparative study on the pore size distribution of different Indian shale gas reservoirs for gas production and potential CO2 sequestration. Energy Fuels. 2018;32(3):3322–3334. doi: 10.1021/acs.energyfuels.7b04137. [DOI] [Google Scholar]
- 24.Zhou J, et al. Influence of supercritical CO2 exposure on CH4 and CO2 adsorption behaviors of shale: implications for CO2 sequestration. Energy Fuels. 2018;32(5):6073–6089. doi: 10.1021/acs.energyfuels.8b00551. [DOI] [Google Scholar]
- 25.Oldenburg CM, Pruess K, Benson SM. Process modeling of CO2 injection into natural gas reservoirs for carbon sequestration and enhanced gas recovery. Energy Fuels. 2001;15(2):293–298. doi: 10.1021/ef000247h. [DOI] [Google Scholar]
- 26.Sun H, et al. Numerical study of CO2 enhanced natural gas recovery and sequestration in shale gas reservoirs. Int J Greenh Gas Control. 2013;19:406–419. doi: 10.1016/j.ijggc.2013.09.011. [DOI] [Google Scholar]
- 27.Liu D, Agarwal R, Li Y. Numerical simulation and optimization of CO2 enhanced shale gas recovery using a genetic algorithm. J Clean Prod. 2017;164:1093–1104. doi: 10.1016/j.jclepro.2017.07.040. [DOI] [Google Scholar]
- 28.Louk K, et al. Monitoring CO2 storage and enhanced gas recovery in unconventional shale reservoirs: results from the Morgan County, Tennessee injection test. J Nat Gas Sci Eng. 2017;45:11–25. doi: 10.1016/j.jngse.2017.03.025. [DOI] [Google Scholar]
- 29.Wan T, Mu Z. The use of numerical simulation to investigate the enhanced Eagle Ford shale gas condensate well recovery using cyclic CO2 injection method with nano-pore effect. Fuel. 2018;233:123–132. doi: 10.1016/j.fuel.2018.06.037. [DOI] [Google Scholar]
- 30.Vankeuren ANP, Hakala JA, Jarvis K, Moore JE. Mineral reactions in shale gas reservoirs: barite scale formation from reusing produced water as hydraulic fracturing fluid. Environ Sci Technol. 2017;51(16):9391–9402. doi: 10.1021/acs.est.7b01979. [DOI] [PubMed] [Google Scholar]
- 31.Pearce JK, Turner L, Pandey D. Experimental and predicted geochemical shale-water reactions: Roseneath and Murteree shales of the Cooper Basin. Int J Coal Geol. 2018;187:30–44. doi: 10.1016/j.coal.2017.12.008. [DOI] [Google Scholar]
- 32.Goodman A, et al. Investigating the role of water on CO2-Utica Shale interactions for carbon storage and shale gas extraction activities – evidence for pore scale alterations. Fuel. 2019;242:744–755. doi: 10.1016/j.fuel.2019.01.091. [DOI] [Google Scholar]
- 33.Hsu SC, Nelson PP. Characterization of Eagle Ford Shale. Eng Geol. 2002;67:169–183. doi: 10.1016/S0013-7952(02)00151-5. [DOI] [Google Scholar]
- 34.U.S. Energy Information Administration. Updates to the EIA Eagle Ford play maps. Washington D.C: U.S. Department of Energy; 2014.
- 35.Harvey AH. Semiempirical correlation for Henry’s constants over large temperature ranges. AIChE Journal. 1996;42:1491–1494. doi: 10.1002/aic.690420531. [DOI] [Google Scholar]
- 36.Bakker RJ. Package FLUIDS 1. computer programs for analysis of fluid inclusion data and for modelling bulk fluid properties. Chem Geol. 2003;194:3–23. doi: 10.1016/S0009-2541(02)00268-1. [DOI] [Google Scholar]
- 37.Parkhurst, D. L. & Appelo, C. A. J. Description of input and examples for PHREEQC version 3—A computer program for speciation, batch-reaction, one-dimensional transport, and inverse geochemical calculations. U.S. Geological Survey; 2013.
- 38.Wolery, T. J. & Daveler, S. A. Equation 6, a computer program for reaction path modeling of aqueous geochemical systems: theoretical manual, user’s guide, and related documentation (version 7.0). Lawrence Livermore National Laboratory (1992).
- 39.Bethke, C. M. Geochemical reaction modelling. NY, USA: Oxford University Press; 1996.
- 40.Bazan, L. W., Larkin, S. D., Lattibeaudiere, M. G. & Palisch, T. T. Improving production in the Eagle Ford Shale with fracture modeling, increased fracture conductivity, and optimized stage and cluster spacing along the horizontal wellbore. Paper presented at Tight Gas Completions Conference, San Antonio, Texas, USA, 2–3 November 2010.
- 41.Rubin, B. Accurate simulation of non Darcy flow in stimulated fractured shale reservoirs. Paper presented at SPE Western Regional Meeting, Anaheim, California, USA, 27–29 May 2010.
- 42.Honarpour, M. M., Nagarajan, N. R., Orangi, A., Arasteh, F. & Yao, Z. Characterization of critical fluid PVT, rock, and rock-fluid properties-impact on reservoir performance of liquid rich shales. Paper presented at SPE Annual Technical Conference and Exhibition, San Antonio, Texas, USA, 8–10 October 2012.
- 43.Heller R, Zoback M. Adsorption of methane and carbon dioxide on gas shale and pure mineral samples. J Unconventional Oil and Gas Resources. 2014;8:14–24. doi: 10.1016/j.juogr.2014.06.001. [DOI] [Google Scholar]
- 44.Danesh, A. PVT and phase behaviour of petroleum reservoir fluids. Amsterdam: Elsevier; 1998.
- 45.Metz, B., Davidson, O., de Coninck, H., Loos, M. & Meyer, L. IPCC Special Report on Carbon Dioxide Capture and Storage. New York: Cambridge University Press; 2005.