Abstract.
When analyzing multidiameter single-fiber reflectance (MDSFR) spectra, the inhomogeneous distribution of melanin pigments in skin tissue is usually not accounted for. Especially in heavily pigmented skins, this can result in bad fits and biased estimation of tissue optical properties. A model is introduced to account for the inhomogeneous distribution of melanin pigments in skin tissue. In vivo visible MDSFR measurements were performed on heavily pigmented skin of type IV to VI. Skin tissue optical properties and related physiological properties were extracted from the measured spectra using the introduced model. The absorption of melanin pigments described by the introduced model demonstrates a good correlation with the co-localized measurement of the well-known melanin index.
Keywords: multidiameter single-fiber reflectance spectroscopy, optical properties, skin, melanin, inhomogeneous, melanin index
1. Introduction
The knowledge of the optical properties of biological tissues is invaluable for medical applications such as optical diagnosis and therapeutic laser procedures.1–3 The optical properties are also the essential inputs when using a light transport model or Monte Carlo simulation to study the propagation of light within a tissue.4,5 For many years, research has focused on using spectroscopic techniques in combination with dedicated mathematic models to extract optical properties of biological tissues. The model of diffuse reflectance spectroscopy (DRS) is generally derived from diffusion theory, in which the sampling depth is relatively deep (millimeter to centimeter) and path lengths of the detected light are relatively long.6,7 To detect local, small-scale changes () in tissue, subdiffusive techniques, such as single-fiber spectroscopy (SFR),8,9 are needed. In contrast to DRS, SFR employs a semiempirical model derived from Monte Carlo simulations.10 SFR enables quantitative determination of the absorption coefficient without prior knowledge of the scattering properties.11 In order to extract the scattering properties of tissue, two or more fiber diameters are needed.3,12 Multidiameter single-fiber reflectance (MDSFR) spectroscopy measurements consist of SFR measurements using different fiber diameters on the same tissue location. The measured reflectance spectrum of each fiber diameter is the product of a reflectance spectrum without absorption and a Lambert–Beer term to account for the effect of absorption:
| (1) |
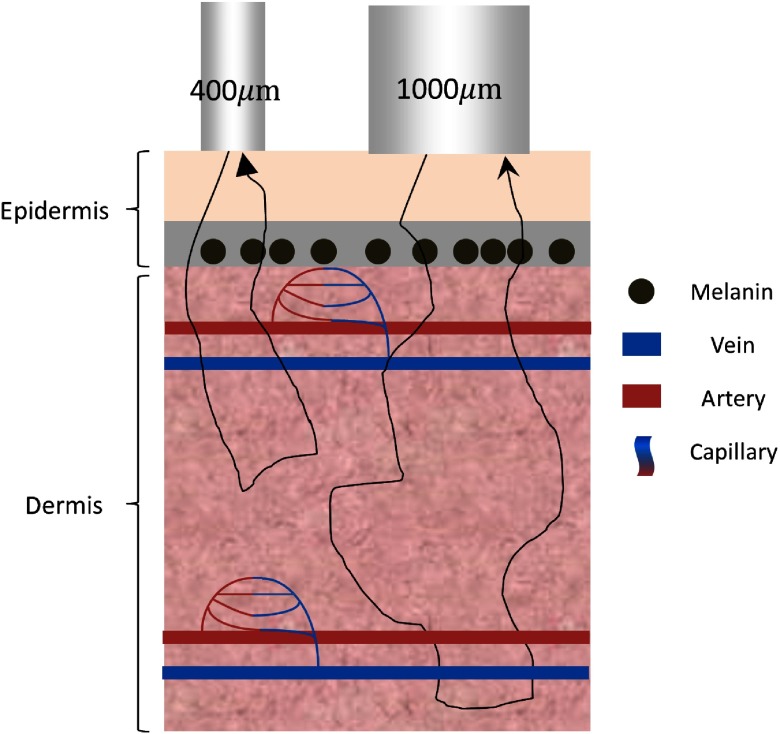
where stands for the absorption coefficient and stands for the effective pathlength of the detected photons using a fiber of diameter .10 To utilize the model mentioned above, it is assumed that the absorbers are distributed homogeneously within the sampling volume. With this assumption, the absorption coefficient is independent of fiber diameters. Biological tissues, however, are far from homogeneous (Fig. 1): blood is mainly confined in blood vessels;13 melanin pigments are only present in the epidermal layer in the skin.14 When the absorbers are distributed inhomogeneously, the absorption coefficient is dependent on the effective pathlength and thus on the fiber diameter. Furthermore, the discrepancy between the homogeneity assumption and exact tissue architecture might result in misinterpretation of tissue optical properties and related biological parameters. Earlier work addressing a similar issue focused on the effects of the inhomogeneous distribution of blood. Correction factors have been derived based on an effective blood vessel diameter that allows accurate evaluation of tissue optical properties.13,15,16
Fig. 1.
Schematic visualization of the interaction between the detected photons and the inhomogeneously distributed absorbers for MDSFR measurements using 400- and diameter fibers.
Using MDSFR to extract scattering and vascular properties of tissue has been intensively validated and utilized on less pigmented skin tissue,3,9,15,17 however, applying MDSFR on heavily pigmented skin tissue might encounter the effect of the inhomogeneous distribution of melanin pigments, which is unaccounted for. Especially in darker skin types, melanin is the dominant absorber in the skin.18 An additional complication with melanin in analyzing MDSFR spectra using the model described [Eq. (1)] is the fact that the absorption spectra of melanin pigments have the same shape as the commonly used model of the reduced scattering coefficient.19 Both the reduced scattering coefficient and the absorption coefficient of melanin pigments decrease smoothly with increasing wavelengths in the visible wavelength range. This similarity leads to a competition between the contribution of the scattering of light and the absorption of melanin pigments when fitting the model to measured data. The competition may lead to unstable fit procedures with highly variable or unrealistic outcomes.
The accurate determination of the contribution of the absorption of melanin pigments in the skin is of great value for skin disease detection and skin color modeling.20,21 To correctly account for the contribution of the inhomogeneously distributed melanin pigments on the measured skin MDSFR spectra and work toward the quantitative analysis of heavily pigmented skin, we introduce a layer model to describe the contribution of the absorption of melanin pigments [Eq. (2)]. The model assumes that all detected photons are independent of their eventual pathlengths and pass through a superficially positioned melanin layer twice: a first time when entering the tissue and a second time just before leaving the tissue. Thus the effect of the absorption of melanin pigments is the same for all detected photons by all fibers used in the MDSFR measurements and is thus independent of the pathlength of all detected photons:
| (2) |
where is the transmission of light through the melanin layer. In this study, the introduced model is applied to the reflectance spectra obtained from in vivo MDSFR measurements on volunteers with heavily pigmented skin (skin type IV to VI). We demonstrate that this model allows the extraction of optical properties of the skin. A strong correlation is observed between the absorption of melanin pigments described by the introduced model and an independent measurement of the epidermal melanin concentration (EMC) on the same location, using mexameter, a commonly used EMC meter in the field.20
2. Methodology
2.1. MDSFR Reflectance Model
The MDSFR reflectance model used as the basis of this study was derived previously by Kanick et al.22 from Monte Carlo simulations. In their paper, the effect of the absorption on the measured reflectance was expressed by a form of the Beer–Lambert law as in Eq. (1) but without the term included in Eq. (2). In Eq. (1), stands for the reflectance without absorption measured by the fiber of diameter and can be expressed as
| (3) |
The lower limit of the single-fiber collection efficiency, , is described in Eq. (4), in which NA is the numerical aperture of the measurement fiber and is the refractive index of the medium in contact with the surface of the measurement fiber:
| (4) |
is for a fiber of immersed in water ().
The parameter is related to the phase function that describes the angular dependence of scattered light. It is defined as
| (5) |
The parameters and are the first and second Legendre moments of the scattering phase function. is usually referred to as the scattering anisotropy factor. The reduced scattering coefficient is predefined using Eq. (6), in which is the reduced scattering coefficient at 700 nm and is the scattering slope ():
| (6) |
The effective path length of the detected photons by the fiber of diameter is described by Eq. (7). The absorption coefficient is dependent on the fiber diameter when chromophores are distributed inhomogeneously:
| (7) |
This MDSFR model was derived based on Monte Carlo simulations, in which a modified Henyey–Greenstein phase function (MHG PF) was assumed [Eq. (8)], where is the scattering angle. The first and second Legendre moments of an MHG can be expressed using Eqs. (9) and (10).23 Combining Eqs. (9), (10), and (5), the parameter for the MHG PF is expressed by Eq. (11), where was a factor that weights the contribution of the Henyey–Greenstein phase function (HG PF) and an added Rayleigh-like scattering part . In this study, was fitted as a wavelength independent parameter. is the first Legendre moment of the HG PF:
| (8) |
| (9) |
| (10) |
| (11) |
In the previous MDSFR studies, was fitted as a free parameter at each wavelength without a predefined model.3,24 This approach significantly increased the degrees of freedom during the spectral fit, which might lead to overfitting. A predefined model of can avoid the possible overfit. In our study, was predefined with the model shown in Eq. (11) combined a predefined model of . The predefined model of was derived from a mathematic fit on the results of Mie calculation of a phantom introduced by Gamm et al.9 to mimic a MHG PF, where is the wavelength (nm) and is the fit parameter determining the exact shape of (-):
| (12) |
2.2. Melanin Layer Model
Based on the morphology of the skin, we have incorporated the following features in the representation of transmission of light through the melanin layer: (1) all melanin pigments are restricted to a superficially positioned layer of a thickness ; (2) all detected photons propagate twice through the melanin layer, a first time when entering the tissue, and a second time just before leaving the tissue, furthermore, the transmission of light through the melanin layer was the same for all detected photons by all fiber diameters; and (3) only a surface fraction of the layer contains melanin. Consequently, the incident photons can pass the other fraction of the layer without encountering any melanin. It is assumed that the surface fraction sensed by fibers of different diameters is identical. When the photons propagate through the fraction of the layer containing melanin pigments, the transmission can be intuitively calculated using Beer–Lambert law as shown in
| (13) |
where stands for the absorption coefficient of the melanin containing fraction of the layer and stands for the thickness of the melanin layer. When light propagates through the fraction of the layer not covered by melanin pigments, the attenuation of light due to melanin is zero, thus .
The effective transmission of the melanin layer can be calculated using the following equation:
| (14) |
is taken as the sum of the contribution of the absorption from two main melanin pigments: eumelanin (black and brown) and pheomelanin (red):19
| (15) |
in which and are the concentration of eumelanin and pheomelanin (); and are the corresponding extinction coefficients ().25 The transmission of the melanin layer is then rewritten in Eq. (16), where the surface density of eumelanin and pheomelanin () and are the product of the melanin layer thickness (mm) and the concentration and
| (16) |
(), respectively.
The surface density of melanin pigments is used as the fit parameter rather than thickness and concentration because fitting both the layer thickness and the concentrations independently would lead to a dependency between these parameters.
2.3. Combination of the MDSFR Model and the Melanin Layer Model
To correct for the inhomogeneous distribution of melanin pigments, the melanin layer model and the MDSFR model were combined in our study. The absorption of the other components in the tissue was still described using Beer–Lambert law with an effective path length described by Eq. (7). The reflectance obtained from a fiber of diameter was then described in
| (17) |
was the effective transmission of the melanin layer described in Eq. (16). and were different for different fiber diameters while was independent of the fiber diameter. Note that the absorption coefficient of the sampling volume by the fiber of diameter was fiber diameter-dependent because accounted for the absorption of blood, which was distributed inhomogeneously and concentrated in discrete cylindrical vessels. In this study, was defined as
| (18) |
where was the absorption coefficient of whole blood. was the blood oxygen saturation. and were the micromolar absorption coefficients of oxygenated and deoxygenated hemoglobin (). was the total concentration () of hemoglobin and was a correction factor that accounts for the influence of the inhomogeneous distribution of the blood, which was determined by and effective blood vessel diameter () using the following equation:11
| (19) |
2.4. Experimental Setup
An MDSFR spectroscopy system, depicted in Fig. 2, utilized two measurement fibers of 400 and . White light was emitted by a halogen light source (Ocean Optics, HL-2000). Light from the source was guided to two digitally controlled optical shutters (Ocean Optics Inline Shutter) and connected, together with two fibers from the two-channel spectrograph (Ocean Optics SD200), with the two measurement fibers using SMA–SMA connectors. The 400- and fibers were glued next to each other in the channel of a cylindrical aluminum tube of 5-mm diameter. The fiber and tube surfaces were aligned and polished at 15-deg angle to eliminate the internal reflection induced by the refractive index mismatch between the fiber and sample in contact. The whole system was automated electronically and controlled with a LabVIEW program.
Fig. 2.
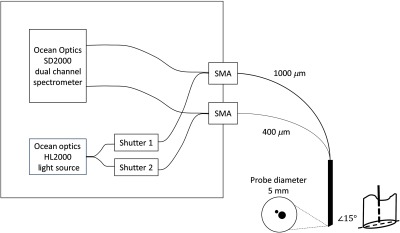
MDSFR system schematic: light from the source is split into two fibers and led to two shutters that guide the light either to the connector of the or the measurement fibers that first transport the light to the tissue and subsequently collect backscattered light from the tissue and guide it back to the spectrometer. The setup has two channels that are activated one-by-one. The two measurement fibers are integrated into a single-measurement probe. The operation of the setup is controlled by a LabView program (LabView, National Instruments, Austin, Texas).
2.5. Data Acquisition and Analysis
The probe was positioned on the skin of each volunteer with gentle contact to avoid optical property changes due to the pressure applied. Water was applied between the probe and the skin to ensure a good optical contact. The absolute reflectance of the skin was calculated using
| (20) |
The absolute reflectance of the undiluted Intralipid 20% sample (the reference sample) was determined using the Fresnel reflection method26 with flat polished 400- and fibers from the same batch of the fiber used in the probe. The absolute reflectance spectra of undiluted Intralipid 20% of the 400- and fiber were saved in the LabVIEW program prior to the in vivo skin measurements. The reflected intensity of undiluted Intralipid 20% and background intensity were measured prior to the measurements on each volunteer to account for the fluctuation of the output of the light source and the ambient light. was measured by immersing the probe in water in a black container.
This study was approved by the University Medical Center Groningen (METc M16.199148, UMCG, Groningen, The Netherlands). In vivo MDSFR measurements were performed on the inner forearm skin of 12 volunteers (November 9 to 11, 2016). Three spectra were measured from three close locations on the skin of each volunteer. Each spectrum was the average of a series of ten measured spectra of the same location. The standard deviation was calculated based on the same 10 measured spectra and used as an indication of the measurement error of the averaged spectra. Co-localized measurements of the reflected intensity of the skin were performed on the same skin area of all volunteers where MDSFR measurements were performed using a commonly used EMC meter, Mexameter® (Courage + Khazaka electronic GmbH, Cologne, Germany). The Mexameter® emits three specific wavelengths (568, 660, and 870 nm). The melanin index (MI) was presumably determined using a proprietary algorithm.20
We analyzed the MDSFR spectra from 400 to 900 nm in step of 1 nm. The nonlinear least-squares fit based on MDSFR model [Eqs. (3)–(19)] was performed simultaneously on the spectra obtained from the 400- and fibers. The following parameters were fitted:
-
•
the reduced scattering coefficient at 700 nm: (),
-
•
the scattering slope: (-) (),
-
•
weighing factor of the contribution of Henyey Greenstein phase function (HG PF) and added Rayleigh like scattering part: (-),
-
•
a parameter determining the exact shape of : (-),
-
•
the surface density of eumelanin and pheomelanin: and (),
-
•
surface fraction of the melanin layer: (-).
As mentioned previously, the vascular parameters were fiber diameter-dependent and fitted separately from the spectra of the 400- and fibers:
-
•
the concentration of hemoglobin: (),
-
•
the oxygen saturation: (-),
-
•
the vessel diameter: ().
The measurement error of the spectra at each wavelength obtained from each fiber was used as a weighing factor in the fit so that spectral regions with large standard deviations have less influence on the fit.17 The fit algorithm minimizes the reduced chi-square the difference between measurement and model, weighed by the measurement error:
| (21) |
and , , and stand for the reflection measurement, the measurement error and the model value at wavelength of the spectrograph with fiber number , for the number of degrees of freedom calculated from , where is the total number of measurements (i.e., wavelengths in all spectra of all fibers) and for the total number of model parameters in the fit. The model was used to fit the measurement spectra by varying the model parameters until the lowest possible value for was obtained. The confidence interval of each fitted parameters was estimated using the approach described previously by Amelink et al.27 The 95% confidence intervals represented the statistical error as the square root of the diagonal elements of the covariance matrix multiplied by 1.96, obtained by multiplying the inverse of the second derivative matrix of with respect to its free parameters by .
3. Results
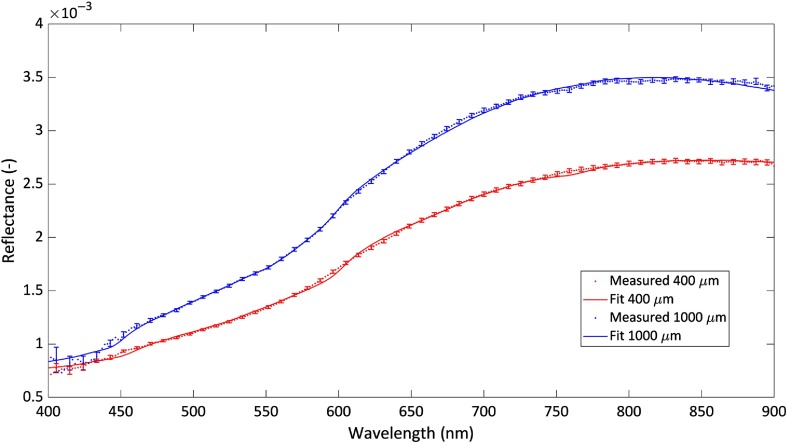
A typically measured spectrum of volunteer 8 (skin type VI) is plotted in Fig. 3 together with the respective best fit with . The measured reflectance spectra of all volunteers fitted well, resulting in a fit residue of less than two times the standard deviation of 10 measurement spectra at each wavelength (skin type IV to VI).
Fig. 3.
MDSFR spectra fit of volunteer 8. The error bars indicate the 95% confidence interval calculated from 10 sequential measurements. Spectra from both fibers were fitted simultaneously.
The reduced scattering coefficient at 700 nm and the scattering slope were fitted from each measurement. The average of and of each volunteer was calculated. The average ranges from 1.09 to , whereas ranges from to . The co-localized MI and the respective skin type are also shown in Table 1.
Table 1.
Fitted parameters of the reduced scattering coefficient and the corresponding 95% confidence intervals; MI measured by the mexameter ( uncertainty) and the respective skin type.
| Volunteer no. | (1/mm) | (-) | MI (-) | Skin type |
|---|---|---|---|---|
| 1 | VI | |||
| 2 | VI | |||
| 3 | IV | |||
| 4 | IV | |||
| 5 | IV | |||
| 6 | IV | |||
| 7 | VI | |||
| V8 | VI | |||
| 9 | IV | |||
| 10 | VI | |||
| 11 | VI | |||
| 12 | V |
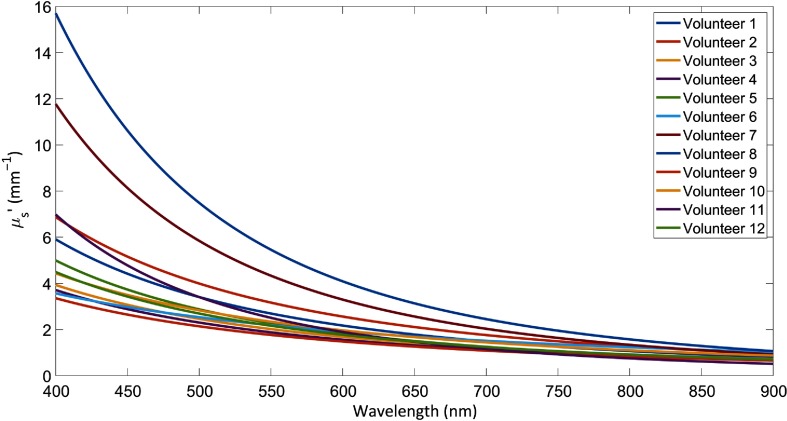
The reduced scattering coefficient was predefined as Eq. (6). The average reduced scattering coefficient spectra of each volunteer, calculated based on the average and shown in Table 1, are depicted in Fig. 4 The reduced scattering coefficient ranges from 3.36 to at 400 nm and it ranges 0.43 to at 900 nm.
Fig. 4.
The average reduced scattering coefficient of all volunteers.
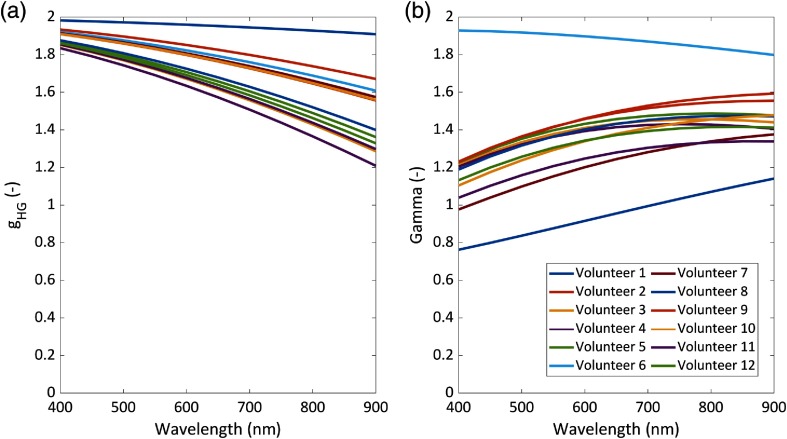
The averaged spectrum of each volunteer at each wavelength was calculated and plotted [see Fig. 5(a)] based on the average of the fitted and Eq. (12). ranges from 0.92 to 0.99 at 400 nm and 0.60 to 0.95 at 900 nm. The fitted parameter ranges from 0.87 to 1.00. Combining the anisotropy factor , , and Eq. (11), the spectra of were calculated and plotted [see Fig. 5(b)]. Both the amplitudes and the slopes of spectra vary among volunteers. The value of increases with the increase of the wavelength except in volunteer 6. Gamma values range from 0.79 to 1.93 at 400 nm and from 1.14 to 1.80 at 900 nm.
Fig. 5.
The average (a) anisotropy factor and (b) gamma.
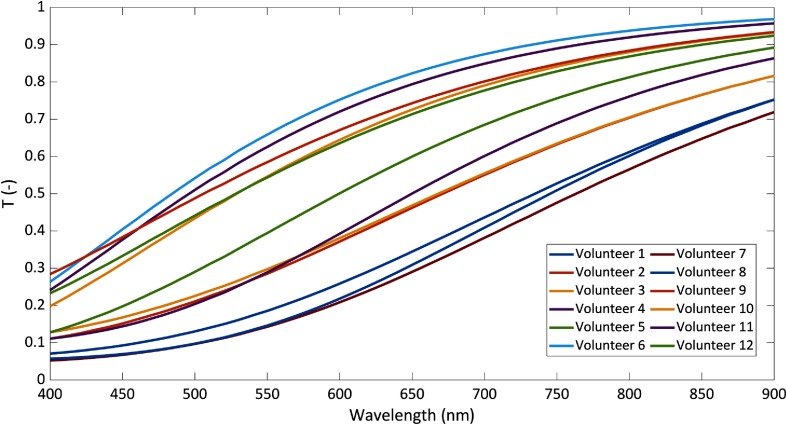
The parameters related to melanin pigments, the surface density of eumelanin and pheomelanin () and surface fraction , were generated from the fit of the measured spectra. The average was calculated based on the fit results of the three measurements on each volunteer (see Table 2). Surface fraction of the melanin layer varies from 0.70 to 1.00. Furthermore, the transmission spectra of the melanin layer were calculated using Eq. (16) and plotted (see Fig. 6). The one-way transmission of the melanin layer at 700 nm was demonstrated together with the MI values measured by the mexameter in Table 2. The 95% confidence intervals (CI) of the fitted surface density of eumelanin and pheomelanin and surface fraction are also shown. The CI values of the fitted eumelanin concentration are very low (0.00 represents a value much smaller than 0.01), whereas the CI values for pheomelanin concentration and surface fraction are relatively high for some volunteers.
Table 2.
Melanin related fit parameters and the corresponding 95% confidence intervals. The transmission at 700 nm calculated using the average of the melanin related fit parameters; MI measured by the mexameter ( uncertainty).
| Volunteer no. | Eumelanin () | Pheomelanin () | Surface fraction (-) | Transmission at 700 nm (-) | MI (-) |
|---|---|---|---|---|---|
| 1 | 0.43 | ||||
| 2 | 0.55 | ||||
| 3 | 0.79 | ||||
| 4 | 0.85 | ||||
| 5 | 0.78 | ||||
| 6 | 0.87 | ||||
| 7 | 0.38 | ||||
| 8 | 0.41 | ||||
| 9 | 0.80 | ||||
| 10 | 0.55 | ||||
| 11 | 0.60 | ||||
| 12 | 0.68 |
Fig. 6.
The transmission spectra of the melanin layer based on the average of melanin-related fit parameters.
The average fitted vascular parameters of each volunteer of both fibers: oxygen saturation (-), hemoglobin concentration (), and vessel diameter () are shown in Table 3. For the fiber, the fitted oxygen saturation of all volunteers is mostly below 0.47 except volunteer 11 (0.95); the fitted hemoglobin concentration ranges from 6 to ; the fitted vessel diameter ranges from 4 to . For the fiber, the fitted oxygen saturation of all volunteers is mostly below 0.39 except volunteer 2 (0.72) and 5 (0.74); the fitted hemoglobin concentration ranges from 4 to ; the fitted vessel diameter ranges from 8 to .
Table 3.
Fitted vascular parameters and the corresponding 95% confidence intervals.
| Volunteer no. | ||||||
|---|---|---|---|---|---|---|
| Oxygen saturation (-) | Hemoglobin concentration () | Vessel diameter () | Oxygen saturation (-) | Hemoglobin concentration () | Vessel diameter () | |
| 1 | ||||||
| 2 | ||||||
| 3 | ||||||
| 4 | ||||||
| 5 | ||||||
| 6 | ||||||
| 7 | ||||||
| 8 | ||||||
| 9 | ||||||
| 10 | ||||||
| 11 | ||||||
| 12 | ||||||
4. Discussion
4.1. Dependence of the Transmission of Melanin Layer on the Fiber Diameter
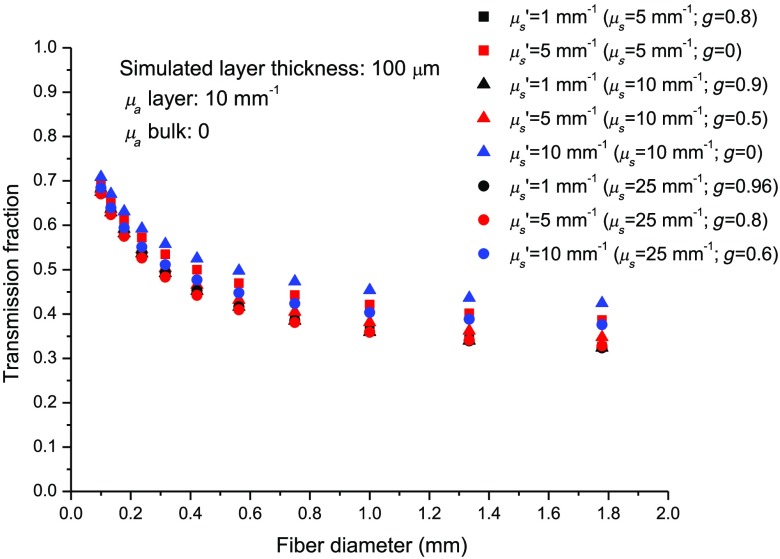
A layer model is introduced to correct for the inhomogeneous distribution of melanin pigments in the measurement volumes of MDSFR measurements. The transmission of the melanin layer is described by the surface density of the eumelanin and the pheomelanin and surface fraction, thereby taking into account that melanin pigments are only found up to a certain depth of the epidermis layer in human skin. The model also assumes that all detected photons propagate through the melanin layer twice: a first time when entering the tissue and a second time just before leaving the tissue, and the transmission of the melanin layer is independent of the fiber diameter and the same for all detected photons. The introduced model was validated using Monte Carlo simulations. We use a two-layer Monte Carlo model to simulate a skin model and the single-fiber reflectance of different fiber diameters. The model consists of a top layer mimicking epidermis of thickness and a semi-infinite bottom layer. The scattering properties (the reduced scattering coefficient and anisotropy factor ) of both layers are identical. The absorption coefficient of the top layer is defined as , whereas the absorption coefficient of the bottom layer is defined to be . The absorption coefficient of the top layer is chosen based on the data on darkly pigmented African skin.28 A series of scattering properties is chosen based on the literature data on human skin.19 The model generates the single-fiber reflectance without absorption and the single-fiber reflectance , which considers the absorption within the top layer. The transmission of the layer for different fiber diameters and scattering properties are plotted in Fig. 7. It is observed that the layer transmission as a function of the fiber diameter is saturating at higher fiber diameters. The difference between the layer transmission measured by the 400- and fiber is not significant within the range of simulated optical properties; thus the transmission of the melanin layer can be approximated as fiber-diameter-independent in our study. We do notice that the fiber-diameter-dependence of the transmission gets stronger for smaller fiber diameters, which indicates that the performance of the introduced layer model improves when using relatively large fiber diameters.
Fig. 7.
The dependence of the transmission of the melanin layer on the fiber diameter.
4.2. Strong Correlation between MI and the Transmission of Melanin Layer
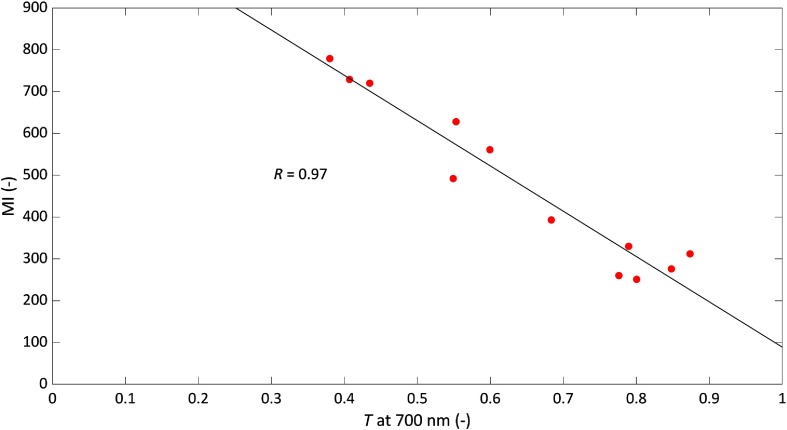
Melanin is the dominant factor that determines skin color. The skin type is often categorized according the MI measured by the mexameter. In this study, the skin types of the volunteers range from Fitzpatrick skin type IV to VI. In this study, a strong correlation was found between the MI values and the total melanin surface density (the sum of the surface density of eumelanin and pheomelanin) . Furthermore, a strong correlation was found between the MI and the transmission of the melanin layer as shown in Fig. 8. This correlation indicates that the layer model describes the absorption of light caused by melanin pigments in skin tissue as well as the mexameter. The fitted surface density of eumelanin of most volunteers was orders of magnitude higher compared to pheomelanin, which was expected since the skin colors of all volunteers were presented as black/brown rather than red. The correlation between the surface fraction and the MI was low ().
Fig. 8.
The correlation between MI and the average transmission of the melanin layer at 700 nm.
Quantifying melanin content using MDSFR with the introduced model does have advantages over DRS since the diffuse approximation works only when the scattering of light is dominant. For heavily pigmented skin tissues, the absorption is very likely to be dominant due to the presence of relatively high concentration of melanin pigments in a strongly inhomogeneous geometry. When the diffusion approximation does not work and/or absorption is more dominant, alternative methods are required to process the data, such as look-up tables.29,30
4.3. Melanin Pigments Contribute to Scattering
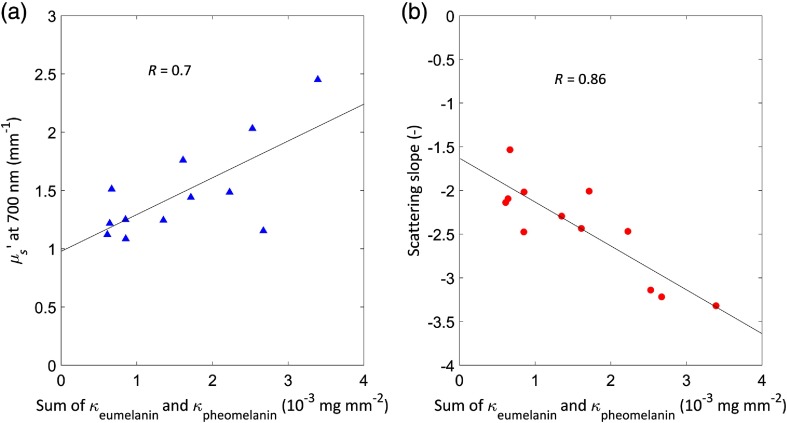
The introduced model gives the transmission of the melanin layer (Fig. 6), a spectral shape that is different from the reduced scattering coefficient model (Fig. 4), which reduces the competition between the transmission spectra of the melanin layer and the reduced scattering coefficient during the fitting procedure. As a result, a significant decrease of the reduced chi-square is observed when analyzing the spectra using the introduced model (2.86 in average) compared with the fit when assuming a homogeneous distribution of melanin pigments (39.5 in average), which indicates a significant improvement of the fit quality. Jacques19 reviewed previously conducted skin measurements: using the same model in Eq. (6), the fitted reduced scattering coefficients at 500 nm range from 2.97 to and the fitted scattering slope ranges from to . In this study, the average of the reduced scattering coefficients at 500 nm, which were calculated to be from 2.14 to , matches well the literature data, while the average of fitted scattering slope of volunteer 7 (), volunteer 8 (), and volunteer 11 () were lower compared to the fitted scattering slope range reviewed by Jacques.19 The low scattering slope fitted in this study compared to the literature data might be caused by the scattering from the high concentration of submicron tissue components,31,32 which, in our case, is the abundant melanin pigments within the optical sampling volume. Riesz33 measured the scattering coefficient of a eumelanin solution. The scattering coefficient of the eumelanin solution can be well fitted with a predicted Rayleigh scattering coefficient obtained with a particle radius of 38 nm,33 which is much smaller compared to the wavelengths of the halogen light source.34 As a result, Rayleigh scattering (), or small particle scattering, is more pronounced and presented as a low-scattering slope . This hypothesis is supported by the strong correlation observed between the fitted scattering slope and the sum of the surface density of melanin pigments () as shown in Fig. 9(b). In addition, we also found a correlation between the sum of the surface density of melanin pigments and the fitted reduced scattering coefficient at 700 nm, () showing the reduced scattering coefficient increases as the increase of the melanin surface density as shown in Fig. 9(a). A similar correlation was also found by Bashkatov et al.35 who measured the reduced scattering coefficient of phantoms of different melanin concentrations. Their study showed the reduced scattering coefficient increases with the increase of the melanin concentration. The parameter weights the contribution of Henyey–Greenstein and Rayleigh-like scattering. The smaller is, the bigger the contribution of Rayleigh-like scattering is, or the smaller the scattering particle size is. However, we did not find a strong correlation between the fitted and the sum of the surface density of melanin pigments in our study.
Fig. 9.
The correlation between the sum of the surface density of melanin pigments: (a) the fitted reduced scattering coefficient at 700 nm and (b) the scattering slope .
4.4. Fit with a Predefined Model
In previous MDSFR studies, the parameter at each wavelength was fitted individually without a predefined model.3,24 This approach grants significant degrees of freedom during the fitting procedure and might lead to overfitting (i.e., the fitting of system noise). To avoid possible overfits, in this study, was predefined with Eq. (11) by assuming an MHG PF of the measured skin tissue. Earlier, MHG PF was also assumed when deriving the MDSFR model,23 because it was believed to describe the back-scattering more accurately compared to HG PF.10 To limit the degrees of freedom during the fit, was also predefined with Eq. (12), which was derived from Mie calculations on a phantom introduced by Gamm et al.9 to mimic an MHG PF. Gamm et al. found that a polystyrene beads suspension containing 10 different sphere sizes and a fractal dimension of 4.1 yielded the best match between the true phase function and best fit MHG PF. Using Mie calculations, the wavelength dependence of was derived and expressed in Eq. (11). We would like to stress that the use of the model of assuming an MHG PF is motivated by the reduction of the number of degrees of freedom of the fit. The exact phase function of the measured skin tissue, however, is not known, and we do not claim that we are able to measure the anisotropy factor of the skin tissue.
Van Leeuwen-Van Zaane et al.3 performed MDSFR spectroscopy measurements on murine skin. In their study, values were fitted to be roughly 1.2 at 400 nm and 1.4 at 850 nm and increased with increasing wavelength. Brooks et al.24 utilized the same technique and performed in vivo measurements on human skin (skin type II to III) and was fitted and averaged. The averaged ranges roughly from 1.0 to 1.5. The fitted values of in our study range from 0.76 to 1.93. The fitted values mostly increase with increasing wavelength for all volunteers except volunteer 6. The descending trend of the fitted values for volunteer 6 was accompanied by an extremely high value fitted (). In this study, was fitted as a wavelength-independent parameter. The fitted values range from 0.87 to 1.00, which indicates strong Mie scattering. However, Bashkatov et al. 36 measured a more dominant Rayleigh scattering in the shorter wavelength regime and the fraction of the Rayleigh scattering decreased with the increase of wavelength, which suggested that the ratio of the contribution of HG PF and Rayleigh-like scattering is very likely to change with the wavelength.36
4.5. Higher Hemoglobin Concentration Fitted from the Reflectance Spectra of the Fiber
Vascular parameters: hemoglobin concentration, oxygen saturation, and vessel diameter were fitted individually for the 400- and fiber to account for the inhomogeneous distribution of blood. Lower hemoglobin concentration and vessel diameter were fitted on the fiber spectra compared to the fitted values from the fiber spectra, which is surprising since we expected the photons detected by the fiber to interact with a larger amount of blood compared to the fiber. The CI values of the vascular fit parameters were relatively large compared to other fit parameters. The large CI values were due to the superficial sampling depth and heavy absorption of the melanin pigments, the vascular structures that interact with the detected photons were limited. Compared to SFR measurements in Caucasian skin, the absorption dips in the region 400 to 600 nm observed in this study are not well visible due to the dominant melanin absorption in this wavelength region, which may have interfered with the ability of the fit to accurately recognize the hemoglobin features in the spectrum.
5. Conclusion
A model is introduced to account for the inhomogeneous distribution of melanin pigments during MDSFR measurements. The model improves the quality of the fit and describes the MDSFR spectra of heavily pigmented skin well. We recommend utilizing the model with MDSFR measurements aiming at extracting tissue optical properties in human skin tissue abundant in melanin pigments, preferably with relatively big fiber diameters to minimize the fiber-diameter-dependence of the transmission of the melanin layer. We observe a correlation between the fitted scattering parameters and the surface density of melanin pigments, indicating that melanin contributes to the overall scattering properties of skin tissue. This work is the first step toward quantitative analysis of melanin pigment-related information and accurate extraction of other tissue optical properties in heavily melanin pigmented skin tissue. Future work will focus on full characterization of optical properties and physiological parameters related melanin pigments in skin types IV to VI.
Acknowledgments
This research was supported by the Netherlands Organization for Scientific Research (Technology Foundation NWO-TTW, iMIT-FIBER Grant No. 12702).
Biographies
Xu U. Zhang received his MSc degree in photonics from Friedrich Schiller University, Jena, Germany. Currently, he is a PhD student in the Department of Biomedical Engineering and Physics, University Medical Centers Amsterdam, The Netherlands. His research focuses on the investigation of light and tissue interaction utilizing optical techniques.
Piet van der Zee received his MSc degree in nuclear physics from Groningen University, The Netherlands, and his PhD in medical physics from the University College London. He has worked as a researcher at the University College London and as a lecturer at the University of Hertfordshire. Subsequently, he worked as a senior researcher at Diagnoptics Technology B.V. Groningen, The Netherlands. He is currently a consultant in medical physics.
Isabella Atzeni is a student in medicine at Rijksuniversiteit Groningen, The Netherlands. Currently, she is a MD/PhD student in the Department of Internal Medicine, Division of Vascular Medicine, University Medical Center Groningen, The Netherlands. Her research focuses on the role of the receptor for advanced glycation endproducts in the pathogenesis of systemic sclerosis.
Dirk J. Faber received his MSc degree in applied physics from the University of Twente, Enschede, The Netherlands, in 1999, and his PhD from the University of Amsterdam, Amsterdam, The Netherlands, in 2005, based on his work on optical coherence tomography. He is currently an assistant professor in the Department of Biomedical Engineering and Physics at the Amsterdam University Medical Centers of the Academic Medical Center. He has co-authored more than 75 peer-reviewed articles and six book chapters. His current research focuses on the physics of light–tissue interaction and the development of optical coherence tomography and single-fiber spectroscopy. He is a senior member of SPIE.
Ton G. van Leeuwen is a full professor in biomedical physics and since 2008 appointed as a head of the Biomedical Engineering and Physics Department at the Amsterdam UMC, Academic Medical Center of the University of Amsterdam. Current research focuses on the physics of the interaction of light with tissue, and use of that knowledge for the development, introduction and clinical evaluation of (newly developed) optical imaging techniques for gathering quantitative functional and molecular information of tissue.
Henricus J. C. M. Sterenborg received his MSc degree in applied physics from the University of Eindhoven, The Netherlands, in 1982, and he has been active in biomedical optics research since then. He co-founded the Centre for Optical Diagnostics and Therapy at Erasmus Medical Center and, in 2008, he was appointed as a professor of photodynamic therapy at Erasmus University. Since 2013, he fulfills a joint position in the Department of Biomedical Engineering and Physics of the Academic Medical Centre in Amsterdam and the Surgical Innovations Group at the Netherlands Cancer Institute. His main focus of research is currently optical diagnostics and monitoring of disease and specifically on optical spectroscopy and hyperspectral imaging. He has published more than 250 peer-reviewed papers, has initiated and participated in a large list of nationally and internationally funded research projects, has served as reviewer for various national and international funding agencies, and was involved in several university spin-out companies.
Disclosures
No conflicts of interest, financial or otherwise, are declared by the authors.
Contributor Information
Xu U. Zhang, Email: xu.zhang@amc.uva.nl.
Piet van der Zee, Email: piet_vanderzee@hotmail.com.
Isabella Atzeni, Email: i.m.atzeni@umcg.nl.
Dirk J. Faber, Email: d.j.faber@amc.uva.nl.
Ton G. van Leeuwen, Email: T.G.vanLeeuwen@amc.uva.nl.
Henricus J. C. M. Sterenborg, Email: h.j.sterenborg@amc.uva.nl.
References
- 1.Bosschaart N., et al. , “Optical properties of neonatal skin measured in vivo as a function of age and skin pigmentation,” J. Biomed. Opt. 16(9), 097003 (2011). 10.1117/1.3622629 [DOI] [PubMed] [Google Scholar]
- 2.Amelink A., et al. , “Monitoring PDT by means of superficial reflectance spectroscopy,” J. Photochem. Photobiol. B Biol. 79(3 Special issiue), 243–251 (2005). 10.1016/j.jphotobiol.2005.01.006 [DOI] [PubMed] [Google Scholar]
- 3.van Leeuwen-van Zaane F., et al. , “In vivo quantification of the scattering properties of tissue using multi-diameter single fiber reflectance spectroscopy,” Biomed. Opt. Express 4(5), 696 (2013). 10.1364/BOE.4.000696 [DOI] [PMC free article] [PubMed] [Google Scholar]
- 4.Ungureanu C., et al. , “Differential pathlength spectroscopy for the quantitation of optical properties of gold nanoparticles,” ACS Nano 4(7), 4081–4089 (2010). 10.1021/nn1009165 [DOI] [PubMed] [Google Scholar]
- 5.Post A. L., et al. , “Modeling subdiffusive light scattering by incorporating the tissue phase function and detector numerical aperture,” J. Biomed. Opt. 22(5), 050501 (2017). 10.1117/1.JBO.22.5.050501 [DOI] [PubMed] [Google Scholar]
- 6.Cerussi A., et al. , “Effect of contact force on breast tissue optical property measurements using a broadband diffuse optical spectroscopy handheld probe,” Appl. Opt. 48(21), 4270–4277 (2009). 10.1364/AO.48.004270 [DOI] [PMC free article] [PubMed] [Google Scholar]
- 7.Evers D. J., et al. , “Diffuse reflectance spectroscopy: a new guidance tool for improvement of biopsy procedures in lung malignancies,” Clin. Lung Cancer 13(6), 424–431 (2012). 10.1016/j.cllc.2012.02.001 [DOI] [PubMed] [Google Scholar]
- 8.Kanick S. C., et al. , “Method to quantitatively estimate wavelength-dependent scattering properties from multidiameter single fiber reflectance spectra measured in a turbid medium,” Opt. Lett. 36(15), 2997–2999 (2011). 10.1364/OL.36.002997 [DOI] [PubMed] [Google Scholar]
- 9.Gamm U. A., et al. , “Quantification of the reduced scattering coefficient and phase-function-dependent parameter γ of turbid media using multidiameter single fiber reflectance spectroscopy: experimental validation,” Opt. Lett. 37(11), 1838 (2012). 10.1364/OL.37.001838 [DOI] [PubMed] [Google Scholar]
- 10.Kanick S. C., et al. , “Monte Carlo analysis of single fiber reflectance spectroscopy: photon path length and sampling depth,” Phys. Med. Biol. 54, 6991–7008 (2009). 10.1088/0031-9155/54/22/016 [DOI] [PubMed] [Google Scholar]
- 11.Kanick S. C., et al. , “Method to quantitate absorption coefficients from single fiber reflectance spectra without knowledge of the scattering properties,” Opt. Lett. 36(15), 2791 (2011). 10.1364/OL.36.002791 [DOI] [PubMed] [Google Scholar]
- 12.Gamm U. A., et al. , “Measurement of tissue scattering properties using multi-diameter single fiber reflectance spectroscopy: in silico sensitivity analysis,” Biomed. Opt. Express 2(11), 3150–3166 (2011). 10.1364/BOE.2.003150 [DOI] [PMC free article] [PubMed] [Google Scholar]
- 13.Talsma A., Chance B., Graaff R., “Corrections for inhomogeneities in biological tissue caused by blood vessels,” J. Opt. Soc. Am. A. Opt. Image Sci. Vis. 18(4), 932–939 (2001). 10.1364/JOSAA.18.000932 [DOI] [PubMed] [Google Scholar]
- 14.Matts P. J., Dykes P. J., Marks R., “The distribution of melanin in skin determined in vivo,” Br. J. Dermatol. 156(4), 620–628 (2007). 10.1111/j.1365-2133.2006.07706.x [DOI] [PubMed] [Google Scholar]
- 15.van Veen R. L. P., Verkruysse W., Sterenborg H. J. C. M., “Diffuse-reflectance spectroscopy from 500 to 1060 nm by correction for inhomogeneously distributed absorbers,” Opt. Lett. 27(4), 246–248 (2002). 10.1364/OL.27.000246 [DOI] [PubMed] [Google Scholar]
- 16.Verkruysse W., et al. , “Modelling light distributions of homogeneous versus discrete absorbers in light irradiated turbid media,” Phys. Med. Biol. 42(1), 51–65 (1997). 10.1088/0031-9155/42/1/003 [DOI] [PubMed] [Google Scholar]
- 17.Amelink A., Christiaanse T., Sterenborg H. J. C. M., “Effect of hemoglobin extinction spectra on optical spectroscopic measurements of blood oxygen saturation,” Opt. Lett. 34(10), 1525–1527 (2009). 10.1364/OL.34.001525 [DOI] [PubMed] [Google Scholar]
- 18.Zonios G., Bykowski J., Kollias N., “Skin melanin, hemoglobin, and light scattering properties can be quantitatively assessed in vivo using diffuse reflectance spectroscopy,” J. Invest. Dermatol. 117(6), 1452–1457 (2001). 10.1046/j.0022-202x.2001.01577.x [DOI] [PubMed] [Google Scholar]
- 19.Jacques S. L., “Optical properties of biological tissues: a review,” Phys. Med. Biol. 58(11), R37–R61 (2013). 10.1088/0031-9155/58/11/R37 [DOI] [PubMed] [Google Scholar]
- 20.Verkruysse W., et al. , “Remittance at a single wavelength of 390 nm to quantify epidermal melanin concentration,” J. Biomed. Opt. 14(1), 014005 (2009). 10.1117/1.3065542 [DOI] [PMC free article] [PubMed] [Google Scholar]
- 21.Lister T., Wright P. A., Chappell P. H., “Optical properties of human skin,” J. Biomed. Opt. 17(9), 090901 (2012). 10.1117/1.JBO.17.9.090901 [DOI] [PubMed] [Google Scholar]
- 22.Kanick S. C., Sterenborg H. J. C. M., Amelink A., “Empirical model of the photon path length for a single fiber reflectance spectroscopy device,” Opt. Express 17(2), 860–871 (2009). 10.1364/OE.17.000860 [DOI] [PubMed] [Google Scholar]
- 23.Bevilacqua F., Depeursinge C., “Monte Carlo study of diffuse reflectance at source-detector separations close to one transport mean free path,” J. Opt. Soc. Am. A 16(12), 2935 (1999). 10.1364/JOSAA.16.002935 [DOI] [Google Scholar]
- 24.Brooks S., et al. , “Sources of variability in the quantification of tissue optical properties by multidiameter single-fiber reflectance and fluorescence spectroscopy,” J. Biomed. Opt. 20(5), 057002 (2015). 10.1117/1.JBO.20.5.057002 [DOI] [PubMed] [Google Scholar]
- 25.Pilas B., et al. , “The effect of melanin on iron associated decomposition of hydrogen peroxide,” Free Radical Biol. Med. 4, 285–293 (1988). 10.1016/0891-5849(88)90049-4 [DOI] [PubMed] [Google Scholar]
- 26.Zhang X. U., et al. , “Single fiber reflectance spectroscopy calibration,” J. Biomed. Opt. 22(10), 100502 (2017). 10.1117/1.JBO.22.10.100502 [DOI] [PubMed] [Google Scholar]
- 27.Amelink A., Robinson D. J., Sterenborg H. J. C. M., “Confidence intervals on fit parameters derived from optical reflectance spectroscopy measurements,” J. Biomed. Opt. 13(5), 054044 (2008). 10.1117/1.2982523 [DOI] [PubMed] [Google Scholar]
- 28.Jacques S. L., “Quick analysis of optical spectra to quantify epidermal melanin and papillary dermal blood content of skin,” J. Biophotonics 8(4), 309–316 (2015). 10.1002/jbio.v8.4 [DOI] [PubMed] [Google Scholar]
- 29.Ivančič M., et al. , “Efficient estimation of subdiffusive optical parameters in real time from spatially resolved reflectance by artificial neural networks,” Opt. Lett. 43(12), 2901–2904 (2018). 10.1364/OL.43.002901 [DOI] [PubMed] [Google Scholar]
- 30.Verkruysse W., et al. , “A library based fitting method for visual reflectance spectroscopy of human skin,” Phys. Med. Biol. 50(1), 57–70 (2005). 10.1088/0031-9155/50/1/005 [DOI] [PubMed] [Google Scholar]
- 31.Beauvoit B., et al. , “Correlation between the light scattering and the mitochondrial content of normal tissues and transplantable rodent tumors,” Anal. Biochem. 226(1), 167–174 (1995). 10.1006/abio.1995.1205 [DOI] [PubMed] [Google Scholar]
- 32.Wilson J. D., Cottrell W. J., Foster T. H., “Index-of-refraction-dependent subcellular light scattering observed with organelle-specific dyes,” J. Biomed. Opt. 12(1), 014010 (2007). 10.1117/1.2437765 [DOI] [PubMed] [Google Scholar]
- 33.Riesz J., “The spectroscopic properties of melanin,” PhD Thesis, University of Queensland (2007). [Google Scholar]
- 34.Meredith P., Sarna T., “The physical and chemical properties of Eumelanin,” Pigment Cell Res. 19(6), 572–594 (2006). 10.1111/pcr.2006.19.issue-6 [DOI] [PubMed] [Google Scholar]
- 35.Bashkatov A. N., et al. , “Optical properties of melanin in the skin and skinlike phantoms,” 4162, 219–226 (2000). 10.1117/12.405946 [DOI] [Google Scholar]
- 36.Bashkatov A. N., et al. , “Optical properties of human skin, subcutaneous and mucous tissues in the wavelength range from 400 to 2000 nm,” J. Phys. D. Appl. Phys. 38(15), 2543–2555 (2005). 10.1088/0022-3727/38/15/004 [DOI] [Google Scholar]


