Abstract
Aim:
The aim of the present study is to assess the relationship between chronological age (CA) and the measurement of the open apices in teeth and also assess the accuracy of Cameriere methods on dental age (DA) estimation in the South Indian population.
Subjects and Methods:
A sample of 200 orthopantomographs of children aged between 10 and 15 years were collected. The seven left permanent mandibular teeth were evaluated with Cameriere method.
Results:
Regression analysis was carried out which derived the following linear regression formula: Age = 14.117 − 0.01 g − 1.732W3 + 0.016N0 − 0.289 × 5 − 0.099.s. N0. The equation explained 88.3% (R2 = 0.883) of the total deviance. The accuracy of the European formula and South Indian formula was determined by the difference between the estimated DA and CA. Cameriere formula produced 32% and 18% of absolute residuals falls within the range of ± 1 and ± 0.5 years, whereas the new regression formula produced 72% and 35% within range of ± 1 and ± 0.5 years.
Conclusion:
This further highlight the importance of population-specific formula keeping in mind about variation in dental maturation across different regions.
Keywords: Age estimation, Cameriere method, child labor, regression analysis, South Indian children
Introduction
Age estimation in children and adolescents is of paramount importance in clinical as well as in forensic practice. Clinically, orthodontists assess dental maturity through the calcification stages of tooth and analyze diagnostic performance of skeletal maturation as it is crucial in treatment planning.[1,2] In forensic context, virtually, no age is immune from medicolegal scrutiny, with children as young as 4 years of age and people as old as 70 years of age being come for a medicolegal opinion.[3] The need for age estimation in various situations has been constantly increasing, particularly in developing countries, as most births are not properly recorded and birth records are often not well maintained.[4]
In living individuals, particularly in children and adolescents, age estimation is required for criminal or civil reasons or to determine if individual in question is under aged or not.[5,6] In India, children who are rescued from child labor are often brought upon by the authorities for forensic age estimation. Indian population has more than 17.5 million working children in different industries, with estimated total number of child labor aged 5–14 to be at 12.6 million.[7,8] As per the Article 24 of the Indian constitution, a child below 14 years shall not be employed to work in any factory or mine or engaged in other hazardous employment.[4] According to the Indian Adoption Law, child may be aged between 1 and 12 years but not more than 12 years.[9]
At times, when proper documents such as birth certificates are not available, authorities seek for medical opinion from a forensic expert. The Study Group on Forensic Age Diagnostics suggested examination of three independent development systems in combination to increase diagnostic accuracy of age assessment.[6] Several growth parameters are utilized such as skeletal, dental, anthropological, and psychological. Among these, the most frequently used methods in children and adolescents are radiographic examination of teeth and hand-wrist.[10,11,12,13,14] Of all, dental development is probably the frequently used method as it is thought to be the less variable measure than eruption, unique nature of incremental formation, and periodic mineralization, unaffected by factors such as malnutrition or premature loss of primary teeth, and is more resistant to environmental insults.[15]
Various techniques are developed which defined mineralization stages of teeth in radiographs; among them, the most commonly utilized method was first published by Demirjian et al.[10] It has gained wide acceptance and applied to various populations.[16,17,18] The applicability of this method was also tested in Indian population, in which it showed overestimation of age and further raised debate among researchers regarding its application to Indian children.[17,19] Later in 2006, Cameriere et al. developed new method that measured the open apices in tooth roots.[20] It was reported that this method is more accurate than other methods for age estimation among 6–13 age groups.[21,22] Balla et al. tested the accuracy of three age estimation methods, in which Cameriere method showed greater accuracy in south Indian sample followed by Willems and Demirjian's method.[23]
Till date, children from different corners of the world were trafficked for forced labor, domestic work, begging and often were trafficked for sexual exploitation. As per the National Human Rights Commission report, the population of women and children in sex work is stated between 70,000 to one million, of these 30% are 20 years of age, 15% entered this work when they are below 15 years of age, and 25% between 15 and 18 years of age.[24] From Hyderabad, South India, around 200–350 children, mostly boys aged between 4 and 12 years, employed at bangle-making factories and footwear workshops were rescued.[25,26] Forensic age estimation was carried out to obtain opinion about age of these children, and they were sent to children homes for rehabilitation. This further increases the demand of having a population-specific formula suitable for Hyderabad population for age estimation in children belonging to 10–15 years of age group. Although some studies[9] validated the applicability of Cameriere method in the Indian population, this study is aimed to develop regression formulae for growing children of Hyderabad population, keeping in mind the variation of dental maturation across different regions of same country.[27]
Subjects and Methods
Study population
Orthopantomographs of 200 healthy children (99 girls and 101 boys) aged between 10 and 15 years were collected retrospectively [Table 1]. The radiographs were taken as a part of routine dental checkup and treatment from those who visited Panineeya Institute of Dental Sciences and Research Centre, Hyderabad. The chronological age (CA) of each individual was calculated by subtracting date of exposure of radiograph from date of birth. Digital images of the radiographs were taken and later, they were uploaded into computer and analyzed using a computer-aided drafting program Adobe photoshop (Adobe systems incorporated, San Jose, California, USA). Radiographs with inadequate quality for assessment, signs of gross pathology, hypodontia, and previous history of orthodontic treatment were excluded from the study. Ethical approval was obtained from Institutional Ethics Committee (PMVIDS and RC/IEC/OMFP/PR/0062-15).
Table 1.
Age and sex distribution of the sample
| Age groups (years) | Boys | Girls | Total |
|---|---|---|---|
| 10 | 18 | 16 | 34 |
| 11 | 20 | 18 | 38 |
| 12 | 18 | 14 | 32 |
| 13 | 27 | 15 | 42 |
| 14 | 14 | 20 | 34 |
| 15 | 4 | 16 | 20 |
| Total | 101 | 99 | 200 |
Measurements
Except third molars, all lower left permanent mandibular teeth were examined as per the method which is fully explained by Cameriere et al.[20] Teeth with the completely closed apical ends of the roots (N0) and those with incomplete root development with open apices were also examined. For teeth with open apices, the distance between the inner sides of the open apex was measured (Ai, being i the number of the element). For those teeth with two roots (i = 6 and 7), the sum of the distances between the inner sides of both apices was calculated. To avoid distortions by possible differences in magnification and/or angulation, the measure A was divided by the tooth length (Li) so that xi= Ai/Li. The measures obtained were used to estimate CA, according to the following European formula:
Age = 8.971 + 0.375g + 1.631 × 5 + 0.674N0 − 1.034s – 0.176s ⋅ N0 (1)
where g is a variable, 1 for boys and 0 for girls; ×5 = A5/L5; N0 = number of teeth with closed apices; and s = sum of normalized open apices (s = x1 + x2 + x3 + x4 + x5 + x6 + x7).
Statistical analysis
For each subject, all the morphologic variables were recorded and then entered into Excel file to use them as possible predictive variables for age estimation. All the measurements were carried out by two observers independently. Assessment of both inter and intra observer reliability was checked on a sample of 30 radiographs after an interval of 1 month, and the intraclass correlation coefficient was analyzed.
The sample was randomly categorized into two datasets, i.e., validating dataset and test dataset but stratified on age and gender [Table 2]. Multiple linear regression model with first order interactions was developed using the variables that significantly contributed to age estimations according to stepwise selection method. Original formula of Cameriere et al.[20] was applied into the validating dataset. The test dataset was used to verify the constructed South Indian prediction formula. To compare the age prediction performances, the error of the age prediction was defined as the difference between the dental age (DA) and the CA (DA − CA). For calibration purposes, the mean differences of DA and CA were expressed to quantify the direction of the error (overestimation or underestimation) and the absolute differences of DA and CA, to quantify the magnitude of the error. Paired sample t-test was applied to assess the significances of the difference between DA and CA for the two formulas. Statistical analysis was performed with SPSS 13.0 statistical program (SPSS Inc., Chicago, IL, USA) with significant threshold set at 5%.
Table 2.
Distribution of study sample into sets
| Sample | Gender | Total | |
|---|---|---|---|
| Boys | Girls | ||
| Validating data set | 51 | 49 | 100 |
| Test data set | 50 | 50 | 100 |
| Total | 101 | 99 | 200 |
Results
There were no statistically significant differences observed for both interobserver (P = 0.354) and intraobserver findings, which were carried after an interval of 1 month (P = 0.257 and P = 0.253 for two examiners).
Following the results reported in Cameriere study,[20] subject's age was modeled as a function of the morphological variables and the results showed that not all the variables used for the European model were significant predictors of age in the South Indian sample. Regression analysis of the variables revealed intercept and sum (s) as the significant predictors of the age [Table 3]. The results showed the variables contributed significantly to the fit, yielding the following linear regression formula for the South Indian population:
Table 3.
Stepwise regression analysis, predicting the chronological age for South Indian children
| B | SE | t | P | |
|---|---|---|---|---|
| Intercept | 14.117 | 0.178 | 79.498 | <0.001 |
| Gender | 0.010 | 0.239 | 0.130 | 0.895 |
| Sum | -1.735 | 0.181 | -9.601 | <0.001 |
| N0 | 0.016 | 0.174 | 0.128 | 0.898 |
| x5 | -0.289 | 1.986 | -1.538 | 0.127 |
| s.N0 | -0.099 | 0.246 | -0.448 | 0.655 |
s.N0: Interaction between variables s and N0, SE: Standard error
Age = 14.117 − 0.01g − 1.732W3 + 0.016N0 − 0.289 × 5 − 0.099.s.N0 (2)
Substitution of the variables in Eq. 2 explained 88.3% (R2 = 0.883) of the total deviance. The mean (standard deviation [SD]) CA for boys is 12.61 years (1.39 years). As per the Cameriere formula (Eq. 1), the mean DA for boys is 11.11 years (1.51 years), and according to South Indian formula (Eq. 2), the mean DA is 12.47 years (1.21 years). For girls, the mean CA is 12.97 years (1.69 years). The mean DA is 11.43 years (1.35 years) according to the Cameriere formula and 12.77 years (1.23 years) according to South Indian formula. The accuracy of the results obtained for both formulae in terms of accuracy is shown in Table 4. The distribution of results into the age cohorts is shown in Table 5 and Graphs 1ߝ4.
Table 4.
Summary of mean differences in years between chronological age and dental age European and South Indian formula
| Formula | Gender | n | CA (SD) | DA (SD) | DA-CA (SD) | 95% CI of DA-CA | P** |
|---|---|---|---|---|---|---|---|
| Cameriere formula | Boys | 51 | 12.61 (1.39) | 11.11 (1.51) | −1.50 (1.19) | −1.83-−1.16 | <0.001 |
| South Indian formula | 50 | 12.47 (1.21) | −0.14 (0.86) | −0.36-−0.085 | 0.217 | ||
| Cameriere formula | Girls | 49 | 12.97 (1.69) | 11.43 (1.35) | −1.54 (1.31) | −1.92-−1.16 | <0.001 |
| South Indian formula | 50 | 12.77 (1.23) | −0.20 (1.11) | −0.44-−0.04 | 0.107 |
**Paired t-test. CA: Chronological age, DA: Dental age, SD: Standard deviation, CI: Confidence interval
Table 5.
Mean differences in years between the dental age and the chronological age from European and the South Indian formula per age category of 1 year
| Age group (years) | Boys | Girls | ||||||
|---|---|---|---|---|---|---|---|---|
| n | Cameriere formula | South Indian formula | P** | n | Cameriere formula | South Indian formula | P** | |
| 10 | 9 | −1.51 (−2.25-−0.78) | 0.04 (−0.64-0.72) | <0.001 | 8 | −1.27 (−1.95-−0.58) | 0.08 (−0.49-0.65) | <0.001 |
| 11 | 10 | −0.97 (−1.69-−0.26) | 0.41 (−0.24-1.07) | <0.001 | 10 | −0.58 (−1.54-0.38) | 0.43 (−0.08-0.94) | 0.004 |
| 12 | 9 | −1.17 (−2.09-−0.26) | 0.03 (−0.49-0.56) | <0.001 | 7 | −0.75 (−1.92-0.41) | 0.48 (−0.12-1.09) | 0.002 |
| 13 | 14 | −1.43 (−2.09-−0.77) | −0.29 (−0.63-0.04) | <0.001 | 7 | −1.31 (−2.08-−0.52) | 0.02 (−0.41-0.45) | <0.001 |
| 14 | 7 | −2.11 (−3.05-−1.15) | −0.71 (−0.88-−0.55) | 0.009 | 9 | −2.21 (−2.73-−1.68) | −0.84 (−1.01-−0.66) | <0.001 |
| 15 | 2 | −3.86 (−18.2-10.55) | −1.42 (−1.59-1.75) | 0.328 | 8 | −3.17 (−3.82-−2.52) | −1.35 (−1.56-−1.14) | <0.001 |
**Paired samples t-test. Between parentheses, 95% CIs of DA−CA. CIs: Confidence intervals, CA: Chronological age, DA: Dental age
Graph 1.
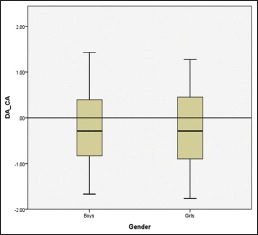
Boxplot of differences between chronological age and dental age for girls and boys according to South Indian formula
Graph 4.
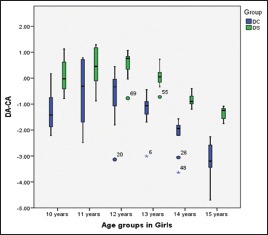
Boxplot of the differences between the dental age and the chronological age for the 10–15-year age groups among girls according to the European and South Indian formula
Graph 2.
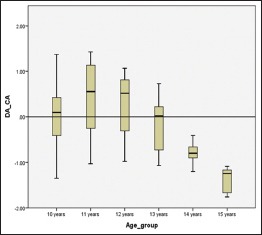
Boxplot of differences between chronological age and dental age for the age groups according to South Indian formula
Graph 3.
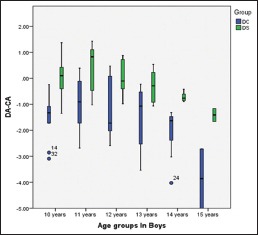
Boxplot of the differences between the dental age and the chronological age for the 10–15-year age groups among boys according to the European and South Indian formula
According to the Cameriere formula, the obtained DA was found to be underestimated which is statistically significant (P < 0.001) with a mean difference of 1.50 years in for boys. For girls, it was underestimated with a mean difference of 1.54 years which is statistically significant (P < 0.001). Similarly, the DA was underestimated with a mean difference of 0.14 years for boys and 0.2 years for girls and the difference between both the genders was not found statistically significant (P = 0.217 and P = 0.107).
Mean differences in years with 95% confidence intervals for age cohorts in both genders are shown in Table 5. In the Cameriere formula, the mean difference between the CA and estimated DA was less than a year per age group was seen only in 11 and 12 years of age group for boys and girls. However, in South Indian formula, the difference of less than a year was seen all the age groups, except 15 years for both genders. The distribution of mean values of absolute differences for all the age groups and both genders is presented in Table 6, Graphs 5 and 6.
Table 6.
Mean absolute differences in years (dental age-chronological age) between the dental age and the chronological age from Cameriere formula and the South Indian formula per age category of 1 year
| Age group (years) | Boys | Girls | ||||||
|---|---|---|---|---|---|---|---|---|
| n | Cameriere formula | South Indian formula | P** | n | Cameriere formula | South Indian formula | P** | |
| 10 | 9 | 0.72 (0.18) | 0.69 (0.17) | 0.804 | 8 | 0.61 (0.21) | 0.54 (0.16) | 0.574 |
| 11 | 10 | 0.94 (0.17) | 0.96 (0.13) | 0.693 | 10 | 1.33 (0.29) | 0.81 (0.15) | 0.073 |
| 12 | 9 | 0.98 (0.22) | 0.56 (0.12) | 0.004 | 7 | 1.32 (0.21) | 0.85 (0.13) | 0.018 |
| 13 | 14 | 0.97 (0.14) | 0.53 (0.06) | 0.016 | 7 | 0.71 (0.16) | 0.41 (0.11) | 0.053 |
| 14 | 7 | 0.68 (0.36) | 0.57 (0.06) | 0.181 | 9 | 0.66 (0.22) | 0.64 (0.07) | 0.030 |
| 15 | 2 | 2.36 (1.13) | 1.28 (0.25) | 0.004 | 8 | 1.63 (0.27) | 1.15 (0.08) | 0.085 |
**Paired samples t-test. Between parentheses. SE of the absolute difference. SE: Standard error
Graph 5.
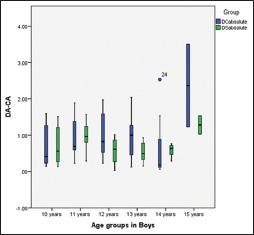
Boxplot of the absolute differences between the dental age and the chronological age for 10–15-year age groups among boys according to the European and South Indian formula
Graph 6.
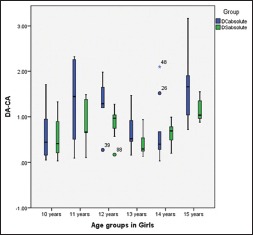
Boxplot of the absolute differences between the dental age and the chronological age for 10–15-year age groups among girls according to the European and South Indian formula
Discussion
Age estimation in childhood can be performed very accurately as great number of age-dependent morphological variables, such as skeletal and dental system, are available. However, at the end of skeletal growth and development, only a few variables such as third molars and hand wrist bones remain to be used for age estimation, thereby limiting the accuracy of the methods applied.[28] Selecting a good method for age estimation in forensic practice is important to fulfill the specific demands in ongoing investigations. A valid age estimating method is both accurate and precise ascribing to no bias and small SD.[29] Accuracy refers how close the estimated DA is closer to CA. An accurate method has no bias, which means that the mean difference the DA and CA is zero or close to zero and the SD of the mean difference of DA and CA refers to the precision or reliability of the estimated age.[28,29,30]
Rai et al. in their study mentioned that values of European sample could not be applied to Indian one, and a new formula is necessary that must account differences between Central/North and South India.[9] They further necessitated to apply Cameriere formula to a new Indian sample to study the effects of nutrition factor. In the present study, Cameriere formula (Eq. 1) fitted on validating dataset of 100 children from Hyderabad (South Indian) population. Based on the results using step-wise regression analysis and variables contributing significantly to the fit, a linear regression formula (Eq. 2) for South Indian was acquired. Later, this new prediction formula was fitted on a test dataset of 100 South Indian children to ascertain whether the new formula could improve the age assessment over Cameriere formula.
For boys, as per the Cameriere formula, the mean DA was underestimated by the range of −1.17–−3.86 years for all age groups, except 11 years which underestimated by −0.97 years. According to the South Indian formula, the mean DA was underestimated by range of −0.29–−1.42 years for age groups 13, 14, and 15, whereas it was overestimated by the range of 0.03–0.41 years for 10, 11, and 12 age groups. The mean differences for the South Indian formula were significantly better than those of Cameriere formula for all age groups except 14 and 15 years. For girls, according to the Cameriere formula, the mean DA was underestimated for all age groups ranging from −0.58 years to −3.17 years. As per the South Indian formula, the DA was underestimated for 14 and 15 years of age groups, whereas it was overestimated by range of 0.02–0.48 years from 10 to 13 years of age groups.
Cameriere et al. in their study proposed that the estimated DA in younger children could be more accurate than that in older children.[20] Findings in our study are in accordance to Cameriere et al. When South Indian prediction formula (Eq. 2) applied to older children (15 years age group), for boys, the mean DA was underestimated by −1.42 years by the range of differences from −1.59 to 1.75 years. For girls, the mean DA was underestimated by −1.35 years with the range of differences from −1.56 to −1.14 years. This significant decrease in accuracy in this age group attributed to the near-complete maturation of the teeth.
In this study, Cameriere formula produced 32% of absolute residuals (difference between DA and CA) falls within the range of ± 1 year and 18% of absolute residuals falls within the range of ± 0.5 years [Table 7]. The South Indian prediction formula produced the results with 72% of residuals falls within the range of ± 1 year and 35% of absolute residuals falls within the range of ± 0.5 years. In a country as large as India, factors such as nutrition, social, and ethical probably influence children's growth. Although South Indian formula had shown near-accurate estimation of real ages of individuals in this study, still it is advisable to reinforce recommendations to verify whether regional background, gender, CA distribution of sample represent major factors controls accuracy and reliability in subadult DA assessment.
Table 7.
Comparison of extent of deviation of dental age from chronological age using European and South Indian formula
| Range of difference (years) | European formula, n (%) | South Indian formula, n (%) |
|---|---|---|
| ±0.5 | 18 (18) | 35 (35) |
| ±1 | 32 (32) | 72 (72) |
Conclusion
It can be concluded from the present findings that newly derived population specific formulae were fairy accurate compared to Cameriere's European formulae. Although South Indian formula had shown near accurate estimation of real ages of individuals, still it is advisable to reinforce recommendations to verify whether regional background, gender, chronological age distribution of sample represent major factors which controls accuracy and reliability in sub adult dental age assessment.
Financial support and sponsorship
Nil.
Conflicts of interest
There are no conflicts of interest.
References
- 1.Perinetti G, Contardo L, Gabrieli P, Baccetti T, Di Lenarda R. Diagnostic performance of dental maturity for identification of skeletal maturation phase. Eur J Orthod. 2012;34:487–92. doi: 10.1093/ejo/cjr027. [DOI] [PubMed] [Google Scholar]
- 2.Gulsahi A, Tirali RE, Cehreli SB, De Luca S, Ferrante L, Cameriere R. The reliability of Cameriere's method in Turkish children: A preliminary report. Forensic Sci Int. 2015;249:319.e1–5. doi: 10.1016/j.forsciint.2015.01.031. [DOI] [PubMed] [Google Scholar]
- 3.Aggrawal A. Estimation of age in the living: In matters civil and criminal. J Anat. 2009 doi: 10.1111/j.1469-7580.2009.01048.x. [Epub ahead of print] [DOI] [PubMed] [Google Scholar]
- 4.Aggrawal A. Age estimation in the living - Some Medicolegal Considerations. [Last accessed on 2019 Dec 24];Anil Aggrawal's Int J Forensic Med Toxicol. 2000 1:23–3. Available from: http://www.anilaggrawal.com/ij/vol_001_no_002/ug001.html . [Google Scholar]
- 5.Kohatsu LI, Tanaka JL, Moraes LC, Filho ME, Moraes ME, Castillo JC. Assessment of a method for dental age assessment in panoramic radiographs and its relationship with the chronological age. Cieˆnc Odontol Bras. 2007;10:19–25. [Google Scholar]
- 6.Schmeling A, Reisinger W, Geserick G, Olze A. Age estimation of unaccompanied minors. Part I. General considerations. Forensic Sci Int. 2006;159(Suppl 1):S61–4. doi: 10.1016/j.forsciint.2006.02.017. [DOI] [PubMed] [Google Scholar]
- 7.Basu K, Tzannatos Z. The global child labor problem: What do we know and what can we do? World Bank Econ Rev. 2003;17:147–73. [Google Scholar]
- 8.Tiwari RR. Child labour in footwear industry: Possible occupational health hazards. Indian J Occup Environ Med. 2005;9:7–9. [Google Scholar]
- 9.Rai B, Kaur J, Cingolani M, Ferrante L, Cameriere R. Age estimation in children by measurement of open apices in teeth: An Indian formula. Int J Legal Med. 2010;124:237–41. doi: 10.1007/s00414-010-0427-7. [DOI] [PubMed] [Google Scholar]
- 10.Demirjian A, Goldstein H, Tanner JM. A new system of dental age assessment. Hum Biol. 1973;45:211–27. [PubMed] [Google Scholar]
- 11.Liversidge HM. Accuracy of age estimation from developing teeth of a population of known age (0–5.4 years) Int J Osteoarchaeol. 1994;4:37–45. [Google Scholar]
- 12.Tanner JM, Whitehouse RH, Marshall WA, Cameron N, Healy MJ, Goldstein H. London: Academic Press; 1975. Assessment of Skeletal Maturity and Prediction of Adult Height (Tw2 Method) [Google Scholar]
- 13.Roche AF, Chumlea C, Thissen D. Springfield, IL: Charles C Thomas; 1988. Assessing the Skeletal Maturity of the Hand-Wrist: Fels Method. [DOI] [PubMed] [Google Scholar]
- 14.Greulich W, Pyle SI. Radiographic Atlas of Skeletal Development of the Hand and Wrist. 2nd ed. Stanford University Press; 1959. [Google Scholar]
- 15.Pelsmaekers B, Loos R, Carels C, Derom C, Vlietinck R. The genetic contribution to dental maturation. J Dent Res. 1997;76:1337–40. doi: 10.1177/00220345970760070201. [DOI] [PubMed] [Google Scholar]
- 16.Liversidge HM. Interpreting group differences using Demirjian's dental maturity method. Forensic Sci Int. 2010;201:95–101. doi: 10.1016/j.forsciint.2010.02.032. [DOI] [PubMed] [Google Scholar]
- 17.Koshy S, Tandon S. Dental age assessment: The applicability of Demirjian's method in south Indian children. Forensic Sci Int. 1998;94:73–85. doi: 10.1016/s0379-0738(98)00034-6. [DOI] [PubMed] [Google Scholar]
- 18.Liversidge HM, Speechly T, Hector MP. Dental maturation in British children: Are Demirjian's standards applicable? Int J Paediatr Dent. 1999;9:263–9. doi: 10.1111/j.1365-263x.1999.00144.x. [DOI] [PubMed] [Google Scholar]
- 19.Anand K, Kant S, Kapoor SK. Nutritional status of adolescent school children in rural North India. Indian Pediatr. 1999;36:810–5. [PubMed] [Google Scholar]
- 20.Cameriere R, Ferrante L, Cingolani M. Age estimation in children by measurement of open apices in teeth. Int J Legal Med. 2006;120:49–52. doi: 10.1007/s00414-005-0047-9. [DOI] [PubMed] [Google Scholar]
- 21.Galić I, Vodanović M, Cameriere R, Nakaš E, Galić E, Selimović E, et al. Accuracy of Cameriere, Haavikko, and Willems radiographic methods on age estimation on Bosnian-Herzegovian children age groups 6-13. Int J Legal Med. 2011;125:315–21. doi: 10.1007/s00414-010-0515-8. [DOI] [PubMed] [Google Scholar]
- 22.Fernandes MM, Tinoco RL, de Braganca DP, de Lima SH, Francesquini Junior L, Daruge Junior E. Age estimation by measurements of developing teeth: Accuracy of Cameriere's method on a Brazilian sample. J Forensic Sci. 2011;56:1616–9. doi: 10.1111/j.1556-4029.2011.01860.x. [DOI] [PubMed] [Google Scholar]
- 23.Balla SB, Venkat Baghirath P, Hari Vinay B, Vijay Kumar J, Babu DB. Accuracy of methods of age estimation in predicting dental age of preadolescents in South Indian children. J Forensic Leg Med. 2016;43:21–5. doi: 10.1016/j.jflm.2016.07.004. [DOI] [PubMed] [Google Scholar]
- 24.Mukherjee KK, Das D. New Delhi: Central Social Welfare Board; 1996. Prostitution in Six Metropolitian Cities of India. [Google Scholar]
- 25.Khan AY. 200 Child Labourers Rescued in Hyderabad. [Last updated on 2016 Apr 02; Last accessed on 2019 Sep 17]. Available from: http://www.thehindu.com/news/cities/Hyderabad/200-childlabourers-rescued-in-hyderabad/article6818252.ece .
- 26.Child Workers Rescued from Hyderabad over Week: Police. [Last updated on 2015 Feb 01; Last accessed on 2019 Sep 17]. Available from: http://www.ndtv.com/south/350-child-workers-rescued-from-hyderabad-over-week-police-736102 .
- 27.Celik S, Zeren C, Celikel A, Yengil E, Altan A. Applicability of the Demirjian method for dental assessment of Southern Turkish children. J Forensic Leg Med. 2014;25:1–5. doi: 10.1016/j.jflm.2014.04.006. [DOI] [PubMed] [Google Scholar]
- 28.Ritz-Timme S, Cattaneo C, Collins MJ, Waite ER, Schütz HW, Kaatsch HJ, et al. Age estimation: The state of the art in relation to the specific demands of forensic practise. Int J Legal Med. 2000;113:129–36. doi: 10.1007/s004140050283. [DOI] [PubMed] [Google Scholar]
- 29.Liversidge HM, Smith BH, Maber M. Bias and accuracy of age estimation using developing teeth in 946 children. Am J Phys Anthropol. 2010;143:545–54. doi: 10.1002/ajpa.21349. [DOI] [PubMed] [Google Scholar]
- 30.Guo YC, Yan CX, Lin XW, Zhou H, Li JP, Pan F, et al. Age estimation in Northern Chinese children by measurement of open apices in tooth roots. Int J Legal Med. 2015;129:179–86. doi: 10.1007/s00414-014-1035-8. [DOI] [PubMed] [Google Scholar]


