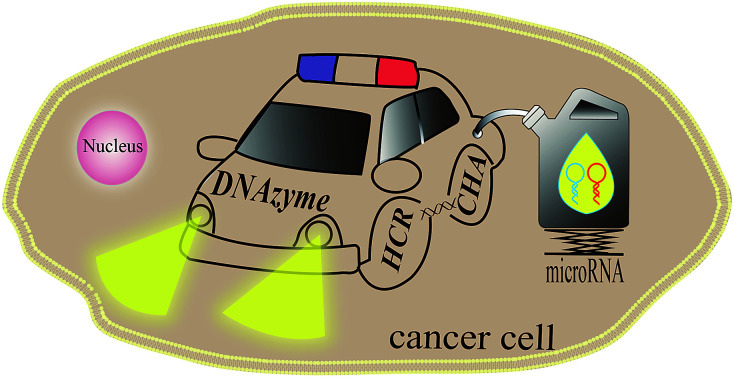
 A rationally and modularly engineered CHA-HCR-DNAzyme circuit was constructed for amplified biosensing and bioimaging with high performance.
Abstract
Biomolecular self-assembly circuits have been well developed for high-performance biosensing and bioengineering applications. Here we designed an isothermal concatenated nucleic acid amplification system which is composed of a lead-in catalyzed hairpin assembly (CHA), intermediate hybridization chain reaction (HCR) and ultimate DNAzyme amplifier units. The analyte initiates the self-assembly of hairpin reactants into dsDNA products in CHA, which generates numerous trigger sequences for activating the subsequent HCR-assembled long tandem DNAzyme nanowires. The as-acquired DNAzyme catalyzed the successive cleavage of its substrates, leading to an amplified fluorescence readout. The sophisticated design of our CHA-HCR-DNAzyme scheme was systematically investigated in vitro and showed dramatically enhanced detection performance. As a general sensing strategy, this CHA-HCR-DNAzyme method enables the amplified analysis of miRNA and its accurate intracellular imaging in living cells, originating from their synergistic signal amplifications. This method shows great potential for analyzing trace amounts of biomarkers in various clinical research studies.
Introduction
Isothermal nucleic acid amplification technologies have recently attracted widespread interest in clinical diagnosis due to their rapid and efficient accumulation of nucleic acid sequences at constant reaction temperature.1,2 This amplification strategy provides an alternative tool for nucleic acid amplification considering the limitation of conventional polymerase chain reactions (PCRs), which always requires complex thermocycling.3 Many enzyme-based isothermal amplification methods have thus been proposed, including rolling circle amplification (RCA),4 loop-mediated isothermal amplification,5 isothermal multiple displacement amplification,6 single primer isothermal amplification,7 and so on. Yet these exonuclease and polymerase enzymes tend to bring low stability and high cost into these different amplification systems. The complicated biological environment might also bring unexpected interference into these different molecular recognition and amplification processes. In addition, these fragile enzymatic systems always encounter product inhibition through the accumulation of pyrophosphate. Thus, it is highly desirable to implement enzyme-free isothermal DNA amplification procedures in high-performance biosensing research studies.
DNAzymes are important nucleic acids that show fascinating catalytic functions.8 They can mimic the functions of protein enzymes and catalyze a wide range of chemical reactions, including DNA ligation and cleavage.9–11 The multiple turnover rate of a DNAzyme turns it into an ideal signal amplification candidate for high-performance biosensing applications. The efficiency of DNAzyme amplification could be improved by integrating its functional sequence with other amplification means.12,13 Besides DNAzymes, the catalytic DNA circuit, including the hybridization chain reaction (HCR)14–16 and catalyzed hairpin assembly (CHA),17,18 is also emerging as a typical enzyme-free amplification strategy. The HCR mediates the target-initiated autonomous cross-opening of hairpin reactants for assembling long nicked dsDNA copolymers.19,20 The generated dsDNA products could be utilized as versatile nanocarriers by encoding various functional DNA sequences or small molecules.21–23 CHA promotes the catalyzed hybridization of hairpins for assembling numerous dsDNA products without consuming the target. These approaches could be facilely conjugated with other amplification procedures to achieve an improved sensing performance.24,25 For example, the RCA reaction can be encoded with tandem initiator sequences acting as CHA triggers, which then realize an extra CHA amplification without any interference in the initial RCA amplification.26 All these nonenzymatic amplification methods have been applied for detecting different biologically important analytes (nucleic acids,27,28 proteins,29–31 small molecules,32 and metal ions33) with different transduction approaches, such as fluorescence,34,35 colorimetry,36–38 chemiluminescence (CL)39 and electrochemical approaches.40,41
MicroRNAs (miRNAs) are attractive post-transcriptional small RNA molecules 19–23 nucleotides in length, and can regulate the expression of given messenger RNAs (mRNAs) and the corresponding proteins.42–44 And their dysregulated expressions are closely related to cancer development, progression and therapy resistance,45 which makes them a clinically crucial class of diagnostic and prognostic biomarkers.46 MiRNA-21(miR-21) has been demonstrated to be an upregulated miRNA in many tumor types.47,48 Thus the development of highly sensitive miRNA sensing platforms represents an urgent requirement for detecting low abundance miRNAs without elaborate separation and enrichment processes in the complex intracellular environment.49,50 Both the catalytic DNA circuit and functional DNAzyme are utilized for intracellular miRNA imaging.51,52 Yet these individual amplifiers are always confronted with limited versatilities and unsatisfactory signal gains, which could be solved by their integration with other amplification strategies.53–55 The in-depth integration of these different amplification methods attracts more attention since a higher signal gain is expected to be realized in live cell analysis.
Herein, we constructed an isothermal autonomous nucleic acid amplification system, consisting of CHA, HCR and DNAzyme amplifiers, for high-performance biosensing applications. The analyte is translated by the CHA amplifier to assemble plenty of dsDNA products to realize the first stage of amplification. And the generated CHA products are encoded with HCR trigger sequences for stimulating the subsequent HCR-involved cross-opening of hairpin reactants and for simultaneously activating the DNAzyme biocatalysts. In the ultimate DNAzyme amplification stage, the HCR-assembled DNAzyme then sustainably cleaves its substrates, leading to an amplified fluorescence readout. By full use of these different amplification means, our isothermal amplification strategy realized the sensitive and selective detection of the analyte. The CHA-HCR-DNAzyme method could be considered as a general amplification module for realizing the amplified analysis of miR-21 in an ideal buffer and for accurately localizing the target in living cells via fluorescence imaging. This approach could be extended to parallelly analyze more different biomarkers upon their integration with other recognition elements (aptamers) and multiple fluorescence transductions, and shows great potential for clinical diagnosis and prognosis.
Results and discussion
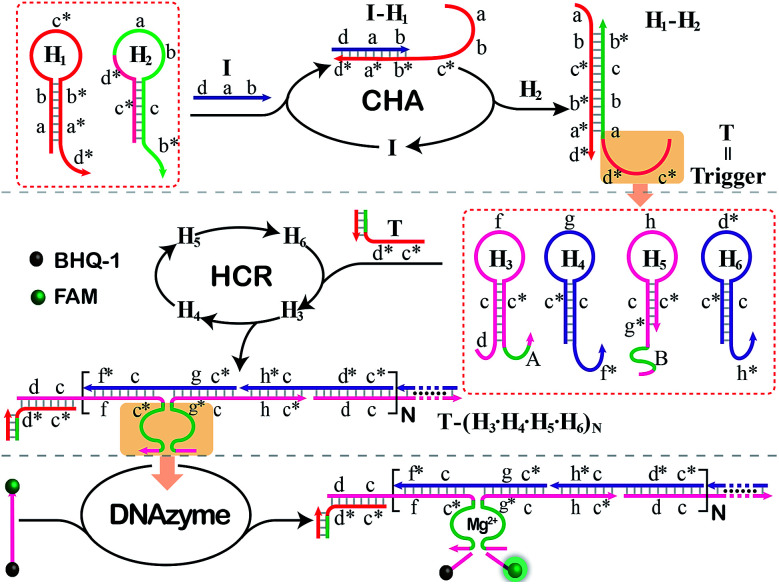
The principle of our isothermal cascading CHA-HCR-DNAzyme system is schematically illustrated in Fig. 1. The autonomous CHA-HCR-DNAzyme circuit is composed of CHA, HCR and DNAzyme amplifier units. All of the hairpins involved in the system are metastable (domains x and x* are complementary to each other), and can only be initiated by their corresponding triggers to form the energetically favored nicked long dsDNA nanowires analogous to alternating polymers. The product of upstream CHA should be able to trigger downstream HCR to integrate the efficient CHA-HCR-DNAzyme circuit. That is, the trigger of the HCR circuit should be carefully engineered and encoded into the hairpin reactants of the CHA system. In addition, the split DNAzyme of HCR reactants should also be reconstituted into DNAzyme subunits, of which the DNAzyme can only be activated by the concomitant assembly of DNA nanowires. The hierarchical hybridization acceleration character of this CHA-HCR-DNAzyme circuit contributes to the progressively sequential signal amplification.
Fig. 1. Architecture of the isothermal autonomous CHA-HCR-DNAzyme cascading amplifier that was composed of CHA, HCR and DNAzyme amplifiers.
To start with, two hairpins, H1 and H2, are involved in the upstream CHA amplifier (Fig. S1†). H1 concludes the sequence b*–a*–d* (5′→3′) which is complementary to sequence d–a–b of the initiator (I). I triggers the opening of H1 by complementary base pairing to yield the I–H1 assembly with an exposed single chain a–b–c*. The as-exposed sequence of I–H1 could hybridize with H2 to regenerate I, and to produce a H1–H2 complex with a newly exposed c*–d* domain (T) for triggering downstream HCR. Meanwhile, the released I participates in the next cycle of CHA reaction for generating plenty of the H1–H2 product, thus realizing sensitive detection without undesired systematic fluctuations at the first amplification stage.
The exposed T of H1–H2 then triggers the subsequent HCR system (Fig. S2†) by recognizing the sequence d–c of H3 (where domain x–y* is complementary to sequence y–x*). This results in an accessible sequence, f–c*, for docking to H4 and yielding an intermediate structure, T-H3·H4, of which H4 opens and releases the hidden single-stranded region c*–g for hybridizing with H5 and producing an intermediate T-H3·H4·H5 hybrid. The opened H5 further unfolds H6 to construct an intermediate T-H3·H4·H5·H6 hybrid where a single-stranded T analog sequence (c*–d*) is released. The exposed T sequence triggers the multiple HCR-assembled polymeric nanowires, thus further realizing the secondary extensive amplification of the biorecognition event. In the assembled HCR polymers, H4 bridges the two separated DNAzyme segments of H3 and H5 for continuously integrating DNAzyme units. In the presence of Mg2+-ion cofactors, these newly assembled DNAzymes are activated to cleave a specific ribonucleotide-containing substrate S whereby each end was attached with FAM and BHQ-1 fluorophores, respectively. The close proximity of these two fluorophores leads to the efficient quenching of FAM. And the DNAzyme-cleaved substrate triggers the continuous separation of FAM and BHQ-1, leading to a substantial fluorescence increase in the DNAzyme amplification stage. In summary, the cascading CHA-HCR-DNAzyme circuit can realize an enhanced amplification efficiency by implementing an exquisite integration of CHA, HCR, and DNAzyme schemes. The target-catalyzed successive CHA reaction amplifies the HCR trigger for further generating tandem DNAzyme nanowires with permanent activity. Each DNAzyme catalyses the cleavage of substrates to generate an amplified fluorescence readout. The triple cascading amplification circuit was then systematically investigated as follows.
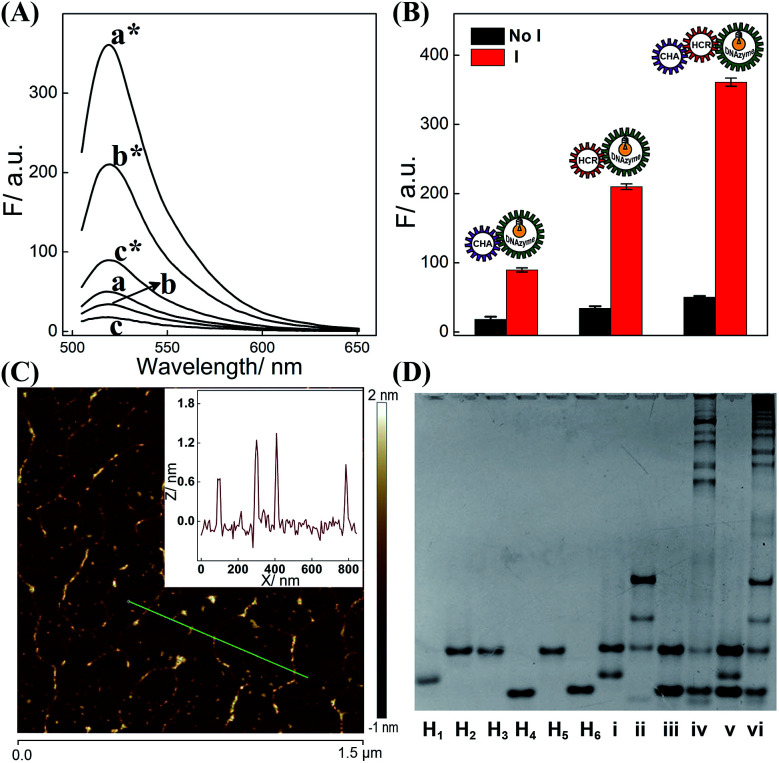
The dual amplifier (CHA-DNAzyme or HCR-DNAzyme) and the triple amplifier (CHA-HCR-DNAzyme) were successively investigated for demonstrating the efficient biocircuit integration. As shown in Fig. 2A, both CHA-DNAzyme (curve c*) and HCR-DNAzyme (curve b*) systems show a signal readout for their dual amplification, while the triple amplifier (CHA-HCR-DNAzyme) shows a much higher fluorescence signal (curve a*), indicating a dramatic signal amplification efficiency of the triply amplified system. What is more, the comparison of dual and triple amplifiers also exemplifies the synergistic cooperation between CHA and HCR upon combining them, which realizes a relatively better sensing efficiency than that of them alone. Meanwhile, these three different DNA circuits show nearly no signal leakage without their corresponding initiators (Fig. 2B), demonstrating the metastable nature of the triply amplified circuit. To further exhibit the upstream CHA-amplified HCR reaction, atomic force microscopy (AFM) was carried out to investigate the supramolecular copolymer product of CHA-HCR-DNAzyme amplifier (Fig. 2C). Micrometer-long linear DNAs are obtained (∼1.5 nm in height, a characteristic height of dsDNA nanochains) for the activated CHA-HCR-DNAzyme system (Fig. 2C inset). The partial bundling might be attributed to the cross-interactions between DNAzyme subunits. In contrast, only tiny spots are observed without any assembled products for the non-activated CHA-HCR-DNAzyme system (Fig. S3†), suggesting that no undesired hybridization occurred between these hairpin components.
Fig. 2. (A) Fluorescence behaviors of the CHA-DNAzyme (c*/c), HCR-DNAzyme (b*/b), and CHA-HCR-DNAzyme (a*/a) systems with/without their corresponding initiators for 4 h. (B) Bar representation of the fluorescence spectra (λ = 520 nm) for the dual and triple amplifiers (note: as for the HCR-DNAzyme, “I” refers to “T”). (C) AFM characterization of the triggered CHA-HCR-DNAzyme biocircuits. Inset: cross-section height analysis of the generated dsDNA nanowires. (D) Native gel electrophoresis analysis of the intact CHA-HCR-DNAzyme system: lanes i to vi represent the CHA reactant, CHA product, HCR reactant, HCR product, CHA-HCR-DNAzyme reactant, and CHA-HCR-DNAzyme product, respectively.
The feasibility of the proposed strategy was further verified by a 9% PAGE experiment (Fig. 2D). As compared to the H1 + H2 mixture (lane i), an obvious band of CHA product appeared upon its incubation with 50 nM initiator (lane ii). Similarly, the HCR mixture produces long dsDNA polymers upon its incubation with the 50 nM trigger (lane iv) while showing no spontaneous hybridization reaction without its trigger (lane iii). As expected, almost no background leakage is observed for the CHA-HCR-DNAzyme mixture without the trigger (lane v). Compared to the HCR control system (lane iv), the CHA-HCR-DNAzyme system generates a tremendous amount of high-molecular-weight HCR copolymers (lane vi), showing consistent efficiency with previous fluorescence assay (Fig. 2B). Both gel electrophoresis and AFM experiments demonstrated that the CHA-HCR-DNAzyme system proceeded with high efficiency as anticipated. Thus, the triply integrated amplification system could be utilized as a new high-performance sensing platform for a broad range of biosensing applications. Meanwhile, the high catalytic activity of the CHA-HCR-DNAzyme-assembled DNAzyme was also investigated by introducing an intact DNAzyme as a positive control (Fig. S4†).
For a deeper understanding of the effects of each hairpin on the reaction process, the one hairpin-excluded CHA-HCR-DNAzyme system was studied by a fluorescence experiment (Fig. S5†). Despite the introduction of an initiator, no obvious signal difference was observed for the H1-, H2-, or H4-lacking system. This is reasonable for the efficient blockage of the CHA-producing HCR target or DNAzyme-assembling procedures. Yet the H6-lacking CHA-HCR-DNAzyme system retained the function of CHA-DNAzyme (slight fluorescence enhancement) even when the HCR process is blocked. Thus, all hairpin components are indispensable to the execution of their specific functions as anticipated.
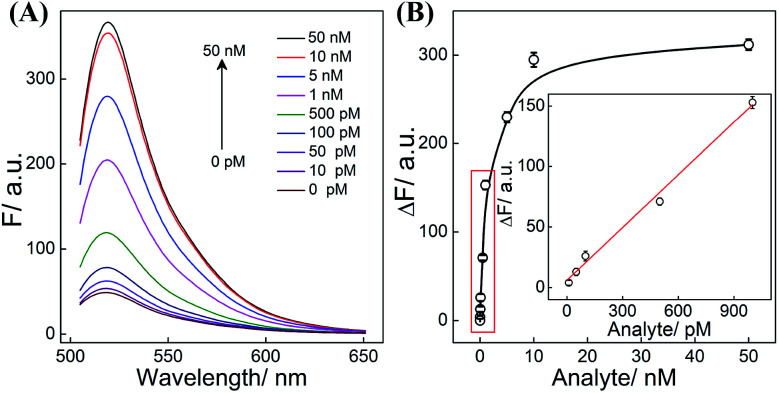
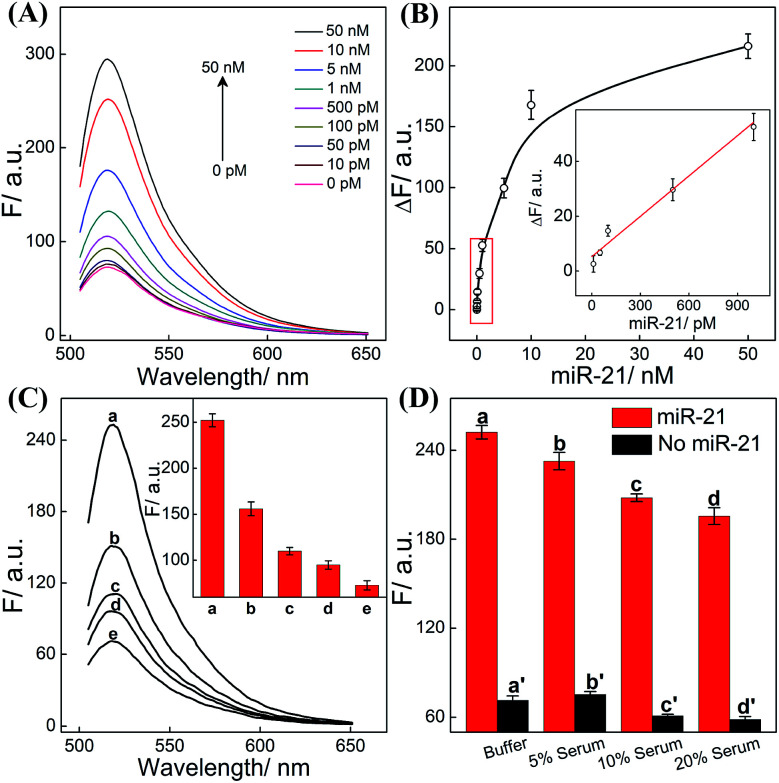
All reaction procedures play crucial roles in the ultimate performance of our system. All of these hairpins need to be designed to realize a better signal to background ratio (S/B), e.g., H1 was screened to ensure a better reaction performance (Table S3 and Fig. S6†). As for DNAzyme, the present CHA-HCR-DNAzyme system (consisting of two DNAzyme-subunit-integrated hairpins) represents the optimized amplifier (Fig. S7†). The amplification efficiency decreased after further integration of a DNAzyme subunit into the present triple amplifier, which is attributed to the steric hindrance of the newly introduced DNAzyme-subunit-grafted hairpins. In other words, the cross-hybridization rate and completeness of HCR could be tremendously slowed down by the DNAzyme grafting fragments which could not be compensated by the doubly assembled DNAzyme. What's more, the concentration of hairpin reactants and DNAzyme substrate was appropriately optimized to guarantee a higher signal gain without undesired leakage (Fig. S8†). Under the optimized conditions, the CHA-HCR-DNAzyme system was applied for DNA detection in vitro. The mixture of CHA-HCR-DNAzyme and substrate S was challenged with a DNA initiator of varied concentrations for 4 h. From the resulting fluorescence spectra (Fig. 3A), the absolute fluorescence change (ΔF) increases substantially with increasing concentrations of analyte (Fig. 3B). A quasi-linear correlation is obtained between ΔF and the concentration of the initiator ranging from 10 pM to 1 nM (Fig. 3B inset). Based on the traditional 3σ/s calculation method, the limit of detection (LOD) was found to be 1.5 pM for the CHA-HCR-DNAzyme amplifier. In addition, the CHA-DNAzyme and HCR-DNAzyme amplifier controls were also used to analyze the same target of varied concentrations (Fig. S9†). At a higher concentration of the same initiator I (50 nM), the integrated CHA-HCR-DNAzyme circuit revealed ∼1.7-fold higher amplification than that of the HCR-DNAzyme system, and ∼3-fold higher amplification than that of the CHA-DNAzyme system. Note that the CHA-HCR-DNAzyme system shows a much higher amplification capacity than the CHA-DNAzyme control system at a lower concentration range. This is reasonable since the amplification capacity of CHA, HCR and DNAzyme components could be more sufficiently realized for the integrated CHA-HCR-DNAzyme system, especially at the lower concentration of analyte.
Fig. 3. (A) Fluorescence behaviors of the CHA-HCR-DNAzyme circuit upon its incubation with various concentrations of DNA initiator. (B) The corresponding calibration curve of the CHA-HCR-DNAzyme circuit. Inset: the resulting linear correlation curve. Here ΔF represents the absolute fluorescence change of the FAM fluorophore. The results are expressed as mean ± SD (n = 5).
Besides sensitivity, the selectivity of the CHA-HCR-DNAzyme system was also examined by using one-, two-, and three-base mutant DNAs (Ia, Ib, and Ic, Fig. S10†). No obvious fluorescence enhancement was observed for these mutants, implying that the CHA-HCR-DNAzyme system affords high selectivity by realizing a clear single-base discrimination. The enzyme-free homogeneous CHA-HCR-DNAzyme realized the ultrasensitive detection of the DNA target within several hours which is substantially shorter than that of the autocatalytic DNAzyme system.56 The integrated CHA-HCR-DNAzyme strategy shows a similar or even better sensing performance than that of the other nonenzymatic fluorescence microRNA detection strategies consisting of CHA, HCR or DNAzyme strategies (Table S2†), thus showing great promise for the bioanalytical and clinical applications. The satisfactory sensitivity and robustness characters of the newly developed CHA-HCR-DNAzyme system are attributed to the synergistic signal amplification of these integrating CHA, HCR and DNAzyme components.
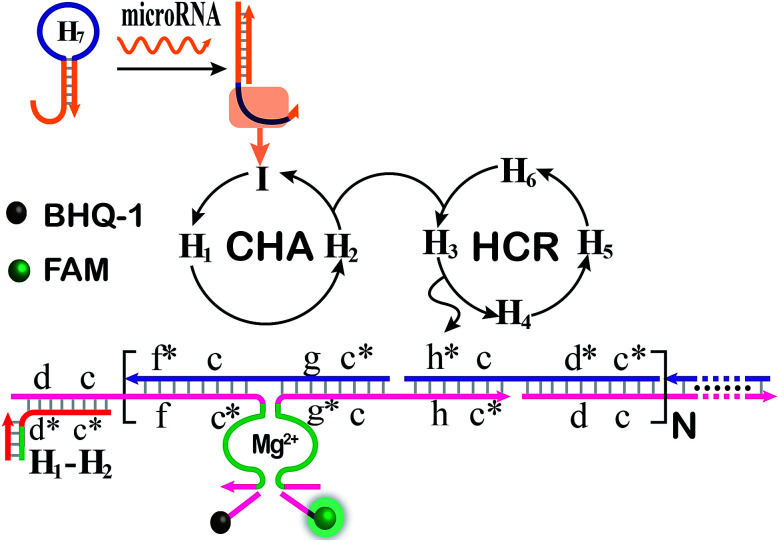
The CHA-HCR-DNAzyme system can be applied as a general amplifier for various applications by further integrating an intermediate recognition/transduction element. Here, a sensing module hairpin H7 is designed to include an miR-21-recognition function and thus consists of an miR-21 complementary sequence and the locked I sequence. As illustrated in Fig. 4, the miR-21 opens H7 to expose the CHA initiator I (dark blue) that triggers the effective CHA-HCR-DNAzyme amplification. The fluorescence spectra of the extended sensing platform were acquired after the CHA-HCR-DNAzyme system was incubated with various concentrations of miR-21 (ranging from 10 pM to 50 nM) for 4 h (Fig. 5A). The relationship between fluorescence changes (ΔF) and miR-21 concentrations was formulated to acquire the calibration curve (Fig. 5B). A detection limit of 5 pM was obtained for the miR-21 analyte (Fig. 5B inset), demonstrating that this CHA-HCR-DNAzyme system could be adopted for a general amplification module for analyzing any other analyte with the incorporation of a recognition module. Apart from sensitivity, we further investigated the selectivity of our CHA-HCR-DNAzyme system by discriminating the complementary miR-21 analyte from its one-, two-, and three-base mutant interfering sequences (miR-21-a, miR-21-b, and miR-21-c, respectively). As shown in Fig. 5C, compared to miR-21 (curve a), the one-base mutant sequence (miR-21-a) shows a dramatically decreased fluorescence transduction (curve b). The fluorescence intensity exhibited little enhancement for other mutant initiators (two-based mutant miR-21-b and three-base mutant miR-21-c), implying that the CHA-HCR-DNAzyme system affords high selectivity for analyzing miR-21 with single-base mutation discrimination. Moreover, we also examined the selectivity of this system by choosing several representative interfering nucleic acids, including β-actin mRNA, son DNA and let-7a miRNA (Fig. S11†). All of these interfering RNAs generate no obvious fluorescence response that is approximately equal to the blank control without an initiator. This indicates the high selectivity of our newly established CHA-HCR-DNAzyme-amplified miR-21 detection strategy. Moreover, the performance of the miR-21-detecting system shows little interference in complex biological fluids, e.g., diluted 10% and 20% serum buffer (Fig. 5D).
Fig. 4. Schematic illustration of the miR-21-analyzing CHA-HCR-DNAzyme amplifier by integrating the miRNA-sensing module consisting of an auxiliary miR-21-recognition hairpin.
Fig. 5. (A) Fluorescence behaviors of the present CHA-HCR-DNAzyme biosensor upon its incubation with various concentrations of miR-21 analyte. (B) Validation of the fluorescence intensity variation (λ = 520 nm) versus miR-21 concentration. Inset: the linear correlation of the fluorescence intensity (λ = 520 nm) vs. miR-21 concentration. Here ΔF represents the absolute fluorescence change of FAM. (C) Fluorescence behaviors of the updated CHA-HCR-DNAzyme system for analyzing different analytes (10 nM): (a) miR-21, (b) miR-21-a, (c) miR-21-b, (d) miR-21-c, and (e) no analyte. Inset: bar representation of the fluorescence intensity changes (λ = 520 nm). (D) Bar representation of the fluorescence intensity changes (λ = 520 nm) of the miR-21-analyzing CHA-HCR-DNAzyme circuit in different serum solutions.
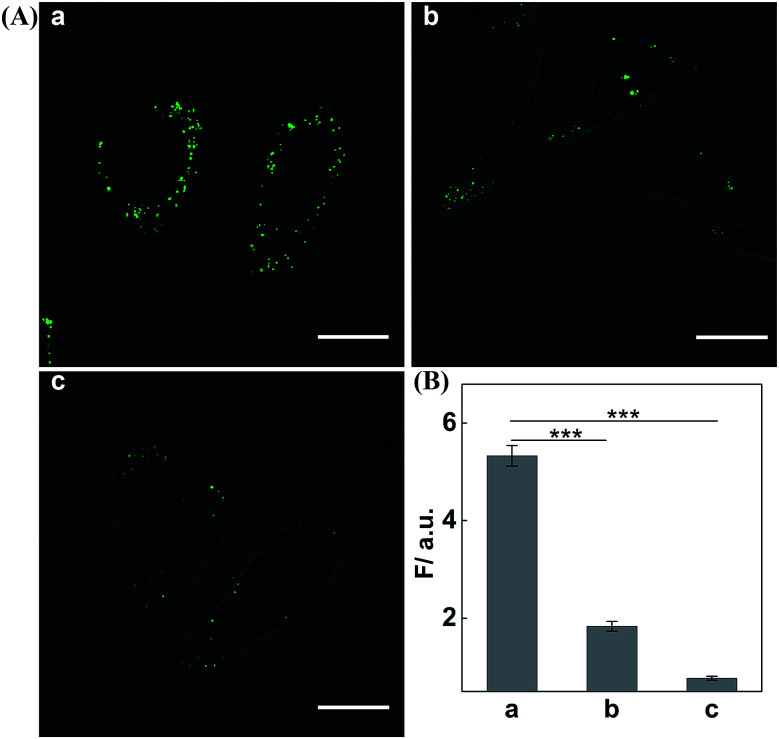
Having demonstrated the satisfactory amplification efficiency of the updated CHA-HCR-DNAzyme in an ideal buffer, we then challenged the present system for miR-21 imaging in living cells (Fig. 6). After transfection into MCF-7 cells via lipofectamine 3000, these hairpin reactants were further incubated with cells at 37 °C for 4 h. Obviously, a significant green fluorescence image was observed in MCF-7 cells (sample a, Fig. 6A). As expected, the miR-21 inhibitor-pretreated MCF-7 cells show a much lower fluorescence readout (sample b, Fig. 6A), demonstrating that it is miR-21 that mediates the amplified intracellular imaging procedure. Almost no fluorescence readout is observed for the H4-excluded CHA-HCR-DNAzyme-imaging MCF-7 cells (sample c, Fig. 6A). Evidentially, the fluorescence readout of MCF-7 cells is ascribed to miR-21-specific assembly of hairpin probes. The relative fluorescence intensity of the CHA-HCR-DNAzyme imaging system is acquired from the statistical analysis of large quantities of their respective living cells (Fig. 6B). To further emphasize the present miR-21-imaging system in different cell lines, Hela cells were introduced as an indispensable control with low miR-21 expression and showed a weak fluorescence readout. MRC-5 cells were introduced as an important negative control since they were encoded with no miR-21 expression, and showed negligible fluorescence readout (Fig. S12†). A low expression of miR-21 is observed in MRC-5 cells, as compared to MCF-7 cells. Clearly, the CHA-HCR-DNAzyme system can distinguish different cell lines based on their different endogenous miRNA expressions. The H6-excluded CHA-HCR-DNAzyme imaging system was also employed as a CHA-DNAzyme control, and showed a significantly reduced intracellular signal amplification performance (Fig. S13†). And, almost no fluorescence signal was observed when the indispensable H1, H2 or H4 was excluded from the system. This result is consistent with that of fluorescence assay, indicating that all hairpin reactants are indispensable to the present intracellular CHA-HCR-DNAzyme circuit.
Fig. 6. (A) Living cell CHA-HCR-DNAzyme imaging of miR-21 in (a) MCF-7 cells or (b) anti-miR-21 antisense inhibitor-pretreated MCF-7 cells. (c) The H4-excluded CHA-HCR-DNAzyme imaging of MCF-7 cells was executed as an important control. Scale bar: 20 μm. (B) The fluorescence enhancement of these different miR-21-sensing platforms. Columns a, b, and c correspond to the confocal images a, b and c of (A), respectively. These results are expressed as mean ± SD (standard deviation, n = 5) (***P < 0.001).
Conclusions
In conclusion, we have developed a versatile signal amplification platform based on the isothermal concatenated CHA-HCR-DNAzyme strategy for robust intracellular imaging applications. The upstream CHA recognizes the specific initiator to produce numerous dsDNA strands with encoding HCR trigger sequences for stimulating the cross-opening of hairpin reactants in downstream HCR. The HCR-generated long dsDNA copolymers are encoded with tandemly integrated DNAzymes that cleave the fluorophore-labeled substrates to generate a tremendously amplified fluorescence readout. This CHA-HCR-DNAzyme system realized the efficient transduction of an analyte through the multiple successive amplification cascades. The successive reaction accelerations and the multiple guaranteed recognitions make the present system a highly robust and promising sensing platform. And this sophisticated DNA circuit is facilely designed for recognizing and localizing other different analytes by further integrating an additional molecular recognition module. Specially, the molecularly engineered CHA-HCR-DNAzyme system was used for highly efficient and accurate intracellular miR-21 sensing. This versatile sensing platform could be utilized to detect trace amounts of intracellular biomarkers by introducing aptamers or other functional DNA sequences in clinical research studies.
Experimental
Materials
4-(2-Hydroxyethyl) piperazine-1-ethanesulfonic acid sodium salt (HEPES), magnesium chloride and sodium chloride were purchased from Sigma-Aldrich (MO, USA). The DNA marker, GelRed, fetal bovine serum (FBS) and Lipofectamine 3000 transfection reagent were purchased from Invitrogen (Carlsbad, CA). Dulbecco's Modified Eagle Medium (DMEM) and Opt-MEM were purchased from HyClone (Logan, Utah, USA). MCF-7 and MRC-5 cells were obtained from Shanghai Institutes for Biological Sciences (SIBS). Trypsin was purchased from Genview (USA). All DNA primers were synthesized and HPLC-purified by Sangon Biotech Co., Ltd. (Shanghai, China). The ribonucleobase (rA)-containing substrate was purchased from TaKaRa Bio. Inc. (Dalian, China), and was labeled at the 5′- and 3′-ends with the fluorophore/quencher pair (FAM/BHQ-1). Table S1† depicts the sequences of all used oligonucleotides.
Fluorescence assay
To ensure that the hairpin reactants form the desired secondary structure, all hairpins need to be annealed at 95 °C for 5 min, rapidly cooled and left to stand at 25 °C for two hours at least in HEPES buffer (10 mM, pH 7.2, 1.0 M NaCl, 50 mM MgCl2). Double-distilled ultrapure water was used in all experiments. The concentrations of hairpins involved in this system were optimized to get a better signal to background ratio. Then, different concentrations of target DNA were mixed with all the as-prepared hairpins (200 nM) and DNAzyme substrate (0.5 μM) for acquiring the fluorescence changes with an interval of 10 min at 25 °C. As for the analysis of miR-21, the concentration of “helper” hairpin H7 was 50 nM, and the concentration of any hairpin was consistent with DNA detection. Fluorescence measurements were conducted using a spectrophotometer with λex = 490 nm and λem = 520 nm for FAM, respectively.
Gel electrophoresis verification
A 9% native polyacrylamide gel was prepared and rapidly transferred to a glue frame and polymerized for 40 min at 25 °C. The gel was washed with water three times and soaked in 1 × TBE buffer. The loading samples were prepared via a loading buffer and then added into these different notches of gel for electrophoresis. PAGE was run at room temperature at 120 V for 3 h. After staining in a newly prepared Gel-Red solution (20 min), the gel was transferred to a plate and was characterized by using a FluoChem FC3 (Protein Simple, USA) imaging system.
Atomic force microscopy (AFM) imaging
The newly cleaved mica surface (Structure Probe Inc., USA) was incubated in MgCl2 (5 mM) for 10 min at room temperature, and then rinsed with ultrapure water for adsorbing these different DNA nanostructures. The hairpin mixture/product (with/without initiator I) of the CHA-HCR-DNAzyme system was diluted with HEPES buffer (10 mM, pH 7.2), and then deposited on the pretreated mica surface. The topological features of our CHA-HCR-DNAzyme mixture and products were characterized in tapping mode by using Multimode-8 AFM apparatus equipped with a NanoScope V controller (Bruker).
Cell culture and imaging analysis
Here the cell culture media are Dulbecco's Modified Eagle Medium (DMEM) and Modified Eagle Medium (MEM), which are respectively used for human breast cancer cells (MCF-7, Hela) and human embryo pulmonary fibroblasts cells (MRC-5). These culture media were further supplemented with 10% FBS and 1% penicillin/streptomycin for growing the corresponding cells at 37 °C in a humidified atmosphere containing 5% CO2. These different cells were digested with trypsin, re-suspended in 1 mL of new DMEM or MEM medium, and incubated in glass-bottom culture dishes for 12 h before cell attachment. The miR-21-analyzing CHA-HCR-DNAzyme reactants were incubated in 200 μL of Opti-MEM for 5 min, and were then introduced into another 200 μL of Opti-MEM (containing 5 μL lipofectamine 3000) for 10 min. The old cell media were replaced with a new Opti-MEM medium (containing 50 μL FBS and the updated CHA-HCR-DNAzyme reactants) for incubating at 37 °C for 4 h. Afterward, the cultured cells were washed three times with PBS and were transferred into 500 μL of freshly prepared medium for confocal laser scanning microscopy (CLSM) characterization. For the miR-21 inhibitor experiment, MCF-7 cells were transfected with an extra anti-miR-21 oligonucleotide to reduce the intracellular miR-21 content (1 h) and then were transfected and incubated with the CHA-HCR-DNAzyme system for 4 h. All cellular fluorescence images were acquired using a CLSM system (Leica TCS SP8). And these samples were excited at 488 nm with an accompanying emission ranging from 500 nm to 580 nm for the green channel of the FAM fluorophore.
Conflicts of interest
The authors declare no conflict of interest.
Supplementary Material
Acknowledgments
This work is supported by the National Basic Research Program of China (973 Program, 2015CB932601), the National Natural Science Foundation of China (21503151 and 81602610), and Fundamental Research Funds for the Central Universities (2042018kf0210).
Footnotes
†Electronic supplementary information (ESI) available: DNA sequences, CHA-CHR-DNAzyme optimization, control experiments for the CHA-HCR-DNAzyme-imaging system, and time imaging for the CHA-HCR-DNAzyme system in living cells. See DOI: 10.1039/c9sc03552d
References
- Zhang H., Li F., Dever B., Li X., Le X. Chem. Rev. 2012;113:2812–2841. doi: 10.1021/cr300340p. [DOI] [PubMed] [Google Scholar]
- Ren X., Zhang K., Deng R., Li J. Chem. 2019;05:1–22. [Google Scholar]
- Zhao Y., Chen F., Li Q., Wang L., Fan C. Chem. Rev. 2015;115:12491–12545. doi: 10.1021/acs.chemrev.5b00428. [DOI] [PubMed] [Google Scholar]
- Zhang L., Zhu G., Zhang C. Anal. Chem. 2014;86:6703–6709. doi: 10.1021/ac501645x. [DOI] [PubMed] [Google Scholar]
- Tomita N., Mori Y., Kanda H., Notomi T. Nat. Protoc. 2008;3:877–882. doi: 10.1038/nprot.2008.57. [DOI] [PubMed] [Google Scholar]
- Li Y., Teng X., Zhang K., Deng R., Li J. Anal. Chem. 2019;91:3989–3996. doi: 10.1021/acs.analchem.8b05238. [DOI] [PubMed] [Google Scholar]
- Kurn N., Chen P., Heath J. D., Kopf-Sill A., Stephens K. M., Wang S. Clin. Chem. 2005;51:1973–1981. doi: 10.1373/clinchem.2005.053694. [DOI] [PubMed] [Google Scholar]
- Breaker R. R., Joyce G. F. Chem. Biol. 1994;1:223–229. doi: 10.1016/1074-5521(94)90014-0. [DOI] [PubMed] [Google Scholar]
- Ward W. L., Plakos K., DeRose V. J. Chem. Rev. 2014;114:4318–4342. doi: 10.1021/cr400476k. [DOI] [PMC free article] [PubMed] [Google Scholar]
- Wang H., Chen Y., Wang H., Liu X., Zhou X., Wang F. Angew. Chem., Int. Ed. 2019;58:1–6. [Google Scholar]
- Feng G., Luo X., Lu X., Xie S., Deng L., Kang W., He F., Zhang J., Lei C., Lin B., Huang Y., Nie Z., Yao S. Angew. Chem., Int. Ed. 2019;58:6590–6594. doi: 10.1002/anie.201901320. [DOI] [PubMed] [Google Scholar]
- Wang F., Elbaz J., Orbach R., Magen N., Willner I. J. Am. Chem. Soc. 2011;133:17149–17151. doi: 10.1021/ja2076789. [DOI] [PubMed] [Google Scholar]
- Wang F., Freage L., Orbach R., Willner I. Anal. Chem. 2013;85:8196–8203. doi: 10.1021/ac4013094. [DOI] [PubMed] [Google Scholar]
- Chang X., Zhang C., Cheng L., Sun Y., Zhang M., Zhao Y., Yang L., Han D., Tan W. J. Am. Chem. Soc. 2019;141:12738–12743. doi: 10.1021/jacs.9b05470. [DOI] [PubMed] [Google Scholar]
- Dirks R. M., Pierce N. A. Proc. Natl. Acad. Sci. U. S. A. 2004;101:15275–15278. doi: 10.1073/pnas.0407024101. [DOI] [PMC free article] [PubMed] [Google Scholar]
- Huang J., Wu Y., Chen Y., Zhu Z., Yang X., Yang C. J., Wang K., Tan W. Angew. Chem., Int. Ed. 2011;50:401–404. doi: 10.1002/anie.201005375. [DOI] [PubMed] [Google Scholar]
- Li B., Jiang Y., Chen X., Ellington A. D. J. Am. Chem. Soc. 2012;134:13918–13921. doi: 10.1021/ja300984b. [DOI] [PMC free article] [PubMed] [Google Scholar]
- Gu Y., Song J., Li M., Zhang T., Zhao W., Xu J., Liu M., Chen H. Anal. Chem. 2017;89:10585–10591. doi: 10.1021/acs.analchem.7b02920. [DOI] [PubMed] [Google Scholar]
- Wang F., Lu C., Willner I. Chem. Rev. 2014;114:2881–2941. doi: 10.1021/cr400354z. [DOI] [PubMed] [Google Scholar]
- Zhang H., Wang Y., Zhang H., Liu X., Lee A., Huang Q., Wang F., Chao J., Liu H., Li J., Shi J., Zuo X., Wang L., Wang L., Cao X., Bustamante C., Tian Z., Fan C. Nat. Commun. 2019;10:1006. doi: 10.1038/s41467-019-09004-4. [DOI] [PMC free article] [PubMed] [Google Scholar]
- Fan D., Zhu J., Liu Y., Wang E., Dong S. Nanoscale. 2016;8:3834–3840. doi: 10.1039/c6nr00032k. [DOI] [PubMed] [Google Scholar]
- Zhu Z., Wu R., Li B. Chem. Sci. 2019;10:1953–1961. doi: 10.1039/c8sc04875d. [DOI] [PMC free article] [PubMed] [Google Scholar]
- Liu N., Jiang Y., Zhou Y., Xia F., Guo W., Jiang L. Angew. Chem., Int. Ed. 2013;52:2007–2011. doi: 10.1002/anie.201209162. [DOI] [PubMed] [Google Scholar]
- Kahn J. S., Trifonov A., Cecconello A., Guo W., Fan C., Willner I. Nano Lett. 2015;15:7773–7778. doi: 10.1021/acs.nanolett.5b04101. [DOI] [PubMed] [Google Scholar]
- Li B., Chen X., Ellington A. D. Anal. Chem. 2012;84:8371–8377. doi: 10.1021/ac301944v. [DOI] [PMC free article] [PubMed] [Google Scholar]
- Jiang Y., Li B., Milligan J. N., Bhadra S., Ellington D. A. J. Am. Chem. Soc. 2013;135:7430–7433. doi: 10.1021/ja4023978. [DOI] [PMC free article] [PubMed] [Google Scholar]
- Wu Z., Liu G., Yang X., Jiang J. J. Am. Chem. Soc. 2015;137:6829–6836. doi: 10.1021/jacs.5b01778. [DOI] [PubMed] [Google Scholar]
- He X., Zeng T., Li Z., Wang G., Ma N. Angew. Chem., Int. Ed. 2016;55:3073–3076. doi: 10.1002/anie.201509726. [DOI] [PubMed] [Google Scholar]
- Wang Q., Pan M., Wei J., Liu X., Wang F. ACS Sens. 2017;2:932–939. doi: 10.1021/acssensors.7b00168. [DOI] [PubMed] [Google Scholar]
- Zhang K., Gao H., Deng R., Li J. Angew. Chem., Int. Ed. 2019;58:4790–4799. doi: 10.1002/anie.201809006. [DOI] [PubMed] [Google Scholar]
- Wang Y., Li Z., Weber T., Hu D., Lin C., Li J., Lin Y. Anal. Chem. 2013;85:6775–6782. doi: 10.1021/ac400858g. [DOI] [PubMed] [Google Scholar]
- Lu L., Zhang X., Kong R., Yang B., Tan W. J. Am. Chem. Soc. 2011;133:11686–11691. doi: 10.1021/ja203693b. [DOI] [PMC free article] [PubMed] [Google Scholar]
- Wang Z., Lee J., Lu Y. Adv. Mater. 2008;20:3263–3267. [Google Scholar]
- Wang H., Li C., Liu X., Zhou X., Wang F. Chem. Sci. 2018;9:5842–5849. doi: 10.1039/c8sc01981a. [DOI] [PMC free article] [PubMed] [Google Scholar]
- Zhou M., Teng X., Li Y., Deng R., Li J. Anal. Chem. 2019;91:5295–5302. doi: 10.1021/acs.analchem.9b00124. [DOI] [PubMed] [Google Scholar]
- Liu J., Lu Y. J. Am. Chem. Soc. 2003;125:6642–6643. doi: 10.1021/ja034775u. [DOI] [PubMed] [Google Scholar]
- Wu C., Fan D., Zhou C., Liu Y., Wang E. Anal. Chem. 2016;88:2899–2903. doi: 10.1021/acs.analchem.5b04796. [DOI] [PubMed] [Google Scholar]
- Wang Z., Wang L., Zhang Q., Tang B., Zhang C. Chem. Sci. 2018;9:1330–1338. doi: 10.1039/c7sc04813k. [DOI] [PMC free article] [PubMed] [Google Scholar]
- Li X., Zhang H., Tang Y., Wu P., Xu S., Zhang X. ACS Sens. 2017;2:810–816. doi: 10.1021/acssensors.7b00178. [DOI] [PubMed] [Google Scholar]
- Xiao Y., Rowe A. A., Plaxco K. W. J. Am. Chem. Soc. 2007;129:262–263. doi: 10.1021/ja067278x. [DOI] [PubMed] [Google Scholar]
- Liang M., Pan M., Hu J., Wang F., Liu X. ChemElectroChem. 2018;5:1380–1386. [Google Scholar]
- Bartel D. P., Chen C. Z. Nat. Rev. Genet. 2004;5:396–400. doi: 10.1038/nrg1328. [DOI] [PubMed] [Google Scholar]
- Ha M., Kim V. N. Nat. Rev. Mol. Cell Biol. 2014;15:509–524. doi: 10.1038/nrm3838. [DOI] [PubMed] [Google Scholar]
- Tang X., Deng R., Sun Y., Ren X., Zhou M., Li J. Anal. Chem. 2018;90:10001–10008. doi: 10.1021/acs.analchem.8b02471. [DOI] [PubMed] [Google Scholar]
- Bartel D. P. Cell. 2004;116:281–297. doi: 10.1016/s0092-8674(04)00045-5. [DOI] [PubMed] [Google Scholar]
- Wu Q., Wang H., Gong K., Shang J., Liu X., Wang F. Anal. Chem. 2019;91:10172–10179. doi: 10.1021/acs.analchem.9b02181. [DOI] [PubMed] [Google Scholar]
- Volinia S., Calin G. A., Liu C., Ambs S., Cimmino A., Petrocca F., Visone R., Lorio M., Roldo C., Ferracin M. Proc. Natl. Acad. Sci. U. S. A. 2006;103:2257–2261. doi: 10.1073/pnas.0510565103. [DOI] [PMC free article] [PubMed] [Google Scholar]
- Asangani I. A., Rasheed S. A., Nikolova D. A., Leupold J. H., Colburn N. H., Post S., Allgayer H. Oncogene. 2008;27:2128–2136. doi: 10.1038/sj.onc.1210856. [DOI] [PubMed] [Google Scholar]
- Zhang K., Song S., Huang S., Yang L., Min Q., Wu X., Lu F., Zhu J. Small. 2018;14:1802292. doi: 10.1002/smll.201802292. [DOI] [PubMed] [Google Scholar]
- Zou L., Wu Q., Zhou Y., Gong X., Liu X., Wang F. Chem. Commun. 2019;55:6519–6522. doi: 10.1039/c9cc02637a. [DOI] [PubMed] [Google Scholar]
- He D., He X., Yang X., Li H. Chem. Sci. 2017;8:2832–2840. doi: 10.1039/c6sc04633a. [DOI] [PMC free article] [PubMed] [Google Scholar]
- Yang L., Liu C., Ren W., Li Z. ACS Appl. Mater. Interfaces. 2012;4:6450–6453. doi: 10.1021/am302268t. [DOI] [PubMed] [Google Scholar]
- Wei J., Gong X., Wang Q., Pan M., Liu X., Liu J., Xia F., Wang F. Chem. Sci. 2018;9:52–61. doi: 10.1039/c7sc03939e. [DOI] [PMC free article] [PubMed] [Google Scholar]
- Wang F., Elbaz J., Willner I. J. Am. Chem. Soc. 2012;134:5504–5507. doi: 10.1021/ja300616w. [DOI] [PubMed] [Google Scholar]
- Yang L., Wu Q., Chen Y., Liu X., Wang F., Zhou X. ACS Sens. 2018;4:110–117. doi: 10.1021/acssensors.8b01000. [DOI] [PubMed] [Google Scholar]
- Wang F., Elbaz J., Teller C., Willner I. Angew. Chem., Int. Ed. 2011;50:295–299. doi: 10.1002/anie.201005246. [DOI] [PubMed] [Google Scholar]
Associated Data
This section collects any data citations, data availability statements, or supplementary materials included in this article.


