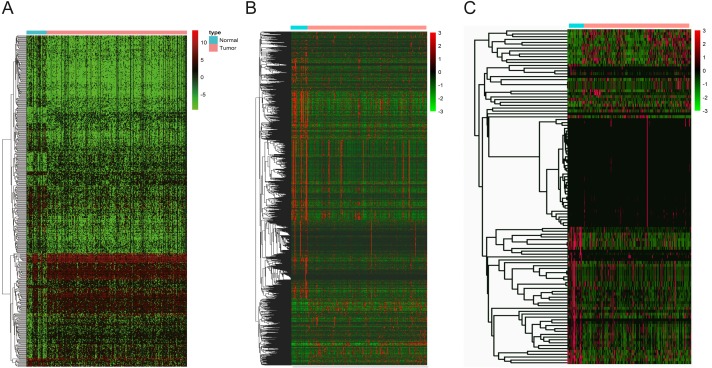
Figure 3. The heatmaps of DEGs between OSCC and normal tissues.
(A) DElncNAs; (B) DEmiRNAs; (C) DEmRNAs. Each row represented a kind of RNA, and each column referred to one sample. Expression values are represented by the color scale. Redder grids are higher in expression values, while greener ones are lower.

