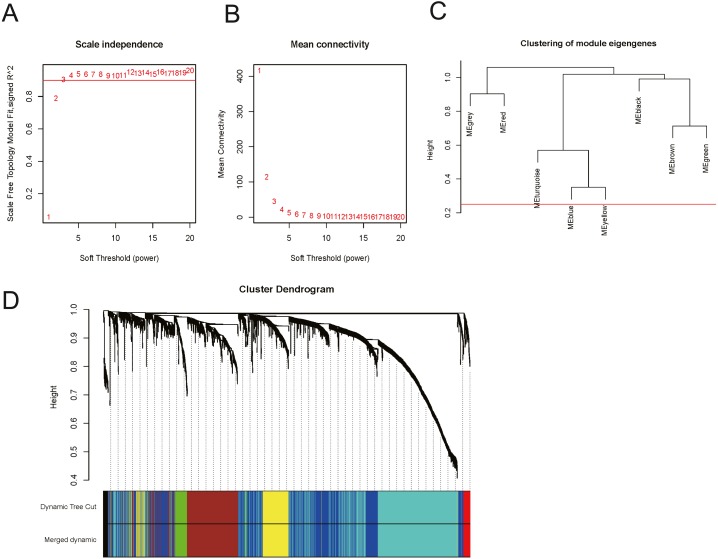
Figure 5. Construction of co-expression modules by the “WGCNA” package.
(A) and (B) Analysis of network topology for various soft-thresholding powers. (A) The scale-free fit index as a function of the soft-thresholding power is shown. (B) The mean connectivity as a function of the soft-thresholding power is displayed. (C) The cluster dendrogram of module eigengenes. (D) The cluster dendrogram of genes in TCGA. Each branch in the figure represents one gene, and every colour below represents one co-expression module.

