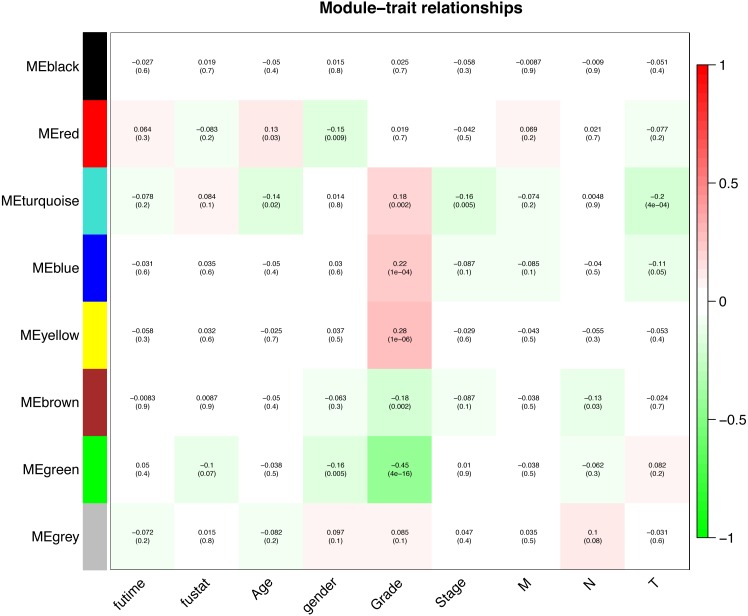
Figure 7. Module-trait associations were evaluated by correlations between MEs and clinical traits.
Each row corresponds to a module eigengene, column to a trait. Each cell contains the corresponding correlation (first line) and p-value (second line). The cells are color coded by the correlation according to the color legend. Red module positively correlated to age (p < 0.05). Turquoise module negatively correlated to age (p < 0.05). Red and green modules negatively correlated to gender (p < 0.05). Turquoise, blue and yellow modules positively correlated to grade (p < 0.05). Green and brown modules negatively correlated to grade (p < 0.05). Turquoise module negatively correlated to stage (p < 0.05). Brown module negatively correlated to pathologic N stage (p < 0.05). Turquoise and blue modules negatively correlated to pathologic T stage (p < 0.05).

