Abstract
Context
Aristolochia manshuriensis Kom (Aristolochiaceae) (AMK) is known for toxicity and mutagenicity.
Objective
The tumorigenic role of AMK has yet to be understood.
Materials and methods
AMK extracts were extracted from root crude drug. SD (Sprague Dawley) rats underwent gavage with AMK (0.92 g/kg) every other day for 10 (AMK-10) or 20 (AMK-20) weeks. Stomach samples were gathered for histopathological evaluation, microarray and mRNA analysis.
Results
The gastric weight to body weight ratio (GW/BW) is 1.7 in the AMK-10 cohort, and 1.8 in AMK-20 cohort compared to control (CTL) cohort. Liver function was damaged in AMK-10 and AMK-20 rats compared to CTL rats. There were no significant changes of CRE (creatinine) in AMK-10 and AMK-20 rats. Histopathological analysis revealed that rats developed dysplasia in the forestomach in AMK-10 rats, and became gastric carcinoma in AMK-20 rats. Genes including Mapk13, Nme1, Gsta4, Gstm1, Jun, Mgst2, Ggt6, Gpx2, Gpx8, Calml3, Rasgrp2, Cd44, Gsr, Dgkb, Rras, and Amt were found to be critical in AMK-10 and AMK-20 rats. Pik3cb, Plcb3, Tp53, Hras, Myc, Src, Akt1, Gnai3, and Fgfr3 worked in AMK-10 rats, and PDE2a and PDE3a played a pivotal role in AMK-20 rats.
Discussion and conclusions
AMK induced benign or malignant gastric tumours depends on the period of AMK administration. Genes including Mapk13, Nme1, Gsta4, Gstm1, Jun, Mgst2, Ggt6, Gpx2, Gpx8, Calml3, Rasgrp2, Cd44, Gsr, Dgkb, Rras, Amt, Pik3cb, Plcb3, Tp53, Hras, Myc, Src, Akt1, Gnai3, Fgfr3, PDE2a, and PDE3a were found to be critical in aristolochic acid-induced gastric tumour process.
Keywords: Gastric tumour, benign tumour, malignant tumour, aristolochic acids
Introduction
Aristolochia manshuriensis Kom (Aristolochiaceae) (AMK), is known for toxicity and mutagenicity due to the components of aristolochic acids (AAs) (Hwang et al. 2012). AMK induces forestomach toxicity prior to kidney injury in rats, and stimulates gastric carcinoma (Wang et al. 2018). Gastric cancer (GC) is the fourth most common cancer and causes almost one million deaths one year worldwide (Toyoda et al. 2013). Helicobacter pylori infection, lifestyle (including high-salt diet and smoking), obesity, radiation exposure, Epstein-Barr virus infection, and environmental factors increase GC risk (Bilici et al. 2012; Menheniott et al. 2016). GC initiates with chronic gastritis to gastric atrophy, intestinal metaplasia, dysplasia, and finally to adenocarcinoma (Menheniott et al. 2016). Variable genetic alterations involving oncogenes activation, tumour suppressor genes mutations, DNA repair genes, microsatellite instability, and loss of heterozygosity (LOH) have been reported in gastric cancers (Gigek et al. 2017). AAs preferentially bind to purines in DNA, and induce adenine-to-thymine mutations almost exclusively (Pfeifer 2015). We generated a gastric tumour rat model through oral administration of AMK; the rats developed precancerous lesion in forestomach after 10-weeks of AMK treatment, and progressed to gastric carcinoma after 20-weeks of AMK administration. We analysed the fundamental molecular events linking gastric inflammation to GC, and mechanisms from early stage of GC to invasive carcinoma in our current work.
Materials and methods
AMK extracts were obtained from root crude drug as previously reported (Wang et al. 2016). Briefly, AMK was percolated with 95% ethanol, 15.87 g of crude drug was concentrated to 1 g of AMK extracts. AMK extracts were analysed using high-performance liquid chromatography (HPLC) on a Waters 600E system (Waters, Milford, MA, USA) equipped with ultraviolet (UV) absorbance, refractive index detectors, and a C18 column (Kromasil, Sweden). 1.09% AA I was detected in the AMK extracts.
Animals
Sprague Dawley (SD) rats were obtained from Beijing vital river laboratory animal technology corporation. Rats were maintained in cages in a room equipped with an air-filtering system, and they were kept on a 12 h light/dark cycle. The animals were fed with standard food, and given sterilised water. This study was carried out in strict accordance with the recommendations in the guide for the care and use of laboratory animals of the institute of Chinese materia medica, China academy of Chinese medical sciences. The protocols were approved by the committee on the ethics of animal experiments of the institute of Chinese materia medica, China academy of Chinese medical sciences (permit number: 2007010).
Animal experiments
SD rats were separated as control mice (CTL, n = 6), 10 weeks of AMK administrated rats (AMK-10, n = 6), and 20 weeks of AMK administrated rats (AMK-20, n = 5). Rats underwent gavage with AMK (0.92 g/kg) every other day for 10 or 20 weeks, and then were sacrificed. Stomach samples were placed in 4% paraformaldehyde for histopathological evaluation, and frozen at 80 °C or liquid nitrogen until mRNA (messenger RNA) analysis. Serum was collected for biochemical analysis including ALT (alanine transaminase), AST (aspartate aminotransferase), and CRE (creatinine).
Histopathology
Rat stomach samples were fixed in 4% paraformaldehyde, embedded in paraffin, sectioned at a thickness of 3 μm, and then stained with haematoxylin and eosin (H & E) for morphological evaluation. The histological alterations observed in the slides were blindly scored: 1, gastric mucosal papillary hyperplasia, absent of dysplasia; 2, I degree dysplasia in gastric mucosal basal cell; 3, II degree dysplasia in gastric mucosal basal cell; 4, III degree dysplasia in gastric mucosal basal cell; 5, invasive gastric carcinoma.
GO enrichment analysis
We obtained these differentially expressed genes (DEGs) through the limma R package (version: 3.36.5). DEGs was selected based on fold change > 2.0, p < 0.05. The gene ontology (GO) is a structured and controlled vocabulary of terms. The terms are subdivided in three non-overlapping ontologies, molecular function (MF), biological process (BP), and cellular component (CC), and now are used widely for annotating genes and gene products. To detect the over-representation of gene-ontology annotations among the large list of genes from high-throughput experiments such as microarray and next-generation sequencing (NGS), which is known as an effective way to hunt the downstream targets. Parent-Child-Intersection method was used for enrichment analysis, Benjamini-Hochberg was used for multiple tests correction, and curated association was used for enrichment analysis.
Pathway enrichment analysis, pathway networks and global signal transduction networks
Kyoto encyclopaedia of genes and genomes (KEGG) is a knowledge base for systematic analysis of gene functions, linking genomic information with higher order functional information, and now is used widely for pathway related analysis. The hypergeometric distribution was used to calculate the pathway enrichment, and FDR (false discovery rate) was used to adjust the p-values for multiple comparisons.
After parsing the whole KEGG database, all study genes involved pathways were extracted, and the study pathway network was generated with the help of the pathway topology in the KEGG database. The specific gene network of one pathway was generated based on the pathway topology analysis, and the study gene network was generated after mapping to the generated reference KEGG gene network. Based on KEGG, and Biocarta and Reatome databases, pathway analysis was conducted to uncover significant pathways from the differential expression genes. Fisher's exact test was used to choose the significant pathways, and p ≤ 0.05 was considered as the significance threshold.
Based on KEGG database, significantly changed pathways were identified and connected in a pathway network to show the relationship between these pathways. Each pathway in the network was measured by counting its number of upstream and downstream pathways, which were shown as in-degree, out-degree. A higher degree of a pathway indicated that it regulated or was regulated by other pathways, implying a more important role in the signalling network.
The gene signal transduction networks (signal-net) was used to demonstrate the interaction between the differentially expressed genes. The 20% top degree genes were selected, and then these genes were searched on National Centre for Biotechnology Information (NCBI) (https://www.ncbi.nlm.nih.gov/pubmed/?term=), we selected genes with the relationship with gastric cancer or cancer, and then built the gene signal-net. The gene signal-net was constructed based on the gene degree calculated by KEGG database, and was visualised by software cytoscape (version: 3.5.0). Nodes in network graphs were the dominating genes and edges represent relationship types including the activation or phosphorylation of signalling. The degree is denoted by the number of links from one node to others. Genes with higher degrees mean they have a more crucial position in the signal-net. Thus, the signal transduction network analysis is a method to select the core key genes which have a powerful ability to modulate other genes. The nodes in the network were connected when their corresponding encoded gene products were connected directly or indirectly by a linker gene in the interaction network. The network for each gene was measured by counting the number of upstream, downstream genes or binding genes, which were shown as in-degree, out-degree or degree, respectively. A higher degree indicated that a gene regulated or was regulated by more genes, implying a more important role in the signalling network.
Quantitative real-time PCR
Ribonucleic acid (RNA) was extracted from stomach tissues using a total RNA kit (Omega, Norcross, GA, USA). Aliquots containing 1 μg of RNA were used for reverse transcription with an oligo-dT primer (Toyobo, Osaka, Japan). Real-time quantitative PCR (polymerase chain reaction) (qPCR) was performed as previously described (Ma et al. 2014) using a Roche 480 instrument and SYBR green PCR master mix (Roche, Mannheim, Germany). The primers (Sangon biotech, Beijing, China) were listed in Table 1. Expression levels were calculated using the 2–△△Ct method, with the Ct values normalised using GAPDH as an internal control.
Table 1.
Primers used for qRT-PCR.
| Gene symbol | Forward | Reverse |
|---|---|---|
| Pik3cb | ACAATTCTGGGGACGACCTG | GCTACACAGTAGCCAGCACA |
| Plcb3 | GGAGCAAGAGATGTGGAAGGA | GAGCTAGCACGTAGGCCATC |
| Tp53 | CCCCTGAAGACTGGATAACTGT | TCTCCTGACTCAGAGGGAGC |
| Hras | GTATAGTGCCATGCGGGACC | TCTGCTCCCTGTACTGATGGA |
| Myc | CCCCTGAAAAGAGCTCCTCG | TCGTGACTGTCGGGTTTTCC |
| Src | CTCGGCAAGGTGCCAAATTC | CACGTCCGACTTGATGGTGA |
| Akt1 | TGATCAAGATGACAGCATGGAG | GCCACTGGCTGAGTAGGAGA |
| Gnai3 | TGTTTTGAGGGAGTGACAGCA | TTCGGTTCATTTCCTCGTCC |
| Fgfr3 | AGCGACAGGTGTCCTTGG | AGGACAGGACCTTCTCCTGA |
| PDE3a | GAGCGCGAGGACCAAGGAA | GCCCATGAGCTGCTCCCT |
| PDE2a | CCAGGGAGTAGAGACGACCG | CAGTCTCCACTTTGGGGAGCA |
Results
AMK induced gastric tumour in rats
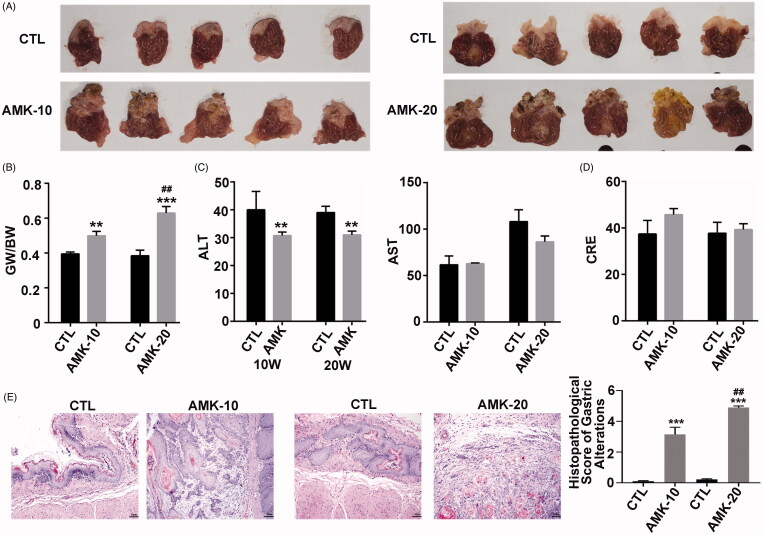
SD rats underwent gavage with AMK (0.92 g/kg) for 10 or 20 weeks every other day. Mucosa papillary, gastric neoplasms were observed in the forestomach both in AMK-10 rats and AMK-20 rats. The tumours were more and bigger in the AMK-20 group than in the AMK-10 group (Figure 1(A)). The gastric weight to body weight ratio (GW/BW) is 1.7 in the AMK-10, and 1.8 in AMK-20 cohort compared with CTL cohort (Figure 1(B)). ALT and AST are important indicators for evaluating acute liver injury clinically. CRE is an indicator to assess acute renal injury. AMK reduced ALT levels significantly (Figure 1(C)). There were no significant alterations in CRE and AST levels in AMK-10 or AMK-20 rats compared with CTL rats (Figure 1(C–D)). Gastric morphology analysis showed that AMK-10 rats formed dysplasia in gastric mucosal basal cell, and AMK-20 rats developed invasive gastric carcinoma (Figure 1(E)).
Figure 1.
AMK induces gastric carcinoma in rats. (A) Representative explanted rat stomach. (B) Comparison of GW/BW among various rat cohorts at different time points after AMK treatment. (C) Comparison of serum ALT and AST among various rat cohorts at different time points after AMK treatment. (D) Comparison of serum CRE among various rat cohorts at different time points after AMK treatment. (E) H & E-stained and histopathological alterations scores of gastric sections. n = 5–6 per group. ***p ≤ 0.001 vs. CTL rats; **p ≤ 0.01 vs. CTL rats; ##p ≤ 0.01 vs. AMK-10 rats.
Differential gene expression in AMK mediated gastric tumour
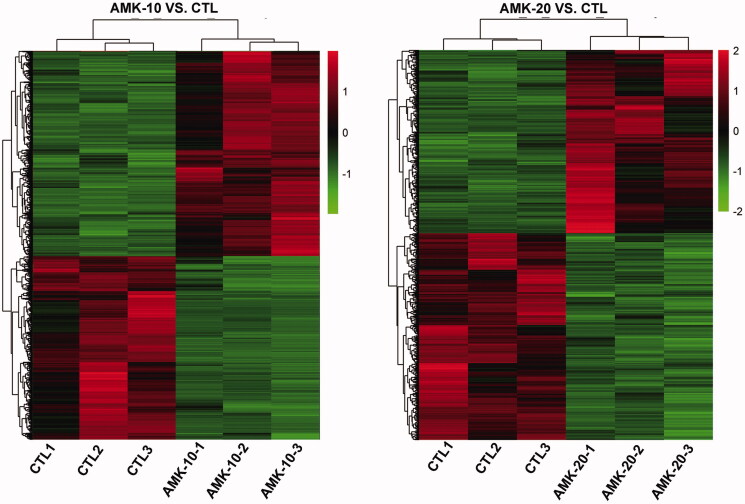
To compare the difference of gene expression between AMK treated rats and the CTL rats, we performed a genome-wide transcriptional analysis through the NimbleGen rat gene expression microarrays. Results of microarray were analysed through hierarchical clustering and tree view analysis in rats treated with or without AMK at different time point (Figure 2). The heat map showed a distinguishable mRNA expression profiling in AMK-10 or AMK-20 group in contrast to CTL group, respectively.
Figure 2.
Results of microarray were analysed through hierarchical cluster in rats treated with or without AMK at different time point. n = 3 per group.
Go analysis of differential gene expression in AMK stimulated gastric tumour
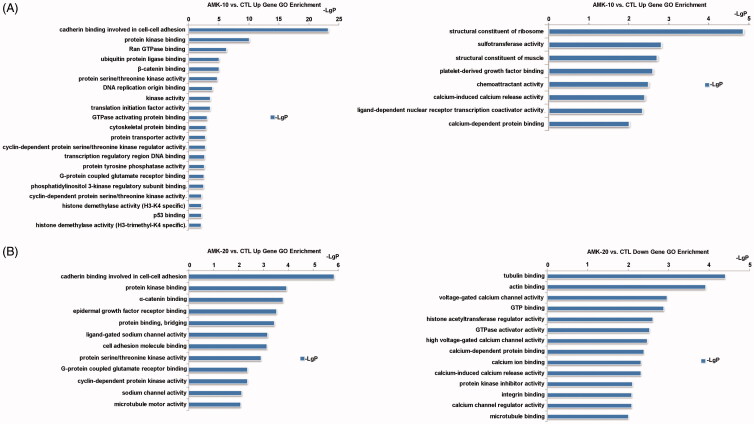
The differentially expressed genes were subjected to GO analysis. GO analysis which is the functional classification by NCBI is used to calculate the major function of the differentially expressed genes. The significant top upregulated GOs induced by 10 weeks AMK treatment in rats were cadherin binding involved in cell-cell adhesion, protein kinase binding, Rna (ras-related nuclear protein) GTPase binding, ubiquitin protein ligase binding, ß-catenin binding, protein serine/threonine kinase activity, DNA replication origin binding, kinase activity, translation initiation factor activity, GTPase activating protein binding, cytoskeletal protein binding, protein transporter activity, cyclin-dependent protein serine/threonine kinase regulator activity, transcription regulatory region DNA binding, protein tyrosine phosphatase activity, G-protein coupled glutamate receptor binding, phosphatidylinositol 3-kinase regulatory subunit binding, cyclin-dependent protein serine/threonine kinase activity, histone demethylase activity (H3-K4 specific), p53 binding, and histone demethylase activity (H3-trimethyl-K4 specific) (Figure 3(A)). The significant top downregulated GOs induced in AMK-10 rats were structural constituent of ribosome, sulfotransferase activity, structural constituent of muscle, platelet-derived growth factor binding, chemoattractant activity, calcium-induced calcium release activity, ligand-dependent nuclear receptor transcription coactivator activity, and calcium-dependent protein binding (Figure 3(A)). The significant top upregulated GOs in AMK-20 rats were cadherin binding involved in cell-cell adhesion, protein kinase binding, α-catenin binding, epidermal growth factor receptor binding, protein binding, bridging, ligand-gated sodium channel activity, cell adhesion molecule binding, protein serine/threonine kinase activity, G-protein coupled glutamate receptor binding, cyclin-dependent protein kinase activity, sodium channel activity, and microtubule motor activity (Figure 3(B)). The significant top downregulated GOs in AMK-20 rats were tubulin binding, actin binding, voltage-gated calcium channel activity, GTP binding, histone acetyltransferase regulator activity, GTPase activator activity, high voltage-gated calcium channel activity, calcium-dependent protein binding, calcium ion binding, calcium-induced calcium release activity, protein kinase inhibitor activity, integrin binding, calcium channel regulator activity, and microtubule binding (Figure 3(B)).
Figure 3.
Gene alteration induced by AMK in rats through GO analysis. (A) Up-regulated and down-regulated genes by comparing AMK-10 rats and CTL rats. (B) Up-regulated and down-regulated genes by comparing AMK-10 rats and CTL rats. n = 3 per group.
Pathway analysis of differential gene expression in AMK caused gastric tumour
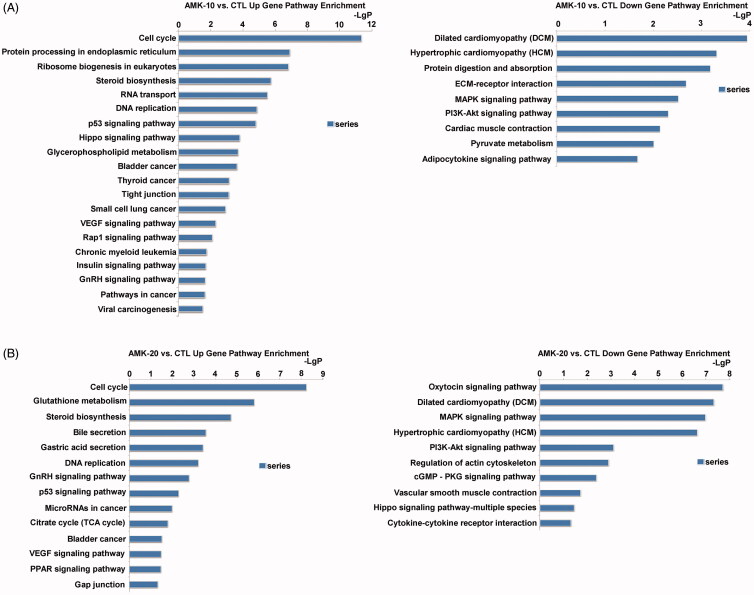
The significant pathways are analysed according to the functions and interactions of differential genes which based on the KEGG database. The significant top upregulated gene pathways in AMK-10 rats were cell cycle, protein processing in endoplasmic reticulum, ribosome biogenesis in eukaryotes, steroid biosynthesis, RNA transport, DNA replication, p53 signalling pathway, hippo signalling pathway, glycerophospholipid metabolism, bladder cancer, thyroid cancer, tight junction, small cell lung cancer, VEGF signalling pathway, Rap1 signalling pathway, chronic myeloid leukaemia, insulin signalling pathway, GnRH signalling pathway, pathways in cancer, and viral carcinogenesis (Figure 4(A)). The significant top downregulated gene pathways in AMK-10 rats were ECM-receptor interaction, MAPK signalling pathway, PI3K-Akt signalling pathway, cardiac muscle contraction, pyruvate metabolism, and adipocytokine signalling pathway (Figure 4(A)). The significant top up-regulated gene pathways in AMK-20 rats were cell cycle, glutathione metabolism, steroid biosynthesis, bile secretion, gastric acid secretion, DNA replication, GnRH signalling pathway, p53 signalling pathway, microRNAs in cancer, citrate cycle, bladder cancer, VEGF signalling pathway, PPAR signalling pathway, and gap junction (Figure 4(B)). The significant top down-regulated gene pathways in AMK-20 rats were oxytocin signalling pathway, dilated cardiomyopathy, MAPK signalling pathway, hypertrophic cardiomyopathy, PI3K-Akt signalling pathway, regulation of actin cytoskeleton, cGMP-PKG signalling pathway, vascular smooth muscle contraction, hippo signalling pathway, and cytokine-cytokine receptor interaction (Figure 4(B)).
Figure 4.
Gene pathway enrichment induced by AMK in rats according to the KEGG database. (A) Up-regulated and down-regulated gene pathways by comparing AMK-10 rats and CTL rats. (B) Up-regulated and down-regulated genes pathways by comparing AMK-20 rats and CTL rats. -Lg P, negative logarithm of the p value. X-axis denotes that a larger number corresponds to a smaller p-value. n = 3 per group.
The gene signal transduction networks analysis revealed the pivotal genes in AMK triggered gastric tumour
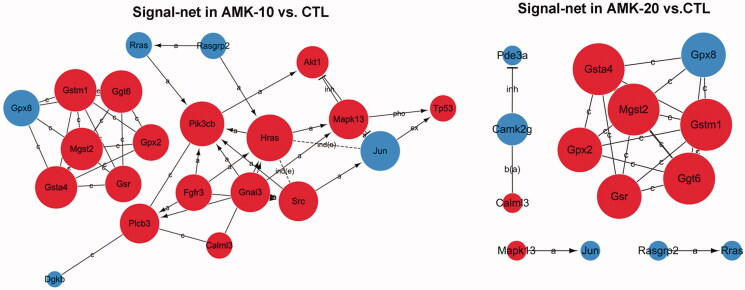
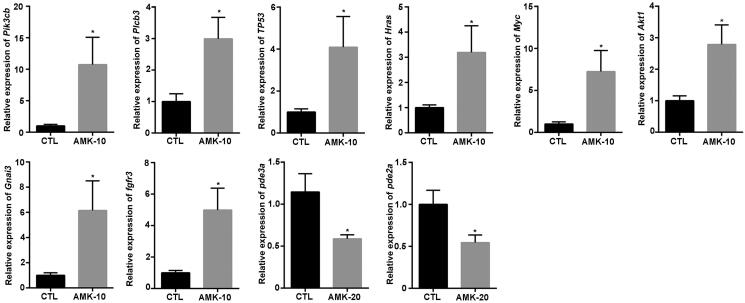
The gene signal-net analysis is a method to select the core key genes which have a powerful ability to modulate other genes. The gene signal-net analysis revealed the core genes involved in AMK induced gastric tumour genes in rats. There were 25 or 19 key genes obtained through the signal-net analysis in AMK-10 rats or AMK-20 rats, respectively (Figure 5). We analysed the morphology of gastric tumour in AMK-10 and AMK-20 rats. AMK-10 rats showed the characteristics of benign tumours; AMK-20 rats showed the characteristics of malignant carcinoma. These genes in the signal-net were compared between AMK-10 cohort and AMK-20 cohort. AMK-10 and AMK-20 rats shared 16 key genes including Mapk13 (mitogen-activated protein kinase 13), Nme1 (non-metastatic cells 1), Gsta4 (glutathione s-transferase, α4), Gstm1 (glutathione s-transferase, μ1), Jun, Mgst2 (microsomal glutathione s-transferase 2), Ggt6 (γ-glutamyl transferase 6), Gpx2 (glutathione peroxidase 2), Gpx8 (glutathione peroxidase 8), Calml3 (calmodulin-like 3), Rasgrp2 (RAS guanyl releasing protein 2), Cd44, Gsr (glutathione reductase), Dgkb (diacylglycerol kinase ß), Rras (harvey rat sarcoma oncogene), and Amt (amino-methyltransferase) which were key genes for AAs induced gastric tumour formation (Tables 2 and 3). Genes including Pik3cb (phosphatidylinositol 3-kinase, catalytic β), Plcb3 (phospholipase C β3), Tp53 (tumour protein p53), Hras (Harvey rat sarcoma viral oncogene), Myc (myelocytomatosis viral oncogene), Src (rous sarcoma oncogene), Akt1 (thymoma viral proto-oncogene 1), Gnai3 (guanine nucleotide binding protein, α inhibiting 3), and Fgfr3 (fibroblast growth factor receptor 3) were detected as key factors in the AMK-10 rat by gene signal-net analysis (Table 2). On the other hand, genes including PDE2a (phosphodiesterase 2a) and PDE3a (phosphodiesterase 3a) were calculated as key genes in the AMK-20 rat by gene signal-net analysis (Table 3). We verified these gene expressions through qPCR. These gene expressions of Pik3cb, Plcb3, Tp53, Hras, Myc, Src, Akt1, Gnai3, and Fgfr3 increased significantly in the AMK-10 group compared to CTL group, while these gene expressions of PDE3a and PDE2a decreased in the AMK-20 group in contrast to CTL group (Figure 6). The qPCR results are consistent with the microarray results.
Figure 5.
AMK induced signal-net in AMK-10 rats and AMK-20 rats, respectively. The red circles represents the up-regulated genes and the blue circles down-regulated genes. The area of the circle represents the degree. Interaction between the genes is shown as: a: activation; b (a): binding/association; c: compound; ind (e): indirect effect; inh: inhibition; ex: expression; pho: phosphorylation. n = 3 per group.
Table 2.
The top genes ranked by degree in the signal-net of AMK-10 rats.
| Gene symbol | Style | Degree | Outdegree | Indegree | Betweenness centrality | Kcores |
|---|---|---|---|---|---|---|
| Mapk13 | Up | 26 | 13 | 13 | 0.0276274 | 4 |
| Pik3cb | Up | 26 | 7 | 19 | 0.0532188 | 4 |
| Plcb3 | Up | 26 | 10 | 16 | 0.0268069 | 4 |
| Tp53 | Up | 21 | 16 | 5 | 0.0189809 | 3 |
| Hras | Up | 19 | 6 | 13 | 0.0146783 | 4 |
| Nme1 | Up | 17 | 12 | 5 | 0.0145918 | 4 |
| Myc | Up | 16 | 7 | 9 | 0.0076037 | 3 |
| Src | Up | 16 | 6 | 10 | 0.011391 | 4 |
| Akt1 | Up | 15 | 11 | 4 | 0.0429019 | 4 |
| Gnai3 | Up | 15 | 14 | 1 | 0.000774 | 4 |
| Gsta4 | Up | 14 | 7 | 7 | 3.057E-05 | 8 |
| Fgfr3 | Up | 14 | 6 | 8 | 0.0122315 | 4 |
| Gstm1 | Up | 14 | 9 | 5 | 3.057E-05 | 8 |
| Jun | Down | 14 | 6 | 8 | 0.0240749 | 4 |
| Mgst2 | Up | 14 | 8 | 6 | 3.057E-05 | 8 |
| Ggt6 | Up | 13 | 12 | 1 | 7.879E-05 | 8 |
| Gpx2 | Up | 11 | 0 | 11 | 0 | 8 |
| Gpx8 | Down | 11 | 0 | 11 | 0 | 8 |
| Calml3 | Up | 10 | 5 | 5 | 0.0077307 | 4 |
| Rasgrp2 | Down | 9 | 7 | 2 | 0.011823322 | 4 |
| Cd44 | Up | 8 | 3 | 5 | 0.0032644 | 3 |
| Gsr | Up | 8 | 7 | 1 | 0 | 8 |
| Dgkb | Down | 8 | 3 | 5 | 0.021876768 | 4 |
| Rras | Down | 7 | 4 | 3 | 0.000245185 | 3 |
| Amt | Down | 7 | 3 | 4 | 1.08145E-05 | 5 |
Table 3.
The top genes ranked by degree in the signal-net of AMK-20 rats.
| Gene symbol | Style | Degree | Outdegree | Indegree | Betweenness centrality | Kcores |
|---|---|---|---|---|---|---|
| Camk2g | Down | 12 | 10 | 2 | 0.0023717 | 3 |
| Mapk13 | Up | 11 | 6 | 5 | 0.0044374 | 2 |
| Gsta4 | Up | 9 | 5 | 4 | 9.956E-05 | 5 |
| Nme1 | Up | 9 | 3 | 6 | 0.0020907 | 3 |
| Gstm1 | Up | 9 | 7 | 2 | 9.956E-05 | 5 |
| Ggt6 | Up | 9 | 8 | 1 | 0.0005973 | 5 |
| Mgst2 | Up | 9 | 6 | 3 | 9.956E-05 | 5 |
| Rasgrp2 | Down | 9 | 4 | 5 | 0.001991125 | 3 |
| Cd44 | Up | 8 | 1 | 7 | 0.0007111 | 2 |
| Calml3 | Up | 8 | 3 | 5 | 0.0012976 | 3 |
| PDE3a | Down | 6 | 1 | 5 | 5.689E-05 | 3 |
| Gpx2 | Up | 5 | 0 | 5 | 0 | 5 |
| Gsr | Up | 5 | 4 | 1 | 0 | 5 |
| PDE2a | Down | 5 | 1 | 4 | 5.689E-05 | 3 |
| Gpx8 | Down | 5 | 0 | 5 | 0 | 5 |
| Jun | Down | 4 | 2 | 2 | 0.0020371 | 2 |
| Rras | Down | 3 | 1 | 2 | 0.000341336 | 2 |
| Amt | Down | 3 | 0 | 3 | 0 | 2 |
| Dgkb | Down | 2 | 1 | 1 | 0 | 2 |
Figure 6.
qRT-PCR analysis revealed that the gene expression of Pik3cb, Plcb3, Tp53, Hras, Myc, Src, Akt1, Gnai3, and Fgfr3 were remarkable up-regulated in AMK-10 rats compared to the CTL rats, while the gene expression of PDE3a and PDE2a were significantly down-regulated in AMK-20 rats compared to the CTL rats. n = 5–6 per group.
Discussion
AMK is known for toxicity and mutagenicity. We found AMK induced gastric tumorigenesis after 10 weeks of AMK treatment, and became gastric carcinoma after 20 weeks of AMK administration. We summarised the comprehensive genome-wide transcriptional analysis for AMK induced gastric tumour through the cluster analysis of gene expressions, GO analysis, pathway analysis, and the signal-net analysis in our current work. Genes including Mapk13, Nme1, Gsta4, Gstm1, Jun, Mgst2, Ggt6, Gpx2, Gpx8, Calml3, Rasgrp2, Cd44, Gsr, Dgkb, Rras, Amt, Pik3cb, Plcb3, Tp53, Hras, Myc, Src, Akt1, Gnai3, Fgfr3, PDE2a, and PDE3a were found to be critical in the AAs induced gastric tumour process.
AMK is known for nephrotoxic and carcinogenic due to the components of AAs. Herbal medicines containing AAs, such as Ma Dou Ling (Aristolochiae fructus), Tian Xian Teng (Aristolochiae herba), Qing Mu Xiang (Radix aristolochiae), and Xi Xin (Asari radix et rhizoma) are also used in clinical in the mainland of China. Therefore, the amount in the formula must be strictly limited. In addition, the detoxifying formulas should be explored. We previously found that omeprazole alleviated AMK induced acute nephrotoxicity (Wang et al. 2016). l-Arginine reduced aristolochic acid nephropathy through restoring nitric oxide bioavailability (Jadot et al. 2017). Female hormone 17β-estradiol protected male mice against acute AAN by reducing renal tubular epithelial cell apoptosis (Shi et al. 2016). These chemicals provide detoxifying protocols for AAs.
According to the KEGG database, differentially expressed genes on the significance pathways which were induced by AMK were discovered by pathway analysis. Pathways including cell cycle, DNA replication, p53 signalling pathway, GnRH signalling pathway, and VEGF signalling pathway were up-regulated both in AMK-10 and AMK-20 rats. MAPK signalling pathway and PI3K-Akt signalling pathway were down-regulated both in AMK-10 and AMK-20 rats. As we known, normal cells acquire cancer traits to evolve progressively to a neoplastic state. The hallmarks of cancer include genomic instability and mutation, self-sufficiency in growth signals, insensitivity to growth-inhibitory (antigrowth) signals, evasion of programmed cell death (apoptosis), limitless replicative potential, sustained angiogenesis, tissue invasion and metastasis, tumour-promoting inflammation, deregulating cellular energetic, and avoiding immune destruction (Hanahan and Weinberg 2000, 2011). Alterations of cell cycle and DNA replication are related to the cancer hallmarks of genomic instability and mutation. Changes of p53, GnRH, MAPK, and PI3K-Akt signalling pathway are related to the cancer hallmarks of self-sufficiency in growth signals and insensitivity to growth-inhibitory (antigrowth) signals.
World Health Organization (WHO) classified gastric tumour as papillary, tubular, mucinous (colloid), and poorly cohesive carcinomas (Nagtegaal et al. 2020). The formation of gastric tumour processes precancerous lesions into invasive adenocarcinoma. The precancerous lesions include superficial gastritis (SG), chronic non-atrophic gastritis (NAG), chronic atrophic gastritis (AG), intestinal metaplasia (IM), and dysplasia (Correa and Piazuelo 2012). The final step of gastric tumour is invasive adenocarcinoma.
In our work, the histological features of AMK-10 rats showed divers degree of dysplasia, and of AMK-20 rats revealed invasive gastric carcinoma. We compared genes in the signal-net between AMK-10 rats and AMK-20 rats, and found that genes including Mapk13, Nme1, Gsta4, Gstm1, Jun, Mgst2, Ggt6, Gpx2, Gpx8, Calml3, Rasgrp2, Cd44, Gsr, Dgkb, Rras, and Amt altered in these two groups. Pik3cb, Plcb3, Tp53, Hras, Myc, Src, Akt1, Gnai3, and Fgfr3 were detected as key factors in the AMK-10 rat. PDE3a and PDE2a were calculated as key genes in the AMK-20 rat. Therefore, we speculate that genes including Mapk13, Nme1, Gsta4, Gstm1, Jun, Mgst2, Ggt6, Gpx2, Gpx8, Calml3, Rasgrp2, Cd44, Gsr, Dgkb, Rras, Amt, Pik3cb, Plcb3, Tp53, Hras, Myc, Src, Akt1, Gnai3, Fgfr3, PDE2a, and PDE3a were critical in the AAs induced gastric tumour process. 23 GC tumour patient samples were analysed, the expression of Pik3cb and Akt1 were augmented in contrast to the non-tumour samples (Riquelme et al. 2016). Alterations of TP53 gene including LOH, high frequency of TP53 mutations, up-regulation of the TP53 was found in gastric carcinogenesis (Bellini et al. 2012). Fibroblast growth factors (FGFs) and their receptors (FGFRs) signalling involved in the process of neoplastic behaviour, cell growth, development, differentiation, and survival. FGFR3 was amplified in uterine carcinoma, ovarian cystadenocarcinoma, and sarcoma (Guancial et al. 2014; Helsten et al. 2015). Mutations in FGFR3, PIK3CA, and TP53 genes were observed in invasive gastric carcinoma patients (Fassan et al. 2014). However, we did not detect significant alterations of FGFR3, PIK3CA, and TP53 in AMK-20 rats. Our signal-net analysis results based on the mRNA expression results in AAs mediated gastric rat tumour model. Bioinformatics analysis based on diversity of species, gene alteration analysis platform, and gastric tumour inducers produced different results. Hras was up-regulated in rats with gastric precancerous lesions (Shen et al. 2008). Myc as a possible biomarker for GC, the mRNA expression, protein expression, as well as gene copy numbers were evaluated in human GC samples (De Souza et al. 2013; Mello et al. 2015). SRC, a cell cycle regulator and transcriptional factor, was up-regulated in human GC samples (Mello et al. 2015). Gnai3 was significantly associated with gastric cardia cancer risk (Li et al. 2013). PDEs represent a large family of ubiquitously expressed hydrolases that control the intracellular levels of cyclic nucleotides by hydrolysing adenosine 3′, 5′-cyclic monophosphate (cAMP) and guanosine 3′, 5′-cyclic monophosphate (cGMP) to their respective 5′-nucleoside monophosphates respectively (Azevedo et al. 2014). PDE2a and PDE3a are members of PDEs family. PDE3a played important roles in oocyte maturation and vascular smooth muscle cell proliferation (Rhee et al. 2017). PDE3a was downregulated significantly in chemo-resistant non-small cell lung cancer (NSCLC) cells. High expression of PDE3a was associated with better overall survival and progression-free-survival in patients with adenocarcinoma, but not in patients with squamous cell carcinoma (Tian et al. 2017). PDE2 controlled growth and invasion in human malignant melanoma PMP cell line. However, the function of PDE2a and PDE3a in the progress of gastric carcinoma are unknown, and more works should be done in the future.
Conclusions
Our findings showed that AMK induced benign or malignant gastric tumour depends on the period of AMK administration. Mapk13, Nme1, Gsta4, Gstm1, Jun, Mgst2, Ggt6, Gpx2, Gpx8, Calml3, Rasgrp2, Cd44, Gsr, Dgkb, Rras, Amt, Pik3cb, Plcb3, Tp53, Hras, Myc, Src, Akt1, Gnai3, Fgfr3, PDE2a, and PDE3a were found to be critical in the AAs induced gastric tumour process.
Funding Statement
This work was supported by the National Science and Technology Major Project (2015ZX09501004, 2018ZX09101002-003), Beijing Science and Technology Projects (Z151100000115012 and Z161100004916025), China Academy of Chinese Medical Sciences Foundation (ZZ10-025 and ZZ12-001) and National Natural Science Foundation of China (81703808).
Disclosure statement
No potential conflict of interest was reported by the authors.
References
- Azevedo MF, Faucz FR, Bimpaki E, Horvath A, Levy I, de Alexandre RB, Ahmad F, Manganiello V, Stratakis CA.. 2014. Clinical and molecular genetics of the phosphodiesterases (PDEs). Endocr Rev. 35(2):195–233. [DOI] [PMC free article] [PubMed] [Google Scholar]
- Bellini MF, Cadamuro AC, Succi M, Proenca MA, Silva AE.. 2012. Alterations of the TP53 gene in gastric and esophageal carcinogenesis. J Biomed Biotechnol. 2012:891961. [DOI] [PMC free article] [PubMed] [Google Scholar]
- Bilici M, Cayir K, Tekin SB, Gundogdu C, Albayrak A, Suleyman B, Ozogul B, Erdemci B, Suleyman H.. 2012. Effect of mirtazapine on MNNG-induced gastric adenocarcinoma in rats. Asian Pac J Cancer Prev. 13(10):4897–4900. [DOI] [PubMed] [Google Scholar]
- Correa P, Piazuelo MB.. 2012. The gastric precancerous cascade. J Dig Dis. 13(1):2–9. [DOI] [PMC free article] [PubMed] [Google Scholar]
- de Souza CRT, Leal MF, Calcagno DQ, Costa Sozinho EK, Borges BDN, Montenegro RC, dos Santos ÂKCR, dos Santos SEB, Ribeiro HF, Assumpção PP, et al. 2013. MYC deregulation in gastric cancer and its clinicopathological implications. PLoS One. 8(5):e64420. [DOI] [PMC free article] [PubMed] [Google Scholar]
- Fassan M, Simbolo M, Bria E, Mafficini A, Pilotto S, Capelli P, Bencivenga M, Pecori S, Luchini C, Neves D, et al. 2014. High-throughput mutation profiling identifies novel molecular dysregulation in high-grade intraepithelial neoplasia and early gastric cancers. Gastric Cancer. 17(3):442–449. [DOI] [PubMed] [Google Scholar]
- Gigek CO, Calcagno DQ, Rasmussen LT, Santos LC, Leal MF, Wisnieski F, Burbano RR, Lourenco LG, Lopes-Filho GJ, Smith M.. 2017. Genetic variants in gastric cancer: risks and clinical implications. Exp Mol Pathol. 103(1):101–111. [DOI] [PubMed] [Google Scholar]
- Guancial EA, Werner L, Bellmunt J, Bamias A, Choueiri TK, Ross R, Schutz FA, Park RS, O’Brien RJ, Hirsch MS, et al. 2014. FGFR3 expression in primary and metastatic urothelial carcinoma of the bladder. Cancer Med. 3(4):835–844. [DOI] [PMC free article] [PubMed] [Google Scholar]
- Hanahan D, Weinberg RA.. 2000. The hallmarks of cancer. Cell. 100(1):57–70. [DOI] [PubMed] [Google Scholar]
- Hanahan D, Weinberg RA.. 2011. Hallmarks of cancer: the next generation. Cell. 144(5):646–674. [DOI] [PubMed] [Google Scholar]
- Helsten T, Schwaederle M, Kurzrock R.. 2015. Fibroblast growth factor receptor signaling in hereditary and neoplastic disease: biologic and clinical implications. Cancer Metastasis Rev. 34(3):479–496. [DOI] [PMC free article] [PubMed] [Google Scholar]
- Hwang YH, Kim T, Cho WK, Yang HJ, Kwak DH, Ha H, Song KH, Ma JY.. 2012. In vitro and in vivo genotoxicity assessment of Aristolochia manshuriensis Kom. Evid Based Complement Alternat Med. 2012:412736. [DOI] [PMC free article] [PubMed] [Google Scholar]
- Jadot I, Colombaro V, Martin B, Habsch I, Botton O, Nortier J, Decleves AE, Caron N.. 2017. Restored nitric oxide bioavailability reduces the severity of acute-to-chronic transition in a mouse model of aristolochic acid nephropathy. PLoS One. 12(8):e0183604. [DOI] [PMC free article] [PubMed] [Google Scholar]
- Li WQ, Hu N, Wang Z, Yu K, Su H, Wang L, Wang C, Chanock SJ, Burdett L, Ding T, et al. 2013. Genetic variants in epidermal growth factor receptor pathway genes and risk of esophageal squamous cell carcinoma and gastric cancer in a Chinese population. PLoS One. 8(7):e68999. [DOI] [PMC free article] [PubMed] [Google Scholar]
- Ma A, Wang L, Gao Y, Chang Z, Peng H, Zeng N, Gui YS, Tian X, Li X, Cai B, et al. 2014. Tsc1 deficiency-mediated mTOR hyperactivation in vascular endothelial cells causes angiogenesis defects and embryonic lethality. Hum Mol Genet. 23(3):693–705. [DOI] [PubMed] [Google Scholar]
- Mello AA, Leal MF, Rey JA, Pinto GR, Lamarão LM, Montenegro RC, Alves AP, Assumpção PP, Borges BDN, Smith MC, et al. 2015. Deregulated expression of SRC, LYN and CKB kinases by DNA methylation and its potential role in gastric cancer invasiveness and metastasis. PLoS One. 10(10):e0140492. [DOI] [PMC free article] [PubMed] [Google Scholar]
- Menheniott TR, O’Connor L, Chionh YT, Däbritz J, Scurr M, Rollo BN, Ng GZ, Jacobs S, Catubig A, Kurklu B, et al. 2016. Loss of gastrokine-2 drives premalignant gastric inflammation and tumor progression. J Clin Invest. 126(4):1383–1400. [DOI] [PMC free article] [PubMed] [Google Scholar]
- Nagtegaal ID, Odze RD, Klimstra D, Paradis V, Rugge M, Schirmacher P, Washington KM, Carneiro F, Cree IA; WHO Classification of Tumours Editorial Board. 2020. The 2019 WHO classification of tumours of the digestive system. Histopathology. 76(2):182–188. [DOI] [PMC free article] [PubMed] [Google Scholar]
- Pfeifer GP. 2015. How the environment shapes cancer genomes. Curr Opin Oncol. 27(1):71–77. [DOI] [PMC free article] [PubMed] [Google Scholar]
- Rhee DK, Hockman SC, Choi SK, Kim YE, Park C, Manganiello VC, Kim KK.. 2017. SFPQ, a multifunctional nuclear protein, regulates the transcription of PDE3A. Biosci Rep. 37:1–10. [DOI] [PMC free article] [PubMed] [Google Scholar]
- Riquelme I, Tapia O, Espinoza JA, Leal P, Buchegger K, Sandoval A, Bizama C, Araya JC, Peek RM, Roa JC.. 2016. The gene expression status of the PI3K/AKT/mTOR pathway in gastric cancer tissues and cell Lines. Pathol Oncol Res. 22(4):797–805. [DOI] [PMC free article] [PubMed] [Google Scholar]
- Shen SW, Yuwen Y, Zhang ZL, Dong S, Liu JT, Wang XM.. 2008. Effect of Jinguo Weikang capsule on proto-oncogene expression of gastric mucosa in rats with gastric precancerous lesions. Chin J Integr Med. 14(3):212–216. [DOI] [PubMed] [Google Scholar]
- Shi M, Ma L, Zhou L, Fu P.. 2016. Renal protective effects of 17 β-estradiol on mice with acute aristolochic acid nephropathy. Molecules. 21(10):1391–1312. [DOI] [PMC free article] [PubMed] [Google Scholar]
- Tian FM, Zhong CY, Wang XN, Meng Y.. 2017. PDE3A is hypermethylated in cisplatin resistant non-small cell lung cancer cells and is a modulator of chemotherapy response. Eur Rev Med Pharmacol Sci. 21(11):2635–2641. [PubMed] [Google Scholar]
- Toyoda T, Tsukamoto T, Yamamoto M, Ban H, Saito N, Takasu S, Shi L, Saito A, Ito S, Yamamura Y, et al. 2013. Gene expression analysis of a Helicobacter pylori-infected and high-salt diet-treated mouse gastric tumor model: identification of CD177 as a novel prognostic factor in patients with gastric cancer. BMC Gastroenterol. 13(1):122–133. [DOI] [PMC free article] [PubMed] [Google Scholar]
- Wang L, Ding X, Li C, Zhao Y, Yu C, Yi Y, Zhang Y, Gao Y, Pan C, Liu S, et al. 2018. Oral administration of Aristolochia manshuriensis Kom in rats induces tumors in multiple organs. J Ethnopharmacol. 225:81–89. [DOI] [PubMed] [Google Scholar]
- Wang L, Zhang H, Li C, Yi Y, Liu J, Zhao Y, Tian J, Zhang Y, Wei X, Gao Y, et al. 2016. Omeprazole alleviates Aristolochia manshuriensis Kom-induced acute nephrotoxicity. PLoS One. 11(10):e0164215. [DOI] [PMC free article] [PubMed] [Google Scholar]


