Abstract
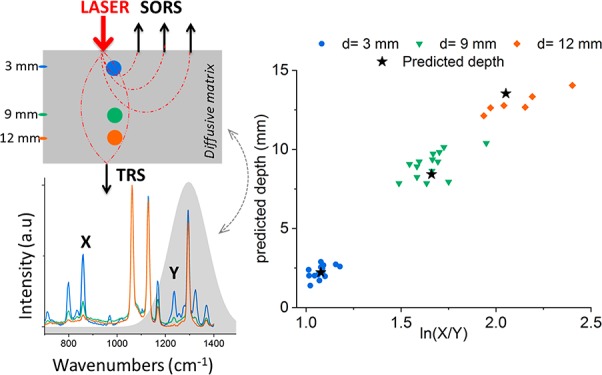
We propose an approach for the prediction of the depth of a single buried object within a turbid medium combining spatially offset Raman spectroscopy (SORS) and transmission Raman spectroscopy (TRS) and relying on differential attenuation of individual Raman bands brought about by the spectral variation of matrix absorption (and scattering). The relative degree of the Raman band changes is directly related to the path length of Raman photons traveling through the medium, thereby encoding the information on the depth of the object within the matrix. Through a calibration procedure with root mean square error of calibration (RMSEC) = 3.4%, it was possible to predict the depth of a paracetamol (acetaminophen) inclusion within a turbid matrix consisting of polyethylene (PE) by monitoring the relative intensity of two Raman bands of paracetamol exhibiting differential absorption by the matrix. The approach was shown to be largely insensitive to variations of the amount of the inclusion (paracetamol) and to the overall thickness of the turbid matrix (PE) with a root mean square error of prediction (RMSEP) maintained below 10% for the tested cases. This represents a major advantage over previously demonstrated comparable depth determination Raman approaches (with the exception of full Raman tomography requiring complex mathematical reconstruction algorithms). The obtained experimental data validate the proposed approach as an effective tool for the noninvasive determination of the depth of buried objects in turbid media with potential applications including determining noninvasively the depth of a lesion in cancer diagnosis in vivo.
Raman spectroscopy is a powerful tool for subsurface analysis of turbid media applied to a wide range of analytical fields such as pharmaceutical analysis in quality control, security screening, and disease diagnosis.1,2 To provide noninvasive analysis, the two cornerstone techniques are spatially offset Raman spectroscopy (SORS)3 and transmission Raman spectroscopy (TRS).4,5 Both methods take advantage of characteristic light propagation in diffusely scattering (turbid) media for retrieving information about the chemical makeup of deep layers and other concealed objects.6 In the SORS configuration, the depth accessibility and sensitivity are obtained by introducing a spatial separation between the excitation and Raman collection zones (i.e., the spatial offset). Raman spectra acquired at larger offsets contain increased contributions from increasing sample depths.7 In contrast, TRS, which involves a 180° collection-illumination geometry, yields information on the chemical composition of the entire probed volume,8 and in its basic implementation, it does not provide any depth information. In many application areas, it is beneficial, apart from retrieving chemical information on a buried layer or object, to also identify its depth within the matrix. Such noninvasive localization of a specific target is potentially significant in a number of areas. For example, in a clinical environment, the localization of a cancer lesion within the body in vivo could potentially facilitate more accurate diagnosis or improve the effectiveness of subsequent treatments. Within this context, both SORS and TRS can be extended to provide such noninvasive evaluation of depth of a buried object in tissues. Previous concepts predominantly rely on calibrations that are specific to the studied system using individual SORS9,10 or TRS11,12 measurements. In these cases, the model is inherently dependent on the amount of the buried material (with the exception of a study12 where an external optical element is used with TRS geometry and which is not directly applicable to SORS). This restricts the applicability of the technique. Here we aim at developing a method that is largely insensitive to the amount of the buried material in the matrix permitting applications such as localization of a cancer lesion within the body without knowing its exact extent, whether through native signals or labeled SERS nanoparticles. As such, our model should ideally be largely insensitive to the changes in the amount of the buried material and if possible also to the overall thickness of the matrix. To date, a specific deep Raman concept has been proposed and demonstrated that exhibits gross insensitivity to the amount of the object localized: 3D Raman optical tomography13,14 building on earlier advances in a parallel field of time-domain near-infrared diffuse optical tomography (DOT).15,16 This method was demonstrated to be effective in noninvasively reconstructing images of heterogeneities within a turbid medium and providing the spatial information with rich chemical information on a target object. Although widely applicable, these methods require 3D-tomographic image reconstruction algorithms which are complex and nondeterministic.17,18 Instead, here we focus on a conceptually much simpler problem of determining the depth of a single, chemically distinct object (e.g., spherical inclusion) buried within a turbid matrix which can be tackled with a much simpler approach requiring little computational efforts and yielding a more deterministic outcome and as such of potentially higher practical utility in relevant situations. The approach consists of using a combination of SORS and TRS measurements and subsequent global utilization of the combined data sets to retrieve depth information. The depth of the inclusion is extrapolated through monitoring the differential Raman intensity of two or more discrete Raman bands that undergo different matrix absorption (and scattering) and as such encode the depth of the buried object. It is well established that the optical properties of a specific medium vary with the wavelength of light.6 For that reason, Raman photons of different wavelengths are influenced by the medium’s optical parameters (absorption coefficient, μa; reduced scattering coefficient, μs′) to potentially different degrees.19 This results in a different attenuation for Raman photons at different wavelengths when traveling through the medium.20 In particular, Raman bands which undergo higher absorption result in having a lower intensity (when collected at the surface) with respect to the Raman bands undergoing lower absorption. Due to this effect, the mean depth attained statistically by Raman photons in a turbid matrix can be monitored through differences in the relative intensities of the Raman peaks of the inclusion material.11 The prediction of the depth is based on the evaluation of relative intensity (i.e., intensity ratio) and results as the weighted average of both SORS and TRS predictions. As such, the proposed approach is inherently largely insensitive to sample parameters such as the amount of the buried object and as such more widely applicable. A simpler implementation of this method was recently demonstrated for TRS alone.11 Here we extend the method to include a combination of SORS and TRS yielding more accurate depth determination and having a wider applicability than possible with TRS approaches alone.11,12 The extension to SORS alone is also demonstrated here for the first time. The concept is applicable to certain depths even in situations where the overall sample matrix is too thick for TRS to yield detectable Raman spectra from the buried object, leaving SORS data alone to yield the depth information. In our study, we compare the performance of the combined SORS and TRS concept with that of TRS alone and SORS alone, demonstrating the higher utility and accuracy of the combined approach over the individual ones. We have also tested the gross insensitivity of the model to the amount of material in the buried object and to the overall thickness of the turbid medium.
Experimental Section
Deep Raman Setup
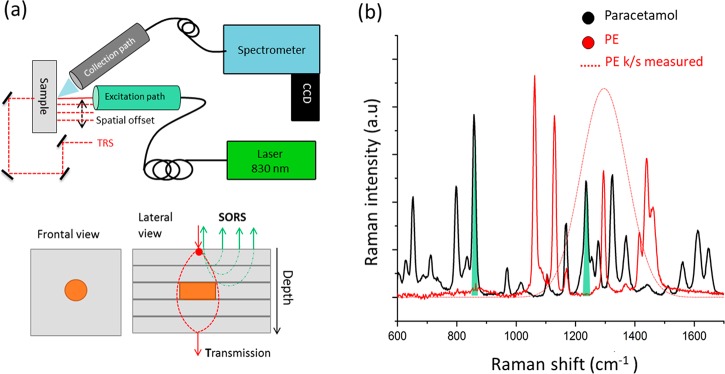
Raman measurements were carried out using a custom-built Raman system designed to perform measurements in both transmission mode (TRS) and conventional point-like spatial offset Raman spectroscopy (SORS). The excitation wavelength consists of an NIR diode laser emitting at 830 nm (IPS, Monmouth Junction, NJ). The laser light is delivered to the sample surface through an optical fiber (200 μm core MHP200L02, Thorlabs) and a 1 in. diameter optical imaging system in order to achieve a spot size of ∼500 μm at the sample surface. The spatial offset is achieved by moving the entire excitation path assembly along the plane parallel to the sample surface (see Figure 1a) with a motorized stage (MTS25-Z8 whit KDC101, Thorlabs). A prism (PS910, Thorlabs) and three dielectric mirrors (BB1-E03, Thorlabs) redirect automatically the excitation light to the backside of the sample for transmission measurement at the extreme spatial offset settings using the motorized stage. Raman scattered light is collected at an angle of ∼30° to the normal incidence from a zone of approximately 1.5 mm diameter on the sample surface and relayed via an optical fiber bundle system to a Kaiser spectrometer (HoloSpec f/1.8i) coupled to a deep-depletion CCD camera (Andor iDus-420A-BR-DD). The fiber bundle (custom-made, 22 active fibers with a core diameter of 220 μm each,21 CeramOptec Industries, Inc.) has a round to linear transformation configuration to match the spectrograph slit. Raman spectra were acquired in the spectral range 112–1938 cm–1 with a spectral resolution of ∼8 cm–1 for 20 s × 5 accumulations and a laser output power of 200 mW.
Figure 1.
(a) (upper panel) Experimental setup of the Raman system used for SORS and TRS measurements. (lower panel) Schematic diagram of the model sample and measurement configuration. (b) Raman spectra of the inclusion (paracetamol - black line) and the diffuse matrix (PE - red line). Green shaded areas highlight the paracetamol Raman bands used in further analysis (857 and 1235 cm–1). The red dotted line denotes the k/s Kubelka–Munk function of the turbid matrix (PE). Each figure must have a caption that includes the figure number and a brief description.
Phantom Sample and Characterization
Three different homogeneous model samples, made of polytetrafluoroethylene (PTFE), polyethylene (PE), and polystyrene (PS), exhibiting different optical properties (μa, μS′) in the NIR spectral region (see Figure 2a–c), were used as turbid media. A heterogeneous phantom structured as a layered turbid matrix made of PE (50 mm × 50 mm × 3 mm each layer) and paracetamol (cylindrical shape radius = 2, 3, and 5 mm, thickness = 3 mm) was used for mimicking the presence of an inclusion (paracetamol) at depth in the turbid matrix (PE) (see Figure 1a, bottom). The bilayer phantom was an assembly in order to permit the variation of the overall thickness (t = 12, 18, 21, and 24 mm) and the amount of the inclusion (m = 125, 250, and 500 mg of paracetamol). The optical properties of the phantom matrix were characterized using a benchtop spectrophotometer equipped with an integrating sphere (ISR-2600Plus, Shimadzu). Diffuse reflectance measurements were performed from 700 to 1100 nm with a spectral resolution of 0.2 nm. From the spectral reflectance of the sample (R(λ)), the Kubelka–Munk model22 was applied for evaluating the scattering and absorption properties of the turbid matrix (i.e., k/s Kubelka–Munk function23).
Figure 2.
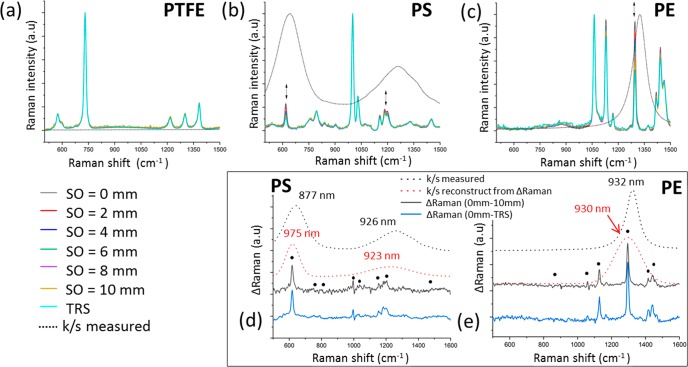
Raman spectra of a homogeneous phantom with no inclusions (thickness t = 15 mm) of PTFE (a), PS (b), and PE (c) measured at different spatial offsets (SO: 0 to 10 mm) and in transmission (TRS) geometry. The Raman spectra are normalized to the maximum peak intensity (height) of the most intense band in the spectrum. The black dotted line shows the Kubelka–Munch (k/s) parameter (absorption) calculated from the measurement of diffuse reflectance. (d, e) Differential Raman spectra for the TRS and 0 mm offset measurements (i.e., ΔRaman(0 mm – TRS), blue line) and 10 and 0 mm offset (i.e., ΔRaman(0 mm – 10 mm), black line). Black-filled circles (●) indicate the position of the Raman peak used to reconstruct the attenuation profile (k/s) from differential Raman spectra (red dotted line). The black dotted line shows the absorbance (k/s) measured with the spectrophotometer.
Protocol and Data Analysis
The measurement protocol consisted of the sequential acquisition of Raman spectra from the bilayer phantom at different spatial offsets (i.e., from 0 to 12 mm with a step of 1 mm) and in transmission Raman configuration. The first step of the protocol consisted of the alignment of the inclusion on the optical axis (z-axis) of the Raman system. This was carried out by maximizing the TRS signal (or a SORS signal) of the inclusion by moving the sample sideways, along the (x, y) axes. This preliminary step ensured the location of the inclusion on the optical axis of the Raman system. The experiments were then initiated by locating the inclusion (paracetamol) at the sample surface (z = 0) and subsequently moving it along the z-axis in steps of 3 mm. A calibration model for depth prediction was created using the following steps: (i) For each depth (z) and each spatial offset (SO = 0–12 mm and TRS), a Gaussian-shape curve fit was performed on the two Raman bands of paracetamol (857 and 1235 cm–1), in order to evaluate the effect of differential absorption on their intensity (see Figure 1b). (ii) The natural logarithm of the intensity ratio of the two bands (857-to-1235 cm–1) against the depth (z) was fit with a linear trend11 (R2 > 0.945, Supporting Information S-4) for each spatial offset and transmission measurement. (iii) The predicted depth was extrapolated from a weighted average of all of the depth models resulting from the modeling of each spatial offset and transmission measurement.
Results and Discussion
First, we studied the SORS and TRS properties of several matrixes without any inclusions in them. When Raman photons travel through a turbid medium, which exhibit wavelength-dependent changes in absorption and scattering, relative differences in intensity between different Raman bands can be observed (Figure 2a–c). As shown in Figure 2, for a zero spatial offset (SO = 0 mm), there is a minimal travel distance for the detected Raman photons and as such a minimal intensity distortion (decrease) to Raman bands due to absorption present. By increasing the spatial offset, the migration distance of the detected Raman photons from the matrix increases and consequently larger intensity distortions are observed where differential matrix absorption is present. Figure 2b highlights a decrease in the relative intensity of polystyrene Raman peaks at 628 and 1200 cm–1 relative to the Raman components at 1001 and 1032 cm–1. Similarly, the polyethylene Raman band at 1292 cm–1 significantly decreases in intensity compared to the 1063 cm–1 band (Figure 2c). Conversely, no relative intensity changes were observed for the Teflon phantom (PTFE, Figure 2a) due to the fact that the PTFE sample does not exhibit any significant differential absorption in the investigated spectral range.
The changes in the relative Raman intensity due to the differential absorption are visualized in Figure 2d,e showing the difference Raman spectra (i.e., ΔRaman) between a large offset (TRS or 10 mm) and the zero-offset spectra (0 mm offset). From these, an approximate profile of the absorption of the turbid material can be reconstructed (Figure 2d,e, red dotted line). Specifically, it is obtained by fitting to a Gaussian model the difference Raman spectra (y-coordinate) at the Raman peaks location (x-coordinate, Figure 2d,e, black-filled circles). In the proposed depth determination approach, the reconstructed absorption profile of the turbid material can be used to guide the selection of Raman peaks of the inclusion which undergo different intensity attenuation and therefore they encode depth information. It is, however, not used in any other way in the process of determining the depth of inclusions.
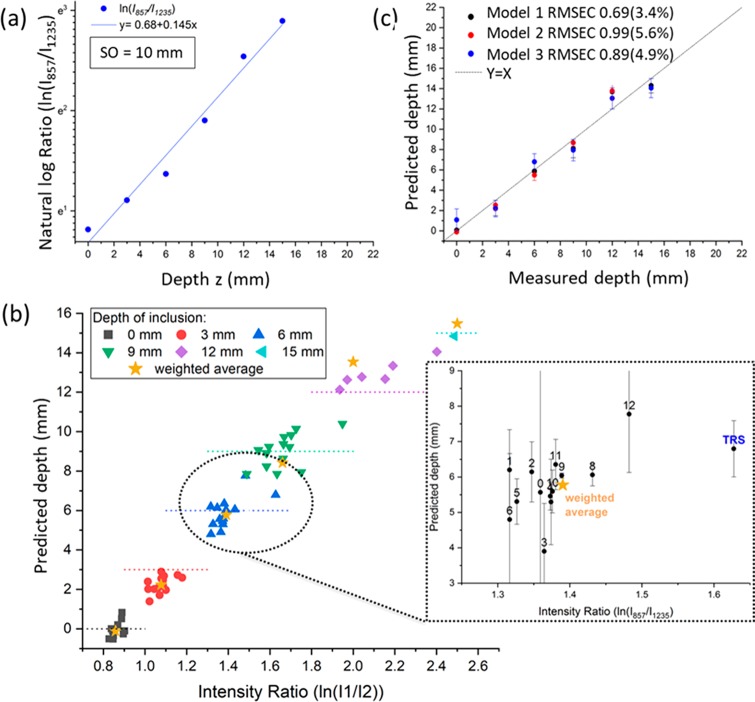
The next set of measurements included a matrix (PE) with an inclusion (paracetamol) buried at different depths within them. The reconstructed profile of the optical properties of the PE model sample (Figure 2e), here used as a turbid matrix, revealed that the two Raman peaks of paracetamol at 857 and 1235 cm–1 should exhibit a differential absorption behavior. Since the band at 1235 cm–1 falls under the absorption band of the turbid matrix (PE absorbance peak at 930 nm/1324 cm–1 expressed as a relative shift from the 830 nm excitation wavelength), its intensity is dramatically reduced relative to the 857 cm–1 component with increasing mean photon travel distance as a result of increasing depth (depth z, S-2). This difference in relative intensities can be satisfactorily approximated with a linear function when plotted as a natural logarithm of the ratio of the intensities (857 to 1235 cm–1) versus depth (i.e., z, Figure 3a). Figure 3b shows the predicted depths of the inclusion resulting from the measured intensity ratio from all different spatial offsets and TRS measurement. For each specific depth, the variability of the intensity ratio (the dot spread along x-axes in Figure 3b) highlights the different behavior of each model, while the variability of the predicted depth (the dot spread along y-axes in Figure 3b) captures the error of the models. Through the procedure previously described, by combining the output of all different spatial offsets and transmission measurements (Figure 3b), it was possible to predict the depth of paracetamol inclusion with a root-mean-square error of calibration (RMSEC) of 3.4% (i.e., ±0.61 mm). In Figure 3c, the effectiveness of SORS alone and TRS alone for depth prediction is compared: SORS (model 2 in Figure 3d) predicts depth with an RMSEC of ∼5%, but it loses sensitivity for deeper positions of the inclusion in the turbid media (d > 9 mm). On the other hand, TRS (model 3 in Figure 3d) has good sensitivity even in cases of larger depths, but it yields a lower accuracy for smaller depths (d < 9 mm).
Figure 3.
(a) Natural logarithm of the 857-to-1235 cm–1 ratio of paracetamol peaks (blue dots), with linear fit used as a calibration curve for the creation of the model (blue line). (b) Predictions of a paracetamol inclusion depth resulting from all SORS and TRS measurements; the horizontal line indicates the actual depth; orange stars indicate the weighted average resulting from the proposed combined approach. (c) Predicted vs measured depth obtained with the three models based on averages weighted for the accuracies of the performance of individual models built for each individual spatial offset and transmission data sets. Model 1 is based on all SORS (SO: 0 to 12 mm) and TRS measurements. Model 2 is based on the measurement of all spatial offsets for SORS alone (SO: 0 to 12 mm). Model 3 is based on TRS measurements alone.
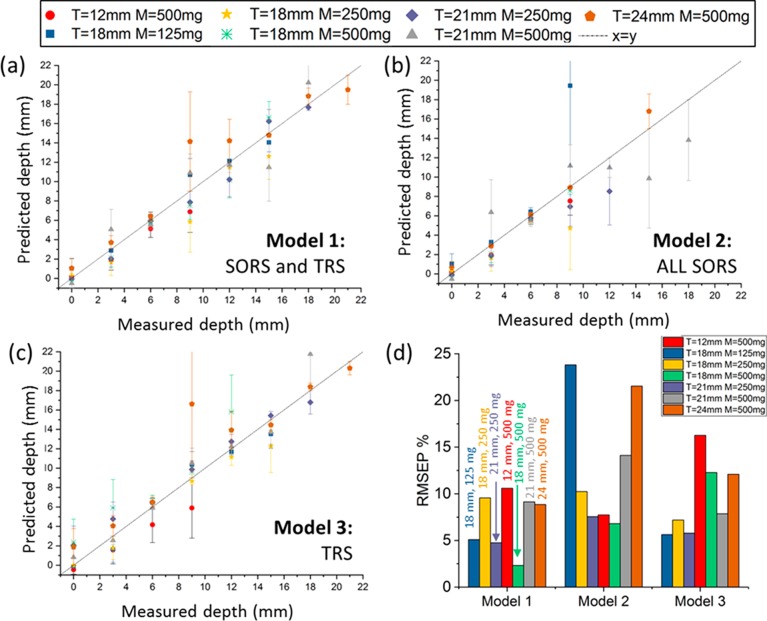
The proposed combined approach, that takes into account both TRS and SORS measurements (model 1 in Figure 3d), benefits from the advantages of both geometries and accurately predicts depth with a lower error overall (lower RMSEC ≅ 3.4%). In a real case scenario, the amount of the inclusion is often unknown and also the thickness of turbid media can vary. An ideal model, from our perspective, should be able to predict depth regardless of the thickness of the turbid media and with no a priori information on the amount of inclusion. Figure 4a–c shows the prediction of paracetamol depth, resulting from the three different models presented above, in seven different experiments in which the thickness and amount of material was changed (thicknesses and amounts summarized in Table 1). These additional sets of experiments confirmed the previous accuracy outcomes for SORS and TRS and established the relative robustness of the models to the amount of inclusion and thickness of the matrix. The model based on only SORS measurements (model 2) predicted small paracetamol depths (d < 9, 12 mm) well, but the loss of signal sensitivity became even more evident for larger thicknesses and smaller amounts of inclusion. This behavior translates into the root-mean-square error of prediction (RMSEP) that varies between 10 and 25% (Figure 4d). The TRS concept proved to be largely insensitive to the amount of inclusion (blue, yellow, and green dots in Figure 4), while a slight distortion from the expected value was observed by changing the thickness of the matrix (red and brown dot in Figure 4). In particular, TRS slightly underestimated the depth for data sets with smaller thicknesses (t = 12 mm, m = 500 mg). Overall, it can be concluded that the prediction of paracetamol depth on the basis of both SORS and TRS information resulted in gross insensitivity to the thickness of turbid media and the amount of inclusion (Figure 4a), with an RMSEP of inclusion depth always below 10.5% for all seven experiments. These results validate the use of the proposed approach even with no true prior information regarding the turbid media thickness and the inclusion amount. However, it should be noted that changing the chemical nature of the matrix and/or inclusion would necessitate building a new model.
Figure 4.
(a–c) Prediction of the paracetamol depth in the PE matrix of different thickness (t = 12, 18, and 24 mm) and for different amounts of inclusion (m = 500, 250, and 125 mg). (d) Root mean square error of prediction (RMSEP) expressed in terms of percentages. Model 1 is based on all SORS (SO: 0 to 12 mm) and TRS measurements. Model 2 is based on the measurement of all spatial offsets for SORS alone (SO: 0 to 12 mm). Model 3 is based on TRS measurements alone.
Table 1. Summary of the Different Thicknesses and Amounts of Inclusion Investigated.
| matrix
thickness (PE) |
||||
|---|---|---|---|---|
| amount of inclusion | 12 mm | 18 mm | 21 mm | 24 mm |
| 125 mg | × | |||
| 250 mg | × | × | ||
| 500 mg | × | × | × | × |
| calibration | ||||
Conclusion
We have shown how the proposed approach, based on SORS and TRS measurement, can successfully predict the depth of a single target object in a diffusely scattering medium. Here, we have taken advantage of the different depth sensitivity of SORS and TRS to improve the accuracy of the external calibrations for depth prediction. The results were discussed in the context of a previous study using only TRS measurements.11 The proposed combined approach is more accurate (lower RMSEC and RMSEP) and more robust to the variability of the inclusion amount and matrix thickness with respect to using TRS alone. Despite SORS losing effectiveness at greater depths with respect to TRS, it can be used in situations where TRS cannot be applied (for example, due to prohibitively high matrix thicknesses). This leads to a wider range of noninvasive applications where depth determination of a single inclusion is desired. In clinical settings, the ability to identify and localize the presence of anomalies noninvasively and at depth is especially important. Examples of potential applications include the localization and depth prediction of a cancer lesion in tissue or SERS nanoparticle cluster in biological tissues. In terms of applying the concept to biomedical studies, it is worth noting that its heterogeneity could present a considerable challenge. Different models may have to be built for different anatomical parts, and potentially, the concept may indeed need to be augmented by additional auxiliary techniques such as ultrasound imaging (e.g., to determine a thickness of a lipid layer) or theoretical models of light propagation in heterogeneous layered material (e.g., Monte Carlo simulations). The addition of this information in the construction of a calibration model might considerably improve the precision of the proposed approach in such challenging situations.
Acknowledgments
The work was supported by an EPSRC grant EP/R020965/1.
Supporting Information Available
The Supporting Information is available free of charge on the ACS Publications website at DOI: 10.1021/acs.analchem.9b01222.
Raman intensities of target, calibration curve for each spatial offset, and transmission Raman spectroscopy (PDF)
The authors declare no competing financial interest.
Supplementary Material
References
- Matousek P. Spatially Offset Raman Spectroscopy for Non-Invasive Analysis of Turbid Samples. TrAC, Trends Anal. Chem. 2018, 103, 209–214. 10.1016/j.trac.2018.04.002. [DOI] [Google Scholar]
- Matousek P.; Stone N. Development of Deep Subsurface Raman Spectroscopy for Medical Diagnosis and Disease Monitoring. Chem. Soc. Rev. 2016, 45 (7), 1794–1802. 10.1039/C5CS00466G. [DOI] [PubMed] [Google Scholar]
- Matousek P.; Clark I. P.; Draper E. R. C.; Morris M. D.; Goodship A. E.; Everall N.; Towrie M.; Finney W. F.; Parker A. W. Subsurface Probing in Diffusely Scattering Media Using Spatially Offset Raman Spectroscopys. Appl. Spectrosc. 2005, 59 (4), 393–400. 10.1366/0003702053641450. [DOI] [PubMed] [Google Scholar]
- Schrader B.; Bergmann G. Die Intensität Des Ramanspektrums Polykristalliner Substanzen. Fresenius' Z. Anal. Chem. 1967, 225 (2), 230–247. 10.1007/BF00983673. [DOI] [Google Scholar]
- Matousek P.; Parker A. W. Bulk Raman Analysis of Pharmaceutical Tablets. Appl. Spectrosc. 2006, 60, 1353. 10.1366/000370206779321463. [DOI] [PubMed] [Google Scholar]
- Martelli F.; Binzoni T.; Pifferi A.; Spinelli L.; Farina A.; Torricelli A. There’s Plenty of Light at the Bottom: Statistics of Photon Penetration Depth in Random Media. Sci. Rep. 2016, 6, 1–14. 10.1038/srep27057. [DOI] [PMC free article] [PubMed] [Google Scholar]
- Matousek P.; Morris M. D.; Everall N.; Clark I. P.; Towrie M.; Draper E. R. C.; Goodship A. E.; Parker A. W. Numerical Simulations of Subsurface Probing in Diffusely Scattering Media Using Spatially Offset Raman Spectroscopy. Appl. Spectrosc. 2005, 59 (12), 1485. 10.1366/000370205775142548. [DOI] [PubMed] [Google Scholar]
- Vardaki M. Z.; Matousek P.; Stone N. Characterisation of Signal Enhancements Achieved When Utilizing a Photon Diode in Deep Raman Spectroscopy of Tissue. Biomed. Opt. Express 2016, 7 (6), 2130. 10.1364/BOE.7.002130. [DOI] [PMC free article] [PubMed] [Google Scholar]
- Macleod N. A.; Goodship A.; Parker A. W.; Matousek P. Prediction of Sublayer Depth in Turbid Media Using Spatially Offset Raman Spectroscopy. Anal. Chem. 2008, 80 (21), 8146–8152. 10.1021/ac801219a. [DOI] [PubMed] [Google Scholar]
- Conti C.; Realini M.; Colombo C.; Botteon A.; Bertasa M.; Striova J.; Barucci M.; Matousek P. Determination of Thickness of Thin Turbid Painted Over-Layers Using Micro-Scale Spatially Offset Raman Spectroscopy. Philos. Trans. R. Soc. A Math. Phys. Eng. Sci. 2016, 374 (2082), 20160049. 10.1098/rsta.2016.0049. [DOI] [PMC free article] [PubMed] [Google Scholar]
- Gardner B.; Stone N.; Matousek P. Noninvasive Determination of Depth in Transmission Raman Spectroscopy in Turbid Media Based on Sample Differential Transmittance. Anal. Chem. 2017, 89 (18), 9730–9733. 10.1021/acs.analchem.7b01469. [DOI] [PubMed] [Google Scholar]
- Vardaki M. Z.; Sheridan H.; Stone N.; Matousek P. Determination of Depth in Transmission Raman Spectroscopy in Turbid Media Using a Beam Enhancing Element. Appl. Spectrosc. 2017, 71 (8), 1849–1855. 10.1177/0003702817691540. [DOI] [PubMed] [Google Scholar]
- Srinivasan S.; Schulmerich M.; Cole J. H.; Dooley K. A.; Kreide J. M.; Pogue B. W.; Morris M. D.; Goldstein S. A. Image-Guided Raman Spectroscopic Recovery of Canine Cortical Bone Contrast in Situ. Opt. Express 2008, 16, 12190–12200. 10.1364/OE.16.012190. [DOI] [PMC free article] [PubMed] [Google Scholar]
- Demers J.-L. H.; Esmonde-White F. W. L.; Esmonde-White K. A.; Morris M. D.; Pogue B. W. Next-Generation Raman Tomography Instrument for Non-Invasive in Vivo Bone Imaging. Biomed. Opt. Express 2015, 6 (3), 793. 10.1364/BOE.6.000793. [DOI] [PMC free article] [PubMed] [Google Scholar]
- Di Sieno L.; Zouaoui J.; Hervé L.; Pifferi A.; Farina A.; Martinenghi E.; Derouard J.; Dinten J.-M.; Mora A. D. Time-Domain Diffuse Optical Tomography Using Silicon Photomultipliers: Feasibility Study. J. Biomed. Opt. 2016, 21 (11), 116002. 10.1117/1.JBO.21.11.116002. [DOI] [PubMed] [Google Scholar]
- Ferocino E.; Martinenghi E.; Dalla Mora A.; Pifferi A.; Cubeddu R.; Taroni P. High Throughput Detection Chain for Time Domain Optical Mammography. Biomed. Opt. Express 2018, 9 (2), 755–770. 10.1364/BOE.9.000755. [DOI] [PMC free article] [PubMed] [Google Scholar]
- Arridge S. R.; Schweiger M. Image Reconstruction in Optical Tomography Overview. Philos. Trans. R. Soc. London, Ser. B 1997, 352, 717. 10.1098/rstb.1997.0054. [DOI] [PMC free article] [PubMed] [Google Scholar]
- Dehghani H.; Sri Nivasan S.; Pogue B. W.; Gibson A. Numerical Modelling and Image Reconstruction in Diffuse Optical Tomography. Philos. Trans. R. Soc., A 2009, 367 (1900), 3073–3093. 10.1098/rsta.2009.0090. [DOI] [PMC free article] [PubMed] [Google Scholar]
- Martelli F.; Binzoni T.; Sekar S. K. V.; Farina A.; Cavalieri S.; Pifferi A. Time-Domain Raman Analytical Forward Solvers. Opt. Express 2016, 24 (18), 20382. 10.1364/OE.24.020382. [DOI] [PubMed] [Google Scholar]
- Del Bianco S.; Martelli F.; Zaccanti G. Penetration Depth of Light Re-Emitted by a Diffusive Medium: Theoretical and Experimental Investigation. Phys. Med. Biol. 2002, 47 (23), 4131–4144. 10.1088/0031-9155/47/23/301. [DOI] [PubMed] [Google Scholar]
- Matousek P. Inverse Spatially Offset Raman Spectroscopy for Deep Spectroscopy of Turbid Media. Applied Spectroscopy 2006, 60 (11), 185–187. 10.1366/000370206778999102. [DOI] [PubMed] [Google Scholar]
- Kubelka P. New Contributions to the Optics of Intensely Light-Scattering Materials Part II: Nonhomogeneous Layers*. J. Opt. Soc. Am. 1954, 44 (4), 330. 10.1364/JOSA.44.000330. [DOI] [PubMed] [Google Scholar]
- Džimbeg-Malčić V.; Barbarić-Mikočević Ž.; Itrić K. Kubelka-Munk theory in describing optical properties of paper (I). Technical Gazette 2011, 18 (1), 117–124. [Google Scholar]
Associated Data
This section collects any data citations, data availability statements, or supplementary materials included in this article.


