

Abstract
The frequency and magnitude of extreme summer temperature events in the United States have increased in the past few decades. Long‐term exposure to extreme summer temperatures can be detrimental to human health, due to potential risks of dehydration and thermoregulation strains on the cardiovascular system, which may often lead to heat‐related mortality (HRM). The summer climate of the United States is influenced by variability in Atlantic and Pacific sea surface temperatures, driven in part by Atlantic Multidecadal Oscillation (AMO) and El‐Nino Southern Oscillation (ENSO), respectively. However, the influence of AMO and ENSO on HRM in the United States has not been investigated. Here the longest time series of HRM spanning the past five decades is analyzed in relation with AMO and ENSO. We find that HRM doubled in the early‐1990s, coinciding with the positive phase of the AMO. Furthermore, we note a positive association between the variability in HRM and summer temperatures across all regions of the United States, with the strongest association found over the Southern United States. Therefore, this research suggests that variability in Atlantic and Pacific sea surface temperatures has both a nationwide and regional impact on HRM in the United States. Hence, by understanding variability in sea surface temperatures, the future burden of heat‐attributed emergencies during extreme summer temperature events can be reduced not only for the United States, but also worldwide.
Keywords: Heat Related Mortality, Atlantic Multidecadal Oscillation, El Nino Southern Oscillation, United States
Key Points
U.S. heat‐related mortality is positively associated with rising summer temperatures, particularly in Southern regions
U.S. heat‐related mortality is influenced more by variability in Atlantic than Pacific sea surface temperatures
In combination the variability of Atlantic Multidecadal Oscillation and El Niño/La Niña explains ~20% of variance on heat‐related mortality
1. Introduction
The World Health Organization has declared climate change as the greatest threat to global human health in the twenty‐first century (Watts et al., 2015; WHO, 2018). Climate change has contributed to the annual increase in heat‐related mortality (HRM) worldwide over the past few decades (Davis et al., 2003; Gasparrini et al., 2015; Guo et al., 2017). In the United States, heat waves have been a prominent cause of human mortality during summer (Bell et al., 2018; Bobb et al., 2014; Davis et al., 2003; Guo et al., 2017; Semenza et al., 1996). For example, a record setting heat spell in Chicago during the summer of 1995, where temperatures in excess of 38 °C (excluding the humidex) over a period of a week, led to more than 700 deaths (Semenza et al., 1996).
Despite the relationship between summer temperatures and human mortality, some have argued that only a fraction of these deaths are directly attributable to heat (Bell et al., 2018; Bobb et al., 2014; Davis et al., 2003). In fact, the majority of HRM are associated with prephysiologic conditions, such as circulatory diseases, as well as the individual's socioeconomic status, including the ability to afford air conditioning costs during hot spells (Bell et al., 2018; Bobb et al., 2014; Davis et al., 2003). Specifically, mortality due to cardiovascular diseases had risk factors similar to those for HRM, which also included the adverse effects of social isolation (Semenza et al., 1996).
In the Northern Hemisphere above average summer (June‐July‐August), ambient temperatures are associated with increased HRM (Bobb et al., 2014; Mora et al., 2017). It is known that fluctuations in the North American climate are related to variability in Atlantic and Pacific sea surface temperatures (Cai et al., 2015; Jia et al., 2016; McCabe et al., 2004; McKinnon et al., 2016; Sutton & Hodson, 2005). Variability in sea surface temperatures over the Pacific Ocean is primarily driven by ENSO, whereas over the Atlantic Ocean the main driver is the AMO. ENSO is characterized by zonal fluctuations in sea surface temperatures across the tropical Pacific Ocean, which varies on interannual time scales with periods between ~2–7 years (Diaz et al., 2001), consisting of two phases: El Niño (warm) and La Niña (cool). ENSO has an influence on U.S. temperatures, precipitation, and droughts (Cai et al., 2015; Diaz et al., 2001; Jia et al., 2016; McCabe et al., 2004). For example, a strong El Niño results in a higher probability of extreme summer temperatures in the Midwest United States (Gershunov, 1998). In contrast, the AMO is characterized by coherent sea surface temperature fluctuations across the entire North Atlantic Ocean with a period of ~60–80 years (Enfield et al., 2001; McCabe et al., 2004; Sutton & Hodson, 2005). The AMO modulates a number of important climate processes including variability of droughts in the United States and the Mississippi stream flow (Enfield et al., 2001; McCabe et al., 2004; Sutton & Hodson, 2005). Like ENSO, the AMO also has an influence on the U.S. summer climate, leading to changes in the frequency of extreme climatological events (Sutton & Hodson, 2005). Hence, given the impact that Atlantic and Pacific Oceans have on the North American climate system, we investigate the relationship of sea surface temperature variability on interannual and decadal time scales and HRM in the United States.
2. Methodology
2.1. United States HRM Rates
We analyzed the U.S. annual rates (per million individuals) for mortality/deaths classified as “heat‐related” by medical professionals. These annual HRM rates were based on the entire population of the United States, which included all age groups, sexes, and races of males and females from 1968–2016. The data were obtained from the U.S. Centers for Disease Control and Prevention (CDC, 2017). This study documents the longest analysis of HRM stretching back nearly the past five decades. The construction of this time series from 1968–2016 was based on International Classification of Diseases (ICD) 8‐10, for “excessive heat.” This time series includes ICD‐8 code E900 (1968–1978), average U.S. population of 210,942,091; ICD‐9 code E900 (1979–1998), average U.S. population of 246,578,092; and ICD‐10 code X30 (1999–2016), average U.S. population of 301,985,911.
HRM depicted a reversal trend from negative to positive during the early‐1990s. Hence, to find the breakpoint year that the change in HRM occurred from low to high, a piecewise linear fit was applied. The breakpoint year was determined by computing the root mean square error for a 10‐year window of 1985–1995. During this time period, the minimum root mean square error was found to be 0.484 in the year 1992. Consequently, 1992 (±3‐year uncertainty) was chosen as the breakpoint to perform the piecewise linear fit.
2.2. AMO and ENSO Indices
The summer (June‐July‐August) AMO and ENSO indices were obtained from the National Oceanic and Atmospheric Administration (NOAA). The summer AMO index from 1950–2016 was defined as the mean summer sea surface temperature field of the Kaplan data set over the domain from 0–70°N and 75–7°W (Enfield et al., 2001), whereas the domain for the summer ENSO index from 1950–2016 incorporates the mean summer sea surface temperature field of the NOAA ERSSTv5 data set from 5°N to 5°S and 120–170°W (Diaz et al., 2001), using the Nino‐3.4 index (inverted).
Although the relationship between Pacific sea surface temperature anomalies (i.e., measured by the ENSO index) and Northern Hemisphere weather is well established for the winter season (Alexander et al., 2002), we chose to study the summer season, for the simple fact that majority of HRM occur between June and August (Davis et al., 2003).
2.3. Geospatial Analysis
For geospatial grid correlations, the average summer (June‐July‐August) 2‐m air temperature (T2m) from the National Centers for Environmental Prediction reanalysis was used (Kalnay et al., 1996). For the purpose of geospatial correlations, the HRM, summer AMO index, and ENSO index time series were linearly detrended. The geospatial correlations of summer T2m to the three time series were restricted to the longitude domain of 0°W to 120°E and a latitude domain of 20°S to 80°N.
A composite analysis for mean summer T2m was computed for the years 1980, 1995, 1999, and 2006 when HRM rates were high, as well as the years 1971, 1979, 1982, and 2014 when HRM rates were low. High and low HRMs were determined from their interannual variability (see section 2.5).
2.4. U.S. Regional Temperatures
Summer temperature anomalies of nine U.S. regions are divided according to NOAA's National Centers for Environmental Information. The nine U.S. regions for this study include the Northwest, Northern Rockies and Plains, Upper Midwest, Northeast, Ohio Valley, West, Southwest, South, and Southeast United States (Karl & Koss, 1984).
2.5. Statistical Data Analysis
The low‐frequency variability of the U.S. HRM, summer AMO, and ENSO indices (Figure 2a) was determined by first normalizing each time series by subtracting the mean and then dividing by the standard deviation. After normalization, the Singular Spectral Analysis technique was applied. The Singular Spectral Analysis was used to reconstruct the low frequency variability for all three time series. This technique employs data adaptive basis functions to separate a time series into statistically independent components that maximize the variability that each basis function describes (Ghil et al., 2002).
Figure 2.
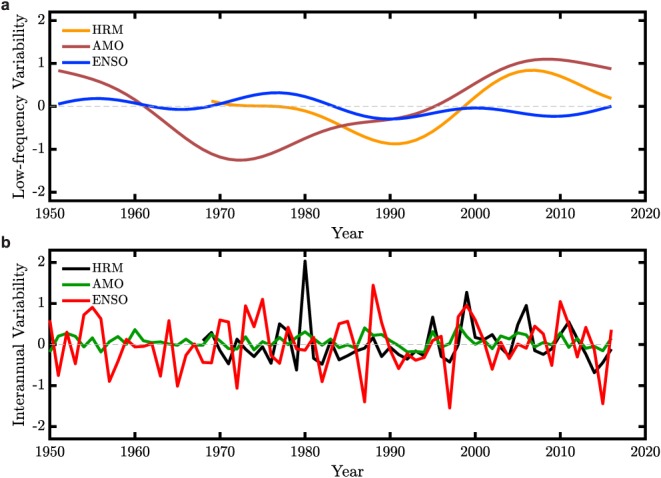
Normalized low‐frequency and interannual variability. (a) Normalized low‐frequency variability of the U.S. annual HRM rates (orange) from 1968–2016 and summer AMO (brown) and ENSO (blue) indices from 1950–2016. (b) Interannual variability of HRM rates (black) from 1968–2016 and summer AMO (green) and ENSO (red) indices from 1950–2016.
It was found that the three time series and U.S. regional temperature anomalies have a temporal autocorrelation from one year to the next, resulting in red noise spectra that are characterized by a reduction in the number of degrees of freedom (Zwiers & von Storch, 1995). For this reason, the statistical significance (>95% CL) of the piecewise linear fits and correlations were determined from a Monte Carlo simulation, generating 10,000 synthetic time series with the same spectral characteristics as the original time series (Majeed & Moore, 2017). All figures were produced using MATLAB R2017b.
3. Results
3.1. Time Series Analyses
The time series of U.S. annual HRM rates from 1968–2016 are shown in Figure 1a (see section 2). This time series exhibits low‐frequency variability with a reversal in the trend occurring in the year 1992 (see section 2). The median incidences of HRM rates during the period of 1968–1992 were 0.62 deaths per million with a declining trend of −0.19 deaths per million per decade (>99% CL), whereas during the period of 1992–2016, it was 1.05 deaths per million with an increasing trend of 0.40 deaths per million per decade (>99% CL), shown in Figure 1a.
Figure 1.
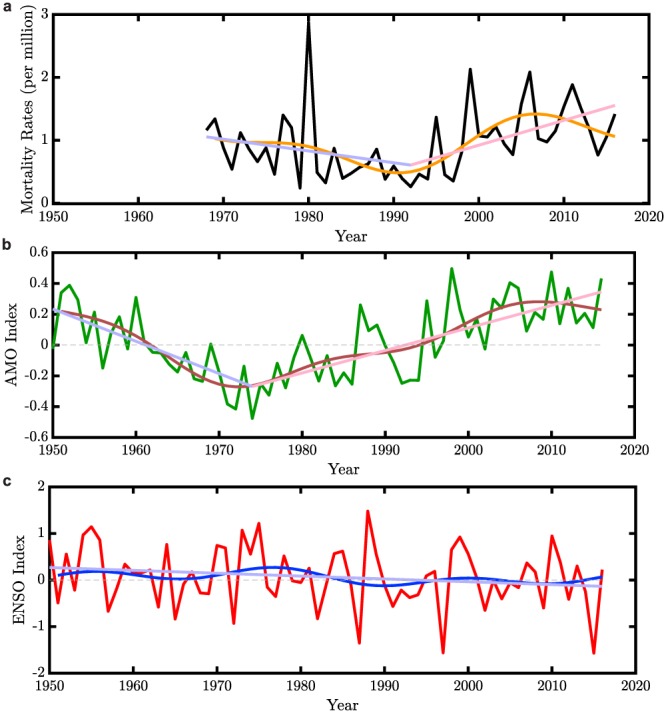
Time series analysis. (a) U.S. annual HRM rates (black) from 1968–2016, along with a low‐frequency variability (orange) and piecewise linear fit. From 1968–1992, HRM rates had a declining trend (purple) of −0.19 deaths per million per decade (>95% CL), whereas from 1992–2016 HRM rates had a trend (pink) of 0.40 deaths per million per decade (>99% CL). (b) Summer AMO index (green) from 1950–2016, along with a low‐frequency variability (brown) and piecewise linear fit. From 1950–1974, the AMO index had a declining trend (purple) of −0.21 °C per decade (>99% CL), whereas from 1974–2016 an increasing trend (pink) of 0.15 °C per decade (>99% CL). (c) Inverted summer ENSO index (red), along with a declining trend (purple) of −0.06 °C per decade (>99% CL) and a low‐frequency variability (blue) from 1950–2016.
The summer (June‐July‐August) AMO (Figure 1b) and ENSO (Figure 1c) indices from 1950–2016 illustrate Atlantic and Pacific sea surface temperature variability, respectively (see section 2). Throughout this period the summer AMO index experienced a declining trend of −0.21 °C per decade (>99% CL) from 1950–1974 and a positive trend from 1974–2016 of 0.15 °C per decade (>99% CL). On the other hand, the ENSO index has a statistically significant negative trend of −0.06°C per decade (>99% CL) from 1950–2016. The negative trend noted in the ENSO index is consistent with the increasing occurrence of central Pacific El Niño events, a trend that is projected by some studies to continue with ongoing climate change (Freund et al., 2019).
Additionally, the three time series (i.e., HRM, summer AMO, and ENSO indices) shown in Figure 2a were found to experience long‐term fluctuations, which we refer to as low‐frequency variability (see section 2). Throughout the late 1960s to the late 1980s, the low‐frequency variability in HRM seemed to be synchronized with low‐frequency variability noted in the summer ENSO index. Whereas after the early 1990s, the low‐frequency variability in HRM seemed to coincide with the low‐frequency variability of the summer AMO index. The summer AMO index was observed to have a negative to positive trend around the mid‐1970s; hence, the similar method as the HRM time series was applied to determine the breakpoint. The breakpoint year in the summer AMO index was determined to be 1974 (±2‐year uncertainty). We believe the period during which HRM started increasing corresponded to a shift in the AMO from a negative to a positive phase.
Furthermore, the association between the interannual variability of HRM to the summer AMO index results in a statistically significant correlation coefficient of 0.45 (>99% CL), whereas to the ENSO index the correlation coefficient is 0.15 (<95% CL) from 1968–2016. This suggests that over the past five decades, the interannual variability in the AMO has a more dominant influence on HRM in the United States than the interannual variability in ENSO, hence explaining ~20% of the variance in such deaths.
3.2. Influence of Geospatial and Regional Temperatures on HRM
Since both the AMO and ENSO are large‐scale climate patterns with regional impacts throughout North America (Diaz et al., 2001; Knight et al., 2006), we also considered a geospatial approach to understand the relationship of these patterns on the regionality of HRM throughout the United States. Grid point correlations with interannual variability of the three time series (i.e., HRM, summer AMO, and ENSO indices) to mean summer (June‐July‐August) T2m from 1968–2016 were analyzed, shown in Figure 3. The grid point correlation between interannual variability in HRM to summer T2m from 1968–2016 (Figure 3a) shows the strongest association (r = ~0.7, >95% CL) over the Southern United States. Specifically, positive correlations are seen over the Eastern half of North America and over the North Atlantic Ocean, which resembles the geospatial correlation of interannual variability in the summer AMO index to summer T2m (Figure 3b). On the other hand, Western North America and the Eastern Pacific Ocean exhibit statistically significant negative correlations, resembling the geospatial correlation of interannual variability in the summer ENSO index to summer T2m (Figure 3c). This finding suggests that HRM in the Eastern United States is influenced by the AMO, while HRM exhibited in the Western United States is influenced by ENSO.
Figure 3.
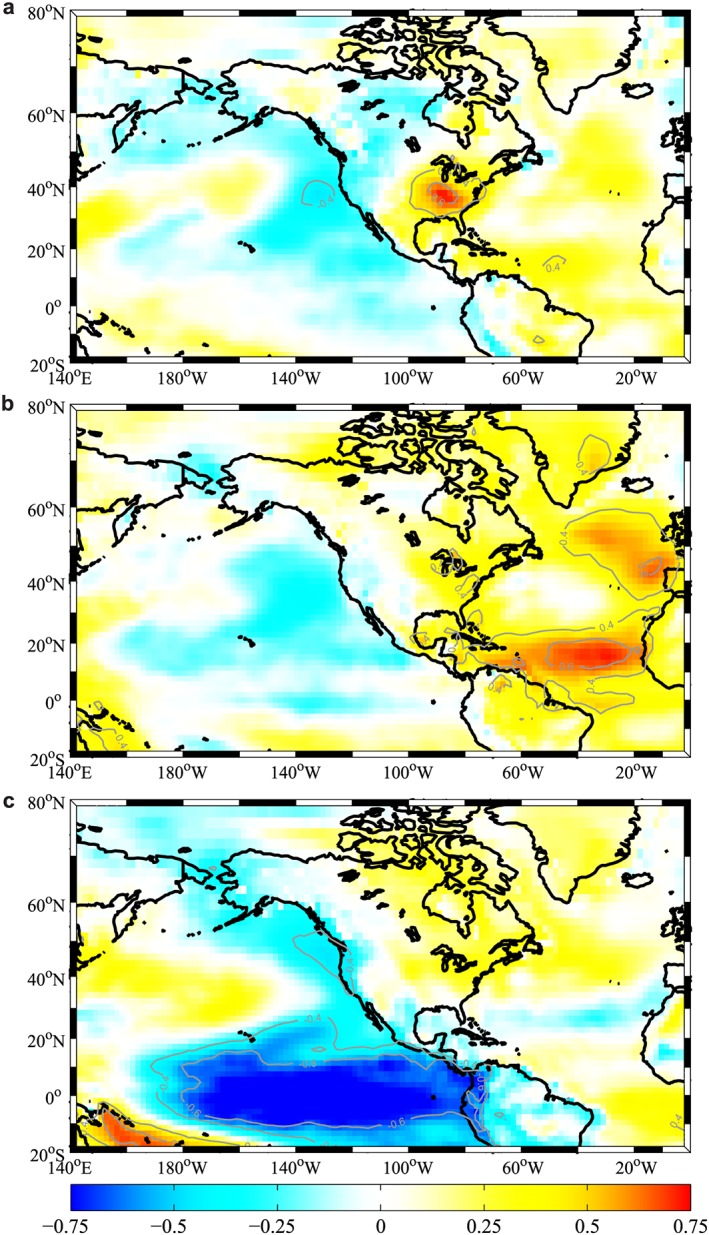
Grid point correlations between summer T2m and the interannual variability in (a) HRM rates, (b) summer AMO index, and (c) summer ENSO index from 1968–2016. The statistically significant (>95% CL) correlation coefficients have been contoured in gray.
In Figure 3a we show a nation‐wide geospatial correlation between interannual variability in HRM to summer surface temperatures from 1968–2016, and from this, a dipole signal that spans the country from East to West can be observed. This led us to speculate that there is an association between regional U.S. mean summer (June‐July‐August) temperature anomalies and HRM, as shown in Figure 4. The geospatial signal seen over the United States is consistent with regional correlations with the strongest correlation noted over the Southern United States (r = 0.67, >99% CL). Regions in the Southern United States exhibit hot spells on a regular basis during the summer characterized by the presence of moist tropical air masses (Diem et al., 2017). The weakest correlations were found in the Western, Northwest, and Northern Rocky regions of the United States, again consistent with our geospatial signal in Figure 3a.
Figure 4.
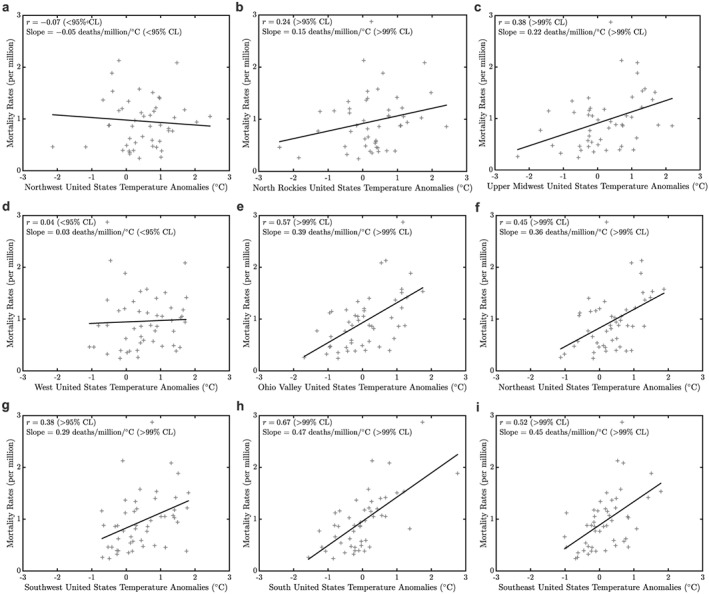
(a–i) Association between regional U.S. summer temperature anomalies and HRM rates from 1968–2016.
To confirm our results from Figure 3a, we computed geospatial composite anomalies of summer T2m for the years of high (Figure 5a) and low (Figure 5b) interannual variability in HRM. Figure 5c shows that the signal in geospatial summer T2m composite anomalies is similar to our grid point correlation in Figure 3a. At the same time, a strong warm signal of ~2 °C is seen over the Southern United States, consistent with our results in Figure 4.
Figure 5.
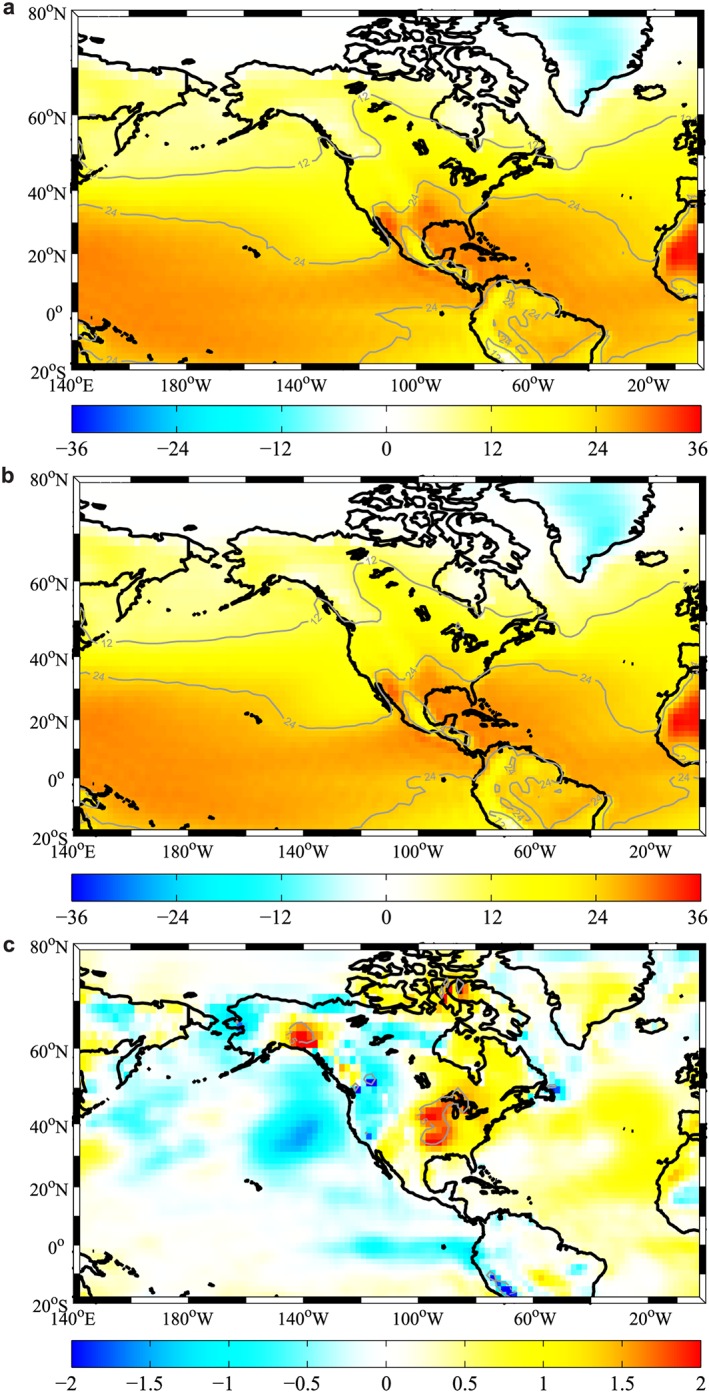
(a) Mean summer T2m (°C) for the years 1980, 1995, 1999, and 2006, when HRM rates were 1σ above the average (i.e., high). (b) Mean summer T2m (°C) for the years 1971, 1979, 1982, and 2014, when HRM rates were 1σ below the average (i.e., low). (c) Difference in summer T2m (°C) between years of high and low HRM rates. Contours have been indicated in gray for visual purposes.
4. Discussion
As mentioned earlier, it has been argued that extreme heat events are not directly related to human mortality; rather, it is believed that there are physiological mechanisms that may lead to an elevated risk for HRM (Bell et al., 2018; Bobb et al., 2014; Davis et al., 2003). One physiological mechanism discussed in the literature is that high ambient temperatures lead to dilation of blood vessels over the surface of skin, leading to thermoregulation strains on the cardiovascular system and risk of dehydration (Anderson & Bell, 2011).
Human exposures to temperature‐related extreme summer events are linked to both mortality and morbidity, which is especially the case for cardiovascular deaths (Medina‐Ramón et al., 2006). In fact, a recent nation‐wide study documented cardiovascular disease age‐standardized mortality rates (based on per 100,000 individuals in the U.S. population) over decadal periods from 1980–2014 (Roth et al., 2017). This study revealed that among 3,110 counties in the United States, large multicounty regions with the greatest age‐standardized mortality rates due to cardiovascular disease occurred in the Southeast United States, including Oklahoma along the Mississippi River Valley to eastern Kentucky (Roth et al., 2017). We believe that the warm signal found in our results over the Southern United States is perhaps consistent with the greatest cardiovascular disease mortality rates occurring in the Southern United States (Roth et al., 2017).
Additionally, it is known that rising temperatures over land tend to result in drier conditions (Trenberth et al., 2015). Thus, we believe that persistent heat and summer temperature events are hazardous to human health as it amplifies dehydration leading to rapid swings in intravascular volume and may inflict metabolic injury to multiple organ systems. Furthermore, another factor leading to a rise of HRM may be an aging U.S. population, resulting in an increasing number of communities vulnerable to extreme heat events (Diem et al., 2017; Medina‐Ramón et al., 2006).
Furthermore, communities residing in areas of low socioeconomic status (i.e., lack of air conditioning among inhabitants of apartment buildings than among inhabitants of private homes) are also noted to be associated with increased mortality during heat waves (Semenza et al., 1996). In addition, preexisting health conditions such as heart disease, kidney disease, and mental illness are known to have an increased risk of mortality during heat waves (Semenza et al., 1996). Thus, while it is known that other aspects, such as preexisting chronic health conditions and socioeconomic status may play an important role in understanding long‐term HRM in the United States (Rosenthal et al., 2014), however, such factors were not considered in this study. Nevertheless, our population‐based research investigation suggests that large‐scale climate patterns, in particular the AMO and ENSO, are associated with HRM in the United States. Further research is needed to understand mechanism(s) that are responsible for elevated HRM.
The low‐frequency variability of HRM in the United States is found to have a period of ~20 years. This would suggest that the rising trend in HRM starting in 1992 will persist for another ~10–20 years from the current decade, similar to the periodicity of low‐frequency variability seen in the AMO index (Majeed & Moore, 2017). In addition, the statistically significant negative trend in the summer ENSO index has important implications, one of which is the increasing likelihood of occurrences in extreme climate events in the United States, and more frequent swings of opposite extremes from one year to the next (Cai et al., 2015), and perhaps profound consequences on vulnerable populations, increasing the possibility of HRM (Howe et al., 2019).
With climate models projecting a rise in excessive heat events and increasing heat‐attributable mortality across cities in the Southern United States till the end of the twenty‐first century (Greene et al., 2011), large‐scale climate patterns like the AMO and ENSO can be used to predict the burden of heat‐attributed emergency hospitalizations during extreme summer events. Therefore, we encourage future studies to incorporate large‐scale climate patterns into future public health perspectives of climate change and its impact on humans.
5. Summary and Conclusions
To our knowledge, this is the first study that documents the influence of Atlantic and Pacific sea surface temperature variability on HRM in the United States over the past five decades. Results suggest that HRM in the United States doubled in the 1990s, coinciding with a positive phase of the AMO. The low‐frequency variability in HRM was found to have a period of ~20 years. This would propose that the rise of HRM will persist for another ~10–20 years from the current decade, which is similar to the periodicity seen in the AMO. Furthermore, a positive association was found between HRM and regional summer temperature anomalies in the United States, with the strongest signal over the Southern United States. We encourage future research to investigate the influence of climate variability on HRM in countries other than the United States. From this study, given the influence of multidecadal oceanic variability (i.e., through AMO and ENSO) on HRM, it might take a few decades before there is a clear signal regarding HRM in the United States due to climate change.
Conflict of Interest
All authors declare no conflicts of interest relevant to this study.
Acknowledgments
The authors would like to thank the U.S. CDC, NOAA, and NCEP (T2m) for access to all the data analyzed in this study. We also thank the anonymous reviewer whose comments have greatly improved this manuscript. The HRM rates were available through the U.S. Centers for Disease Control and Prevention (CDC, 2017). ENSO, AMO indices and U.S. regional summer temperature anomalies were obtained from NOAA (Karl & Koss, 1984). In accordance with FAIR Data Standards, our U.S. heat‐related mortality rates have been available through Mendeley (https://data.mendeley.com/datasets/5g25bh335k/1). Data for the ENSO and AMO indices can be found online (https://www.esrl.noaa.gov/psd/data/climateindices/list/). The NCEP reanalysis of T2m data was obtained from NOAA (Kalnay et al., 1996). Author contributions are as follows: conceptualization: Haris Majeed; data curation: Haris Majeed; formal analysis: Haris Majeed, John G. Coles, and G.W.K. Moore; funding acquisition: none; investigation: Haris Majeed; methodology: Haris Majeed and G.W.K. Moore; project administration:Haris Majeed; supervision: Haris Majeed; writing‐original draft: Haris Majeed; writing‐review and editing: Haris Majeed, John G. Coles, and G.W.K. Moore.
Majeed, H. , Coles, J. G. , & Moore, G. W. K. (2020). Influence of Atlantic and Pacific sea surface temperatures on heat‐related mortality in the United States. GeoHealth, 4, e2019GH000220 10.1029/2019GH000220
References
- Alexander, M. A. , Bladé, I. , Newman, M. , Lanzante, J. R. , Lau, N. C. , & Scott, J. D. (2002). The atmospheric bridge: The influence of ENSO teleconnections on air‐sea interaction over the global oceans. Journal of Climate, 15(16), 2205–2231. [Google Scholar]
- Anderson, G. B. , & Bell, M. L. (2011). Heat waves in the United States: Mortality risk during heat waves and effect modification by heat wave characteristics in 43 US communities. Environmental Health Perspectives, 119(2), 210–218. 10.1289/ehp.1002313 [DOI] [PMC free article] [PubMed] [Google Scholar]
- Bell, J. E. , Brown, C. L. , Conlon, K. , Herring, S. , Kunkel, K. E. , Lawrimore, J. , Luber, G. , Schreck, C. , Smith, A. , & Uejio, C. (2018). Changes in extreme events and the potential impacts on human health. Journal of the Air & Waste Management Association, 68(4), 265–287. 10.1080/10962247.2017.1401017 [DOI] [PMC free article] [PubMed] [Google Scholar]
- Bobb, J. F. , Peng, R. D. , Bell, M. L. , & Dominici, F. (2014). Heat‐related mortality and adaptation to heat in the United States. Environmental Health Perspectives, 122(8), 811–816. 10.1289/ehp.1307392 [DOI] [PMC free article] [PubMed] [Google Scholar]
- Cai, W. , Wang, G. , Santoso, A. , McPhaden, M. J. , Wu, L. , Jin, F. F. , et al. (2015). Increased frequency of extreme La Niña events under greenhouse warming. Nature Climate Change, 5(2), 132–137. [Google Scholar]
- CDC (U.S. Centers for Disease Control and Prevention) (2017). CDC WONDER database: Compressed mortality file, underlying cause of death. http://wonder.cdc.gov/mortSQL.html
- Davis, R. E. , Knappenberger, P. C. , Michaels, P. J. , & Novicoff, W. M. (2003). Changing heat‐related mortality in the United States. Environmental Health Perspectives, 111(14), 1712–1718. 10.1289/ehp.6336 [DOI] [PMC free article] [PubMed] [Google Scholar]
- Diaz, H. F. , Hoerling, M. P. , & Eischeid, J. K. (2001). ENSO variability, teleconnections and climate change. International Journal of Climatology, 21(15), 1845–1862. [Google Scholar]
- Diem, J. E. , Stauber, C. E. , & Rothenberg, R. (2017). Heat in the southeastern United States: Characteristics, trends, and potential health impact. PLoS ONE, 12(5), e0177937 10.1371/journal.pone.0177937 [DOI] [PMC free article] [PubMed] [Google Scholar]
- Enfield, D. B. , Mestas‐Nuñez, A. M. , & Trimble, P. J. (2001). The Atlantic multidecadal oscillation and its relation to rainfall and river flows in the continental US. Geophysical Research Letters, 28(10), 2077–2080. [Google Scholar]
- Freund, M. B. , Henley, B. J. , Karoly, D. J. , McGregor, H. V. , Abram, N. J. , & Dommenget, D. (2019). Higher frequency of Central Pacific El Niño events in recent decades relative to past centuries. Nature Geoscience, 12(6), 450–455. [Google Scholar]
- Gasparrini, A. , Guo, Y. , Hashizume, M. , Lavigne, E. , Zanobetti, A. , Schwartz, J. , Tobias, A. , Tong, S. , Rocklöv, J. , Forsberg, B. , Leone, M. , de Sario, M. , Bell, M. L. , Guo, Y. L. , Wu, C. F. , Kan, H. , Yi, S. M. , de Sousa Zanotti Stagliorio Coelho, M. , Saldiva, P. H. , Honda, Y. , Kim, H. , & Armstrong, B. (2015). Mortality risk attributable to high and low ambient temperature: A multicountry observational study. Lancet, 386(9991), 369–375. 10.1016/S0140-6736(14)62114-0 [DOI] [PMC free article] [PubMed] [Google Scholar]
- Gershunov, A. (1998). ENSO influence on intraseasonal extreme rainfall and temperature frequencies in the contiguous United States: Implications for long‐range predictability. Journal of Climate, 11(12), 3192–3203. [Google Scholar]
- Ghil, M. , Allen, M. R. , Dettinger, M. D. , Ide, K. , Kondrashov, D. , Mann, M. E. , Robertson, A. W. , Saunders, A. , Tian, Y. , Varadi, F. , & Yiou, P. (2002). Advanced spectral methods for climatic time series. Reviews of Geophysics, 40(1), 1003 10.1029/2000RG000092 [DOI] [Google Scholar]
- Greene, S. , Kalkstein, L. S. , Mills, D. M. , & Samenow, J. (2011). An examination of climate change on extreme heat events and climate‐mortality relationships in large US cities. Weather, Climate, and Society, 3(4), 281–292. [Google Scholar]
- Guo, Y. , Gasparrini, A. , Armstrong, B. G. , Tawatsupa, B. , Tobias, A. , Lavigne, E. , Coelho, M. S. Z. S. , Pan, X. , Kim, H. , Hashizume, M. , Honda, Y. , Guo, Y. L. , Wu, C. F. , Zanobetti, A. , Schwartz, J. D. , Bell, M. L. , Scortichini, M. , Michelozzi, P. , Punnasiri, K. , Li, S. , Tian, L. , Garcia, S. D. O. , Seposo, X. , Overcenco, A. , Zeka, A. , Goodman, P. , Dang, T. N. , Dung, D. V. , Mayvaneh, F. , Saldiva, P. H. N. , Williams, G. , & Tong, S. (2017). Heat wave and mortality: A multicountry, multicommunity study. Environmental Health Perspectives, 125(8), 087006 10.1289/EHP1026 [DOI] [PMC free article] [PubMed] [Google Scholar]
- Howe, P. D. , Marlon, J. R. , Wang, X. , & Leiserowitz, A. (2019). Public perceptions of the health risks of extreme heat across US states, counties, and neighborhoods. Proceedings of the National Academy of Sciences, 116(14), 6743–6748. [DOI] [PMC free article] [PubMed] [Google Scholar]
- Jia, L. , Vecchi, G. A. , Yang, X. , Gudgel, R. G. , Delworth, T. L. , Stern, W. F. , Paffendorf, K. , Underwood, S. D. , & Zeng, F. (2016). The roles of radiative forcing, sea surface temperatures, and atmospheric and land initial conditions in US summer warming episodes. Journal of Climate, 29(11), 4121–4135. 10.1175/JCLI-D-15-0471.1 [DOI] [Google Scholar]
- Kalnay, E. , Kanamitsu, M. , Kistler, R. , Collins, W. , Deaven, D. , Gandin, L. , Iredell, M. , Saha, S. , White, G. , Woollen, J. , Zhu, Y. , Leetmaa, A. , Reynolds, R. , Chelliah, M. , Ebisuzaki, W. , Higgins, W. , Janowiak, J. , Mo, K. C. , Ropelewski, C. , Wang, J. , Jenne, R. , & Joseph, D. (1996). The NCEP/NCAR 40‐year reanalysis project. Bulletin of the American Meteorological Society, 77(3), 437–471. [DOI] [Google Scholar]
- Karl, T. R. & Koss, W. J. (1984). Regional and national monthly, seasonal, and annual temperature weighted by area, 1895‐1983 Historical Climatology Series 4‐3 National Climatic Data Center Asheville NC 38. National Oceanic and Atmospheric Administration (NOAA). [Google Scholar]
- Knight, J. R. , Folland, C. K. , & Scaife, A. A. (2006). Climate impacts of the Atlantic Multidecadal Oscillation. Geophysical Research Letters, 33, L17706 10.1029/2006GL026242 [DOI] [Google Scholar]
- Majeed, H. , & Moore, G. W. K. (2017). Impact of multidecadal climate variability on United Kingdom rickets rates. Scientific Reports, 7(1), 15764 10.1038/s41598-017-16058-1 [DOI] [PMC free article] [PubMed] [Google Scholar]
- McCabe, G. J. , Palecki, M. A. , & Betancourt, J. L. (2004). Pacific and Atlantic Ocean influences on multidecadal drought frequency in the United States. Proceedings of the National Academy of Sciences, 101(12), 4136–4141. [DOI] [PMC free article] [PubMed] [Google Scholar]
- McKinnon, K. A. , Rhines, A. , Tingley, M. P. , & Huybers, P. (2016). Long‐lead predictions of eastern United States hot days from Pacific sea surface temperatures. Nature Geoscience, 9(5), 389–394. [Google Scholar]
- Medina‐Ramón, M. , Zanobetti, A. , Cavanagh, D. P. , & Schwartz, J. (2006). Extreme temperatures and mortality: Assessing effect modification by personal characteristics and specific cause of death in a multi‐city case‐only analysis. Environmental Health Perspectives, 114(9), 1331–1336. 10.1289/ehp.9074 [DOI] [PMC free article] [PubMed] [Google Scholar]
- Mora, C. , Dousset, B. , Caldwell, I. R. , Powell, F. E. , Geronimo, R. C. , Bielecki, C. R. , Counsell, C. W. W. , Dietrich, B. S. , Johnston, E. T. , Louis, L. V. , Lucas, M. P. , McKenzie, M. M. , Shea, A. G. , Tseng, H. , Giambelluca, T. W. , Leon, L. R. , Hawkins, E. , & Trauernicht, C. (2017). Global risk of deadly heat. Nature Climate Change, 7(7), 501–506. 10.1038/nclimate3322 [DOI] [Google Scholar]
- Rosenthal, J. K. , Kinney, P. L. , & Metzger, K. B. (2014). Intra‐urban vulnerability to heat‐related mortality in New York City, 1997‐2006. Health & Place, 30, 45–60. [DOI] [PMC free article] [PubMed] [Google Scholar]
- Roth, G. A. , Dwyer‐Lindgren, L. , Bertozzi‐Villa, A. , Stubbs, R. W. , Morozoff, C. , Naghavi, M. , Mokdad, A. H. , & Murray, C. J. L. (2017). Trends and patterns of geographic variation in cardiovascular mortality among US counties, 1980‐2014. JAMA, 317(19), 1976–1992. 10.1001/jama.2017.4150 [DOI] [PMC free article] [PubMed] [Google Scholar]
- Semenza, J. C. , Rubin, C. H. , Falter, K. H. , Selanikio, J. D. , Flanders, W. D. , Howe, H. L. , & Wilhelm, J. L. (1996). Heat‐related deaths during the July 1995 heat wave in Chicago. New England Journal of Medicine, 335(2), 84–90. 10.1056/NEJM199607113350203 [DOI] [PubMed] [Google Scholar]
- Sutton, R. T. , & Hodson, D. L. (2005). Atlantic Ocean forcing of North American and European summer climate. Science, 309(5731), 115–118. 10.1126/science.1109496 [DOI] [PubMed] [Google Scholar]
- Trenberth, K. E. , Fasullo, J. T. , & Shepherd, T. G. (2015). Attribution of climate extreme events. Nature Climate Change, 5(8), 725–730. [Google Scholar]
- Watts, N. , Adger, W. N. , Agnolucci, P. , Blackstock, J. , Byass, P. , Cai, W. , Chaytor, S. , Colbourn, T. , Collins, M. , Cooper, A. , Cox, P. M. , Depledge, J. , Drummond, P. , Ekins, P. , Galaz, V. , Grace, D. , Graham, H. , Grubb, M. , Haines, A. , Hamilton, I. , Hunter, A. , Jiang, X. , Li, M. , Kelman, I. , Liang, L. , Lott, M. , Lowe, R. , Luo, Y. , Mace, G. , Maslin, M. , Nilsson, M. , Oreszczyn, T. , Pye, S. , Quinn, T. , Svensdotter, M. , Venevsky, S. , Warner, K. , Xu, B. , Yang, J. , Yin, Y. , Yu, C. , Zhang, Q. , Gong, P. , Montgomery, H. , & Costello, A. (2015). Health and climate change: Policy responses to protect public health. Lancet, 386(10006), 1861–1914. 10.1016/S0140-6736(15)60854-6 [DOI] [PubMed] [Google Scholar]
- WHO (2018). World Health Organization: Climate change and human health. https://www.who.int/globalchange/global-campaign/cop21/en/
- Zwiers, F. W. , & Von Storch, H. (1995). Taking serial correlation into account in tests of the mean. Journal of Climate, 8(2), 336–351. [Google Scholar]