

Abstract
Rotavirus is the most common cause of diarrheal disease among children under 5. Especially in South Asia, rotavirus remains the leading cause of mortality in children due to diarrhea. As climatic extremes and safe water availability significantly influence diarrheal disease impacts in human populations, hydroclimatic information can be a potential tool for disease preparedness. In this study, we conducted a multivariate temporal and spatial assessment of 34 climate indices calculated from ground and satellite Earth observations to examine the role of temperature and rainfall extremes on the seasonality of rotavirus transmission in Bangladesh. We extracted rainfall data from the Global Precipitation Measurement and temperature data from the Moderate Resolution Imaging Spectroradiometer sensors to validate the analyses and explore the potential of a satellite‐based seasonal forecasting model. Our analyses found that the number of rainy days and nighttime temperature range from 16°C to 21°C are particularly influential on the winter transmission cycle of rotavirus. The lower number of wet days with suitable cold temperatures for an extended time accelerates the onset and intensity of the outbreaks. Temporal analysis over Dhaka also suggested that water logging during monsoon precipitation influences rotavirus outbreaks during a summer transmission cycle. The proposed model shows lag components, which allowed us to forecast the disease outbreaks 1 to 2 months in advance. The satellite data‐driven forecasts also effectively captured the increased vulnerability of dry‐cold regions of the country, compared to the wet‐warm regions.
Keywords: rotavirus, climate, diarrhea, extremes, forecasting, remote sensing
Key Points
Rotavirus shows strong mortality and morbidity, as well as strong spatial and temporal variability in South Asia
Strong winter and weak monsoon transmission cycles dominate South Asia, modulated by regional climatic extremes
Satellite‐derived hydroclimatic information has potential to help forecasting of rotavirus risk over Bengal Delta
1. Introduction
Living in the age of satellites and nanotechnology, a significant fraction of the global human population is still threatened by diarrheal diseases. A major contributor to global mortality and morbidity, diarrheal diseases account for an estimated 3.1% of the total burden of diseases in terms of disability‐adjusted life year and 1.3 million deaths annually, including a majority of children under five years (Troeger et al., 2017; World Health Organization (WHO), 2014). For example, one of the most infectious and fatal diarrheal diseases, rotavirus accounts for about one third of the diarrheal burden in South Asia (Kazi et al., 2014; Siddique et al., 2011). Yet there is much room for improvement in understanding the underlying processes and the assessment of diarrheal disease risk over vulnerable regions (Akanda et al., 2014).
The transmissions of these diseases both at endemic and epidemic scales are primarily due to insufficient safe water access, inadequate sanitation and drainage infrastructures, and poor access to health care compounded by natural disasters or social upheavals. However, the development of water, sanitation, and health infrastructures as a solution to intervene in the disease pathway requires a long time frame and continuous financial commitment (Hutton & Bartram, 2008). Many developing countries failed to meet the 2015 Millennium Development Goals set by the United Nations in 2000, predominantly in the sanitation sectors. As the global community transitions from the Millennium Development Goals to the Agenda 2030 Sustainable Development Goals, the need to monitor and track the impact and progress of the global prevention efforts has become vital (H. Wang et al., 2016).
Recent studies indicate that hydrologic processes and climatic variability strongly influence the outbreak of these diseases (Akanda et al., 2013; Bandyopadhyay et al., 2012; Gurarie & Seto, 2009; Jutla et al., 2015; Remais et al., 2008). Moreover, the risk posed of the diarrheal diseases and uncertainty of the impacts are increasing under ongoing climate change (Maantay & Becker, 2012). Thus, innovative ways of advancing surveillance efforts to assess baseline conditions and strengthening health efforts through identifying disease hot spots in vulnerable regions are a critical need (Akanda et al., 2014). Here we focus on rotavirus diarrhea as it has one of the highest number of diarrhea‐related mortalities in children younger than 5 years of age, globally (WHO, 2011).
Most studies have explored the influence on rotavirus transmission for particular climatic extreme or related natural disasters, but the integration of multiple variables with disease cases has been limited. Martinez et al. (2016) explored the effect of flood and rainfall on rotavirus transmission of Dhaka, where the importance of multiple extremes was pointed out. Moors et al. (2013) integrated several climatic effects to explain the pattern of diarrheal disease outbreaks over India; however, a deterministic quantification of the diseases based on the climatic effects was absent. Jagai et al. (2012) has conducted a meta‐analysis of rotavirus over South Asia but did not consider the climate extremes. Accurate identification of climatic events is also important for disease modeling. For example, water logging causes diarrheal outbreaks in many parts of the world after consecutive rainfall for several days. Due to the combined effect of heavy intensive rainfall‐runoff and inefficient drainage systems, flood waters flow into low lying areas, causing water logging (Tawhid, 2004). These areas help to connect the fecal‐oral route of the disease transmission cycle through continued use of these interconnected and infected water bodies. As a result, diarrheal outbreaks spread from one locality to another (Bhavnani et al., 2014). Thus, evaluating the disease outbreak with extreme rainfall intensity but without considering the cumulative impact of consecutive rainy days left gaps in the understanding. Moreover, specific temperature conditions during daytime or nighttime could also influence pathogen survivability (Lambrechts et al., 2011). Therefore, the relationships of specific climate phenomena with rotavirus need to be explored in more detail.
The development of satellite technologies and proliferation of Earth observation data sets in recent years has enabled collection and analyses of hydroclimatic information from all over the globe in unprecedented time (Brown et al., 2013; Emamifar et al., 2013; Hou et al., 2014). The satellites not only provide advanced knowledge of environmental variables, but also high‐resolution spatial and temporal information. Most of these data products are available freely within 6 h to 1 week intervals after their acquisition. For example, the Global Precipitation Measuring (GPM) mission can provide rainfall information every 30 min with a 0.1° spatial resolution, globally (Huffman et al., 2015). The Tropical Rainfall Measuring Mission (TRMM) data are another widely evaluated satellite data and have shown strong performance in detecting rainfall in various applications (Kummerow et al., 1998). Similarly, the Moderate Resolution Imaging Spectroradiometer (MODIS) land surface data product can provide daily temperature data at 1 km spatial resolution (Pagano & Durham, 1993). These data sets not only improve data acquisition intervals compared to station data but also provide more spatial information in a near‐real‐time basis.
With establishment of the links between diarrheal diseases and new‐generation Earth data, including satellite observations, there is a great potential to develop models for disease prediction at higher spatial and temporal resolutions. Such systems are especially crucial in developing countries, where the population faces a massive burden of rotavirus‐related mortality and morbidity each year. Bangladesh, a South Asian country with an emerging economy, still suffers a heavy toll every year due to rotavirus. In this study, we have explored the effect of climatic extremes on the rotavirus infection cycle in Bangladesh both spatially and temporally. We have evaluated rotavirus patterns over several cities inside the country and across South Asia to understand the larger context in relation to regional hydroclimatic processes. We also implemented a deterministic multivariate modeling for risk assessment and integrating near‐real‐time satellite products (with GPM for rainfall and MODIS for temperature).
2. Methodology
2.1. Study Area
A robust epidemiologic assessment of rotavirus diarrheal outbreak with climate requires a sufficiently long time series and good spatial coverage of disease data. Unfortunately, only few places in South Asia have such information. Located in the fast growing megacity of Dhaka, the International Centre for Diarrheal Disease Research, Bangladesh (ICDDR,B) has published rotavirus surveillance data since 2003, thus providing an opportunity to explore the relationship between the disease and regional climate. As ICDDR,B conducts surveillance over the metropolitan city of Dhaka, we have selected the city as our primary study area. Dhaka is the capital city of Bangladesh with a population of nearly 14 million, and immensely vulnerable to rotavirus diarrhea. Situated in the tropical zone, the city has a warm climate dominated by monsoon dynamics. The average temperature of city is usually high (~28°C–30°C) during April through October and relatively low (~20°C–22°C) from November through February. We have also incorporated data from five other cities of Bangladesh, namely, Rajshahi, Kishoreganj, Sylhet, Barisal, and Chittagong for this study. In addition, we have included data from three more cities of South Asia: Delhi, Kathmandu, and Thimpu, for a wider spatial assessment. The cities are all located in the tropical monsoon region, and rotavirus is endemic in all of those (Mullick et al., 2014; Sherchand et al., 2009; Shetty et al., 2017; Wangchuk et al., 2015) (Figure 1).
Figure 1.

The location of the rotavirus prevalent cities of South Asia. The cities with green dots were selected for the spatial analysis.
2.2. Disease Data
The cases of rotavirus incidences over Dhaka were obtained from the hospital‐based surveillance system of ICDDR,B over a period from January 2003 to May 2015. The ICDDR,B Centre for Health and Population Research runs an urban hospital situated in Kamalapur, Dhaka, where more than 100,000 patients are treated for diarrhea each year. At the hospital, cholera as well as rotavirus surveillance are conducted regularly; stool samples are collected to determine the presence of enteric pathogens in every 50th (2%) patient attending the hospital for treatment of diarrhea. From the hospital surveillance reports, information on monthly rotavirus isolates were summarized and a time series was formulated.
The rotavirus data from other cities within Bangladesh were collected from the national surveillance campaign of the Institute of Epidemiology, Disease Control and Research (IEDCR). The cities within Bangladesh resemble similar demographic and climatic patterns. Bangladesh; this is the only available spatial data set with the same temporal length, to the best of our knowledge. Therefore, we have selected the surveillance data (January 2013 to December 2015) of these cities in the analysis. The rotavirus information for Delhi, Kathmandu, and Thimpu were gathered from secondary literature, where the data sets range from 2005 to 2013 (Mullick et al., 2014; Sherchand et al., 2009; Shetty et al., 2017; Wangchuk et al., 2015). However, each city has only about 2 years of reliable data and distributed over different time periods. Thus, the disease outbreak information of these cities was avoided in the main analysis and was only utilized to validate the larger spatiotemporal rotavirus pattern in South Asia.
2.3. Weather Data
We obtained daily maximum (TMax) and minimum temperatures (TMin), and precipitation data for Dhaka from the Bangladesh Meteorological Department (BMD) for the period 2000 to 2014. We collected climatologic records for other cities from The Global Historical Climatology Network‐Daily (GHCN‐Daily), version 3, from January 2013 to December 2016 (Menne et al., 2012). Homogeneity and quality control tests were conducted to ensure the removal of outliers. The tests were carried out using the RHtestsV4 software package, which was developed by the joint CCl/CLIVAR/JCOMM Expert Team on Climate Change Detection and Indices (ETCCDI) (X. L. Wang & Feng, 2013).
For detecting spatial variability, we utilized two types of satellites data products in this study. The Global Precipitation Measurement (GPM) data were used as the source of the satellite precipitation, collected from March 2015 to December 2015. The GPM mission is an international network of satellites that provides the next‐generation global observations of rain and snow (Hou et al., 2014). We also utilized an additional satellite‐derived rainfall data set from the Tropical Rainfall Measuring Mission (TRMM) for validation purposes. Among the various products that are available, we used the TRMM3b42v7 version with a spatial resolution of 0.25° × 0.25° and a temporal resolution of 3 h. A global land surface temperature data product was acquired from the Moderate Resolution Imaging Spectroradiometer (MODIS)‐Aqua satellite (MYD11A1.005 version) for both day and night temperatures at a 1 km spatial resolution.
2.4. Method
Our study approach can be separated into three sections: temporal assessment, spatial analysis, and multivariate modeling and validation with satellite data.
A robust analysis of the hydroclimatic influence on the transmission cycle of a disease requires specific climate realizations. For example, the mean or maximum state of a monthly temperature may not directly influence a disease outbreak, but a specific temperature range or consecutive rainfall events can trigger an epidemic. Therefore, for a comprehensive examination of environmental drivers on rotavirus diarrhea, we selected 36 climate indices based on various properties of weather events (Table 1). We either applied or adopted the climate indices from the Expert Team on Climate Change Detection and Indices (ETCCDI) Peterson (2005). These indices were used in various climate studies to analyze the extremity of the climatic phenomenon (Alexander, 2015; Hasan et al., 2017; Keggenhoff et al., 2015). The selections of the indices in those studies were conducted based on particular objectives of individual studies. In this case, we selected the indices that are most relevant to rotavirus transmission dynamics.
Table 1.
Description of Climate Index Parameters
| Name (number of indices that represented) | Description | Types of indices |
|---|---|---|
| Tmin (1) | Average daily minimum temperature of a month. | Temperature |
| Tmax (1) | Average daily maximum temperature of a month. | Temperature |
| Tx10 / Tx90 (2) | Number of days in a month when TMax <10th percentileg/when Tmax >90th percentileg. | Temperature |
| Tn10 / Tn90 (2) | Number of days in a month when TMin <10th percentileg/when TMin >90th percentileg. | Temperature |
| SU (1) | Number of days in a month when TMax >25°C. | Temperature |
| TR (1) | Number of days in a month when TMin >20°C. | Temperature |
| DTR (1) | Monthly mean difference between TX and TN. | Temperature |
| TxijGE (4) | Number of days in a month when TMax is in between i °C and j °C., where, i = {26,29,33,26} and j = {28,32,35,32}a | Temperature |
| TnijGE (4) | Number of days in a month when TMin is in between i and j °C., where, i = {16,19,22,16} and j = {18,21,25,21}b | Temperature |
| SDII (1) | Intensity of rainfall in a month (in mm/d) | Precipitation |
| CRm (4) | Highest number of consecutive m mm rainfall events in a month, where, m = 1, 5, 10, 20 c | Precipitation |
| CRnS3 (2) | Number of 3‐days or more storm with rainfall > n mm where, n = 1,5 d | Precipitation |
| CRnDf (4) | Number of rainfall events in a month with rainfall > n mm for f days where, n = 1,5 and f = 4,5 e | Precipitation |
| PRECIPTOT (1) | Total amount of rainfall in a month. (in mm) | Precipitation |
| RRj (5) | Number of rainy days with j mm or more rainfall, where, j = 1, 5, 10, 20,70. f | Precipitation |
| Rx1 / Rx5 (2) | Maximum amount of 1 day/5 day rainfall in a month | Precipitation |
For example, when i = 26 and j = 28, name of index would be Tx2628GE: The number of days in a month when Tmax is between 26°C to 28°C.
For example, when i = 16 and j = 18, name of index would be Tn1618GE: The number of days in a month when Tmin is between 16°C to 18°C.
For example, when m = 1 and j = 28, name of index would be CR1: Highest number of 1 mm rainfall events in a month.
For example, when n = 1, name of index would be CR1S3: Number of 3 days or more storm with rainfall greater than 1 mm.
For example, when n = 1 and f = 4, name of index would be CR1D4: Number of rainfall in a month that greater than 1 mm for 4 days.
For example, when j = 1, name of index would be RR1: Number of rainy days with 1 mm or more rainfall.
Percentile are calculated based on 10 year baseline period of 2003 to 2013.
In Table 1, we have defined the indices based on extremity, intensity, duration, and magnitude of climate variables to capture the whole spectrum of short‐scale weather phenomenon. The average day or night temperatures and their variations in a month were defined by TMax, Tmin, and DTR indices. For TxijGE and TnijGE, we categorized the mean monthly range of TMax and Tmin into 3°C intervals to understand the seasonal effects of various temperature range on rotavirus infections. During an annual cycle, the mean (monthly) TMax and TMin vary about 9°C over the region (Islam & Hasan, 2012). Therefore, we selected 3°C as threshold interval to classify 9°C temperature range for developing TxijGE and TnijGE indices. As the minimum monthly DTR of Bangladesh is 6°C, we selected half of that (which is 3°C) to capture the temperature effect in both day and night (Islam & Hasan, 2012). Any threshold interval lower than 3°C will result in redundant indices. On the other hand, any threshold interval higher than 3°C will plausibly miss the variation of temperature that can influence rotavirus. The duration of hot or cold days based on a particular threshold were described by the rest of temperature indices (i.e., Tn10 and Tx90).
In case of rainfall, intensity and amount were characterized with SDII and PRECIPTOT. The magnitude of rainfall was described with Rx1and Rx5 indices. The durations of various kinds of storms were classified using the rest of the precipitation indices. However, among all the indices, many are season specific and have interdependency among them. On this ground, we categorized the indices into two seasons; October to April as the dry winter season and July to September as the wet monsoon season. The indices that have 60% or more zero values were dropped, and eventually, we concluded with 22 and 28 indices among 36 indices for winter and monsoon seasons, respectively. For example, we did not select Tn1618GE for the monsoon season. As days with minimum temperature range of 16 to 18 ° will be zero for monsoon months, any correlation value between rotavirus and Tn1618 will result in misleading information. Therefore, some indices were dropped from the pool of 36 indices, when we conducted the season‐specific analysis. All the indices for temporal and spatial analysis are generated from BMD observed data, where the validation analysis of the indices is generated with daily satellite data.
Evaluating spatial risk of a disease can be modeled with existing stochastic methods like the Bayesian approach (Cheng & Berry, 2013), Monte Carlo simulations (Prosser et al., 2016), or Susceptible‐Infectious‐Recovered (Grassly & Fraser, 2008) models. While the stochastic methods are useful to capture probable spatial patterns of diseases transmission, the complexity of the methods sometimes misses the deterministic influence of a particular driver. As the goal of our paper is to evaluate the influences of climate indices on rotavirus diarrhea, we utilized a deterministic model to formulate the risk of the disease and avoided the population effect. In the process to eliminate the influence of population, we standardized and scaled the disease cases for each of the selected cities and combined the disease cases into a single series of the same time frame (January 2013 to June 2015) to conduct spatial analysis. The standardization method was adopted from Jagai et al. (2012), where we considered our scaled values as z‐scores of rotavirus risk. As a result of removing the effect of population, the analysis thus represents the severity of disease cycle rather than actual cases of diseases. Any value that exceeds 1 is considered as an outbreak.
From selected climate indices, we conducted a univariate correlation analysis considering three levels of relationships in each season. In the first level, we considered lag relationships of indices with rotavirus cases. In the next level, we considered 1 and 2 months moving average of rotavirus infections, and in the final level, we considered a cross correlation of moving average and lags. In all three levels, we examined the two seasonal periods both temporally and spatially. As rotavirus outbreaks are more prevalent during winter seasons (supportive analyses related to the phenomenon are provided in the results section), we have examined the winter cycle in more detail. For the winter season, the evaluation of the transmission cycle was conducted into three phases: the rising, the peak, and the falling phase. A descriptive definition of the phases is presented in the results section. From the spatial and temporal correlations, the most influential climate relationships were identified and utilized in multivariate regression modeling.
From the correlation assessment, we generated a deterministic model that can project the risk of rotavirus based on climate indices. The model was composed of the selected three‐phase winter cycle that can quantify the rotavirus outbreak from the influence of climatic factors. Finally, the model was utilized to forecast disease outbreaks using precipitation data from GPM and temperature data from MODIS sensors. As the data of GPM satellite are available from 2015, we performed validation of the model for October 2015 and November 2015, during the dominant winter transmission cycle. As our results showed that the climate indices influence only the winter cycle significantly in all selected cities of Bangladesh, we selected the winter cycle for validation purposes. On the other hand, as the disease data for all cities are available up to December 2015 (during the time of this study), we were only able to validate the rising phase of the winter transmission cycle using satellite data. As rotavirus data from several regions were available for 2 years only, we were unable to utilize data before 2013 or beyond 2015 for spatial validation. However, to demonstrate the spatial capability of our model, we utilized TRMM data in conjunction with MODIS for formulating spatial risk maps of rotavirus for the 2014 winter season.
3. Results
3.1. Seasonal Characteristics of Rotavirus in South Asia
In this section, we discuss the general spatiotemporal pattern of rotavirus outbreaks seen in several South Asian cities. Annual rotavirus cycles over South Asia are presented in Figure 2a. December and January are the peak months of the outbreak for the Bangladeshi cities, with the exception of Sylhet. Thimpu of Bhutan experiences the peak in a postwinter month (March) where Delhi experiences the peak earlier than Bangladeshi cities. Similar to Dhaka, Kathmandu also experiences the annual peak during the month of December. Among the cities of South Asia, a monsoon outbreak is observed (smaller relative to the winter outbreak) in Delhi (population ~19 million) and Dhaka (population ~14 million), where both cities have a much higher population compared to other selected cities (World Population Review, 2017).
Figure 2.

(a) Annual monthly rotavirus outbreaks over South Asian cities. (b) Z‐score of rotavirus over Dhaka from 2003 to 2015. (c) Autocorrelation function of rotavirus in the city of Dhaka from 2003 to 2015.
The rotavirus endemic cycle exhibits significant seasonal variability over South Asia (Figure 2a). The dominant cycle starts in October, reaches its peak in January, and is followed by a recession phase in February and March. The autocorrelation analysis over Dhaka for the original monthly time series validates the presence of the dominant winter cycle. In Figure 2c, the monthly autocorrelation function shows the presence of the strong annual winter peak. The autocorrelation figure also suggests a weaker outbreak during the monsoon season, typically during July, August, and September. The z‐score of the rotavirus over Dhaka also supports similar findings, where, as in 2004, the monsoon magnitude of rotavirus was higher than that of the winter (Figure 2b).
Characteristics of rotavirus incidences over Dhaka were analyzed following a 13 year time series data set (2003–2015) (Figure 2b). Rotavirus outbreaks during the winter of 2008, 2011, and 2012 were the most intense in recent history. Typically, rotavirus incidence becomes the highest during January, but some exceptions were observed during March 2009 and July 2004. In most years, the lowest incident rate of rotavirus diarrhea was observed during May. However, in 2012 and 2014, the lowest incidences were observed in August.
In this analysis, we calculated temporal correlation only over Dhaka and not the other cities due to lack of data availability (the disease data of other cities starts from 2012). Among the precipitation indicators over the city, RR1 was found to be one of the influential indicators on rotavirus. The correlation analysis suggests (Figure 3a) that a decrease in RR1 in September affects the winter rotavirus cycle especially for the month of November. The secondary outbreak during the July, August, and September is affected by the number of days with rainfall events of 70 mm or more (RR70) (Figure 3b). However, both the rotavirus cases and RR70 were higher during the 2007 floods over the city.
Figure 3.
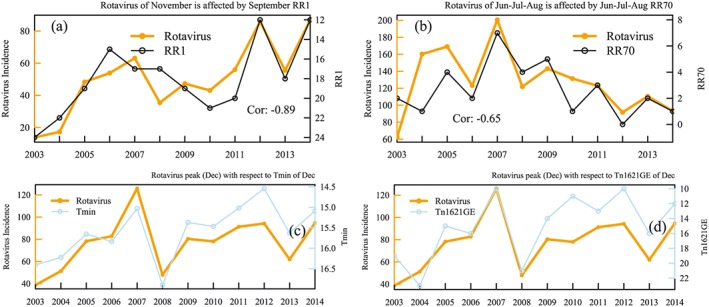
(a) Rotavirus incidence for the month of November with RR1 of September (the y axis is plotted in reverse order); (b) rotavirus of June‐July‐August with RR70 of June‐July‐August. (c) Rotavirus incidence for the month of December with Tmin (left) and (d) Tn1621GE (right) of same month (the y axis of the indices are plotted in reverse order).
3.2. Univariate Correlation Between Climate Indices and Rotavirus
To assess the effect of individual climate variables and indices on rotavirus transmission, we conducted univariate analysis considering moving average and lag of related variables. The correlations for the winter and monsoon seasons are presented in Figure 4.
Figure 4.

(a) Temporal correlation of rotavirus in winter months over Dhaka from January 2003 to May 2015 and (b) spatial correlation of rotavirus in winter months over six cites of Bangladesh from July 2012 to May 2015. (c) Temporal correlation of rotavirus in monsoon months over Dhaka from January 2003 to May 2015 and (d) spatial correlation of rotavirus in monsoon months over six cites of Bangladesh from July 2012 to May 2015.
During the winter season, rotavirus outbreak in Dhaka shows a strong negative lag relation (1 month) with the selected rainfall‐related indices (Figure 4a). In case of other cities (Figure 4b), the same indices show significant but lower correlation values. Unlike Dhaka, the correlations of indices in other cities do not exhibit any substantial lag effect. Thus, we can say that the low duration of rainfall events seems to be an influential driver for the season, where the effects come with a delay (1 month) over Dhaka compared to other places. The temperature indices related to the colder spells strongly impact the winter epidemics in both spatial and temporal analyses. However, the spatial correlations are weaker than the temporal values in both types of indices, probable due to the varying rainfall patterns between the six locations. The temperature indices that display the strongest correlation (0.5 or more) are Tmax, Tmin, Tn1621GE (number of nights with temperature between 16°C and 21°C), and Tn1921GE (number of nights with temperature between 19°C and 21°C). All these indicators confirm the effect of colder temperatures on the rotavirus cycle similar to Atchison et al. (2010).
During the monsoon season, the temporal investigation of rotavirus indicates significant correlation with all rainfall indices where such relationships are absent in the spatial assessment (Figures 4c and 4d). The outcome is expected, as the secondary monsoon outbreak and its impacts are most profound in Dhaka among the six selected cities of Bangladesh (Figure 4a). Tn2225GE significantly correlates with 2 month lag rotavirus outbreak, which is the strongest relationship among the indices. The relationship suggests that a night temperature range of 22°C to 25°C has a potent role in the monsoon cycle of rotavirus over Dhaka.
From Figures 2 and 4, it is evident that the winter cycle of rotavirus is more prominent than the monsoon cycle over the study region and is strongly influenced by climatic factors. Thus, we focused the investigation on the winter epidemic for the rest of the study. For a detailed understanding of the winter cycle, we characterized it into three phases: rising, peak, and falling phases. The rotavirus outbreak starts to appear during the months of October and November, thus can be classified as the “rising” phase. As the cycle typically reaches its “peak” during the months of December, January, and February, we considered it as the “peak” phase. From February to April, the cycle enters in its recession phase; therefore, this phase was defined as the “falling” phase. Based on the three phases, we conducted two levels of correlation analysis as described previously between rotavirus cases and climate indices. As temperature and precipitation indices have dependency among them, many indices show similar correlation in particular phases. Therefore, to make a concise judgment, we presented only the most significant correlation for each phase of the epidemic cycle in Table 2.
Table 2.
The Spatial and Temporal Correlations Between Climatic Indices and the Three Phases of the Winter Rotavirus Epidemic
| Rising phase (October‐November) | Peak phase (December‐January‐February) | Falling phase (January‐February‐March‐April) | ||||||||||
|---|---|---|---|---|---|---|---|---|---|---|---|---|
| Index name | Correlation | Lag from outbreak | Monthly assumption of moving average | Index name | Correlation | Lag from outbreak | Monthly assumption of moving average | Index name | Correlation | Lag from outbreak | Monthly assumption of moving average | |
| Spatial | SU | −0.58 | 2 | 1 | SU | −0.64 | 0 | 2 | Tn1621GE | −0.45 | 1 | 2 |
| RR1 a | −0.48 | 1 | 2 | Tmax | −0.57 | 0 | 2 | Tx10 | 0.62 | 0 | 1 | |
| Tn1621GE | 0.61 | 1 | 1 | Tx10 | −0.52 | 2 | 2 | RR1 | −0.61 | 1 | 2 | |
| Tn1921GE | 0.68 | 1 | 1 | Rx1 | −0.47 | 0 | 2 | Tmin | −0.62 | 0 | 1 | |
| Temporal | Tn1621GE | 0.51 | 1 | 1 | Tn1621GE | −0.44 | 0 | 2 | RR5 | −0.7 | 0 | 2 |
| RR1 | −0.69 | 2 | 2 | Tn1621GE | −0.43 | 0 | 1 | RR1 | −0.69 | 0 | 2 | |
| RR5 | −0.69 | 2 | 2 | PRECIPTOT | −0.66 | 0 | 2 | |||||
| Tx2932GE | −0.61 | 2 | 1 | DTR | 0.73 | 0 | 2 | |||||
The bold indices are common in all three phases.
The rising phase of rotavirus cycle has significant influence by the night temperature as Tn1621GE shows spatial and temporal correlation of 0.61 and 0.51, respectively. The lower number of 25 ° days (SU) was found to be influential on the spatial scale, where Tx2932GE also represented a similar message in the temporal scale. Number of rainy days (RR1) is strongly correlated (negatively) with rotavirus cases in both tests, more so for the onset of the epidemics in Dhaka. The rising phase of Dhaka is influenced by 2 month prior RR1, where the same index in other cities exhibits a no‐lag relation. This analysis suggests that the dry and cold days in fall are potential drivers for the start of outbreak, where the timing of rainfall deviates the timing of outbreak from place to place. During the peak phase, both the number of hot days (SU) and Tmax shows negative correlation spatially. Therefore, the relationship suggests that the upper temperature threshold of cold days or nights affects the rotavirus magnitude in the peek phase. The values of the rainfall indices (except PRECIPTOT) during the peak are close to zero; thus, any significant correlation of these indices will be misleading. Hence, we avoided such values in conferring our results. During the falling phase as well, RR1 plays an influential negative role on the rotavirus cycle. Both temporal and spatial time series exhibits correlation of −0.61 and −0.69, respectively. However, the temporal correlations show no lag compared to the spatial correlations of the six cities during the phase. Tx10 and DTR demonstrated the strongest association with rotavirus in the temporal and spatial scales, respectively. Similar to the rising phase, the falling phase shows strong connections with dryness and demonstrates variability in the timing of the infections depending on the location.
The synthesis of the analyses revealed that Tn1621GE and RR1 are commonly correlated during the rising and falling phases, both temporally and spatially (Table 2). The longest time series for Dhaka cases also disclose the significant relationship of Tn1621GE at the winter peak. On that account, we can say that a specified night temperature range with dry weather is a prominent force to the spread of the disease during the winter.
The assessment between three selected phases of the rotavirus winter cycle confers the effect of climate more strongly in the rising and falling phases rather than peak phase. Therefore, to achieve more clarity, we conducted a moving average analysis of 1, 2, and 3 months between indices and rotavirus. The month‐wise temporal analysis indicates a strong correlation of −0.81 between Tn1621GE and rotavirus cases during the peak month (December). Tmin also showed a robust correlation (−0.84) with same month's epidemic cycle (Figure 3). The consistent pattern of the two indices with rotavirus cycle from 2003 to 2014 confirms the relationship in Figure 3. It should be noted here that the values of Tmin during this period varied between 14.5°C and 16.5°C (only 2°C). Such small changes in temperature variation can be misleading regarding the effect of a minimum temperature.
The month‐wise correlation analysis for the individual cities would be statistically insignificant, as a common data period between the six cities are only available for approximately 3 years (for a seasonal analysis, it will generate three points in three years). In this case, we considered two of the most influential variables of the winter cycle: Tn1621GE and RR1, and compared them with rotavirus proportions of these cities in Figure 5. Both of the indices reflect an ensuing pattern with rotavirus cases in six selected cities of South Asia. Between the observed dual cycles of Tn1621GE, the first cycle tends to trigger the rotavirus peak in same month in the Sylhet area. Similarly, the same cycle of Tn1621GE of Mymensingh has influence on the next month's rotavirus cases. In case of Rajshahi, the same cycle shows a 2 month lag relation instead of one. Moreover, the rotavirus peak also follows distinct patterns with RR1 or rainy days. In case of Barisal and Sylhet, the peak of rotavirus occurs during the driest month (or lowest RR1) without showing any lag. Over Rajshahi, this relationship extends for a 2 month lag. This variation in lag for both indices explains why there is no significant relationship found during the peak phase (Table 2) in the spatial analysis.
Figure 5.

The rotavirus cycle in the six selected cities with compared to RR1 and Tn1621GE from June 2012 to May 2015.
3.3. Multivariate Assessment
From the univariate analysis, we identified the RR1 and Tn1621GE as the most influencing variables on the winter rotavirus cycle. Using these climatic indices, we developed a multivariate regression model for evaluating the winter cycle. As the indices pose different correlation values in explaining the transmission process in different phases, we conducted three separate multivariate models for the three phases of the cycle and combined them into a single model. As we explored the spearman rank correlation values, we also incorporated nonlinear relationship between the indices and rotavirus cases. For checking the distribution of the response (response here is z‐score of rotavirus) variable of the model, we conducted Shapiro‐Wilk (Shapiro & Wilk, 1972) and Kolmogrorov‐Sminov (Massey, 1951) tests. The tests confirm that the response variable follow a gamma distribution and rejects the null hypothesis of normality. Considering the gamma distribution, we generated optimized models with the most dominant climate indices by utilizing both linear and nonlinear regression. We selected the best model for each phase of the cycle by evaluating the Akaike information criterion. The combined model from the three individual phases is presented in equation (1).
| (1) |
The subscript of RR1 and Tn1621GE refers their respective month's value in the equation. The “m,” “n,” and “o” represent the values for month of October‐November‐December and January‐February‐March, respectively. X is the scaled z‐score of rotavirus for any selected month of the winter cycle. The R value of the equation is 0.67, referring to one third of the explained variance for the whole transmission cycle. The result is higher than the previously reported climatic influence on rotavirus over South Asia (Jagai et al., 2012).
Using the formulated model, we can forecast rotavirus prevalence all over Bangladesh with localized climatic indices. In this context, based on the reported results of this study, reliable real‐time information of RR1 and Tn1621GE can give advance information 1 to 2 months prior to the occurrence of an impending outbreak. To calculate near‐real‐time RR1 and Tn1621GE, we utilized GPM daily precipitation data and MODIS temperature data. Magnitude of GPM rainfall products poses a magnitude bias with observed daily rainfall. However, for 1 mm rainy days in a month (RR1), the GPM data provide same value as in situ observed (BMD) data from June 2015 to December 2015. In case of MODIS land surface temperature data, we replaced the missing values in night temperature with GHCN data to formulate a complete Tn1621GE time series over the selected cities.
The calculated indices from GPM and MODIS are inserted in equation (1) to validate the model results for October and November 2015. Figure 6 shows the spatial prevalence of observed and model estimated rotavirus over Bangladesh. For October, the eastern parts of the country largely agree with the observed disease incidences, where magnitude slightly deviates. In case of November, the observed patterns are well captured by the model; however, magnitude deviates over the Barisal and Rajshahi regions. We also presented the potential of using TRMM satellite with MODIS data sets (Figure 7) to predict disease risk over the focus region. Figure 7 shows the October and November outbreaks from model and observed data during 2014. The TRMM‐derived disease map is able to capture the pattern better than GPM‐derived product. However, it should be noted that 2014 winter data are also utilized in model formulation; thus, it cannot be considered as a validation result.
Figure 6.

Spatial distribution of the observed (left) and model‐estimated (right, GPM + MODIS) z‐score of rotavirus incidence for (a and b) October and (c and d) November 2015.
Figure 7.

Spatial distribution of the observed (left) and model‐estimated (right, TRMM + MODIS) z‐score of rotavirus incidence for (a and b) October and (c and d) November 2014.
4. Discussion
Our initial assessment infers that the rotavirus cycle is strongly influenced by the dry and cold winter season climate in Dhaka. In Great Britain, Atchison et al. (2010) explored the temperature dependence of rotavirus and conferred that above the 5°C threshold, an increase of the average temperature decreased the infection rate of the disease. A similar understanding was also found in Australia (D'Souza et al., 2008), where rotavirus diarrhea admissions are associated with lower temperatures and lower humidity. Although these two studies were conducted in different climatic zones altogether, we believe that the dearth of overall number of studies links rotavirus with climatic indices, these findings are still important evidences toward the influence of temperature on rotavirus incidence. In South Asia, Jagai et al. (2012) also showed that the reduction in annual temperature and precipitation increases the level of infections of rotavirus, supporting our findings.
As our assessment separated the time frame into two seasonal cycles, the correlation from winter cycle over all six selected cities strengthens the findings of previous studies. However, we also found significant positive association of rotavirus infections during monsoon over Dhaka. Dhaka is a densely populated city with a high number of informal settlements, or slums, with poor water and sanitation conditions (Akanda & Hossain, 2012). As rotavirus pathogens can be transmitted through the fecal oral route, high precipitation events can create water logging and eventually connects to the pathogen transmission pathways (Dennehy, 2000). Thus, Dhaka experienced an additional monsoon outbreak compared to other cities and the outbreak may be influenced by heavy rainfall events. Such phenomena also clarify why the monsoon indicators showed insignificant relationships with rotavirus in other cities. Dhaka typically observes the annual highest rotavirus incidence during January, but some exceptions were observed during March 2009 and July 2004 (Figure 2b). The 2004 flood event was one of the most devastating floods in the last decade in Bangladesh (Schwartz et al., 2006). Floods connect the fecal oral transmission route of the disease thus results unusual outbreak (Levy et al., 2009). In many years, the lowest incident rate of rotavirus diarrhea was observed during May. However, in 2012 and 2014, the cycle reached its lowest crest during August. In 2012 and 2014, medium flooding happened in outskirts of Dhaka, which might act as the hindering phenomenon of rotavirus outbreaks (FFWC, 2012, 2014). Dhaka experienced one of the highest rotavirus outbreaks during the flood of 2007 (Figure 2b). Our analysis showed that the outbreak was correlated to extreme rainfall events (RR70), a potential indicator of floods. During the floods of 2007, there was a massive outbreak of diarrheal diseases in Dhaka including cholera, rotavirus, and dysentery (Cash et al., 2014; Harris et al., 2008; Hashizume et al., 2008).
Our study also provides some detailed assessment of the winter rotavirus cycle. We found that the rising phase of rotavirus is negatively correlated with SU or Tx2532GE, which represents the amount of warm days in month. As the virus prefers low‐temperature environments, the lower number of warm days eventually helps to initiate the spread of the disease. Previous studies indicated that the virus can be active in the environment for up to 4 weeks or 1 month without a host body (Levy et al., 2009). Therefore, reduction of warm days may increase the rotavirus sensitivity and the effect can be delayed up to 1 month. Our findings also suggest that the beginning of the winter cycle (October–November) is highly correlated with RR1 and Tn1621GE, both spatially and temporally. Average night temperature during September–October are 25°C. As Tn1621GE represents the night temperature of 16°C to 21°C, some nights in September start to experience temperatures below 21°C. Therefore, the index can be reflected as colder nights of that month. In a laboratory test, rotavirus was found to be active for several days in 4°C and 20°C temperatures without human contact (Moe & Shirley, 1982). In aerosol, the virus is also infectious in low temperatures (Moe & Harper, 1983). Therefore, higher values of Tn1621GE, which act as cold nights during September–October, may promote the infectivity of rotavirus up to a 4 week delay.
On the other hand, the RR1 index represents the number of wet days in a month rather than magnitude or intensity of rainfall events. As rotavirus transmission can be driven with air, reduction of rainfall may raise the propensity of aerial transport (Ansari et al., 1991) of contaminated fecal matter. Therefore, RR1 can be considered a barrier to airborne transport of rotavirus. Consequentially, the joint effect of RR1 and Tn1621GE triggers the 1 month delayed outbreak during the rising phase of the winter cycle. During the peak month of rotavirus in December, RR1 becomes nearly zero over Dhaka, thus allowing aerial transport of the virus to its highest potential. In this phase, the correlation with Tn1621GE shifts from positive to negative. During the month of December, the average nighttime temperature also drops below 21°C. Such a drop of night temperature transforms the Tn1621GE index to a representative of a warm night, as temperatures can be higher than 21°C during this month. As Atchison et al. (2010) and Cunliffe et al. (1998) both referred, lower temperatures can increase the infection rate of rotavirus; higher number of Tn1621GE inversely affects the rotavirus incidence during December. Similarly, this understanding is also supported by Tmin values over Dhaka. Therefore, as the number of warm nights increase, the magnitude of rotavirus cases decrease in the peak month. During the falling phase, when it starts to rain again from February, the airborne transport of the virus starts to be limited again and alongside the temperature remains under 21°C, until March. Thus, Tn1621GE serves as an indicator of warm nights during winter and lower rotavirus infection.
In other cities of Bangladesh, the timing of the cycles did not match in the same way; thus, correlation values decreased. In spatial cases, the rising and falling phase still showed a significant correlation with RR1 and Tn1621GE, but values of the correlation coefficient are lower than the values of the temporal analysis. During September, Tn1621GE acts as an indicator of cold night. In Sylhet and Barisal, as the increase of cold and dry nights coincides, rotavirus infection experiences a sharp rise; thus, no lag relationship is observed. However, in places like Dhaka and Mymensingh, where dryness comes early but temperature suitability comes in a delayed manner, the places experience a 1 month delay in an outbreak. If these two phenomena have a much wider gap, it can result in up to a 2 month delay, which was observed in Rajshahi. Therefore, our findings suggest that the timing of coldness and dryness can locally affect the spread of a rotavirus epidemic. This finding increases the potential of using a high‐resolution satellite data product in forecasting the local onset of the outbreaks. It is difficult to draw a generality from only 3 or 4 years of rotavirus observations; upon availability of more surveillance data, such analysis can be explored in more detail in future.
From the multivariate analysis, we are also able to confirm our hypothesis through the model selection process. All components of equation (1) significantly influence corresponding prevalence values of the rotavirus cycle and confirm the role of environmental factors on the whole rotavirus transmission cycle. The forecasted prevalence matched some spatial areas of observed values during November but not in October. As we conducted a detailed analysis of the climate extremes that are able to explain about 44% variance, such discrepancy was expected in spatial mapping. Due to the lack of sufficient spatial disease and climate data, the spatial signature was not captured properly, thus the accuracy of the model suffers. Moreover, factors like population dynamics and social behavior, or environmental factors such as flood and soil moisture, can be important in improving modeling accuracy. In addition to that, the accuracy of satellite data sets can also be a plausible reason for the less than satisfactory performance of the spatial mapping. However, the satellite products such as GPM, TRMM, and MODIS give not only near‐real‐time information but also great spatial coverage and have great potential to improve the resolution of the risk maps for such infectious diseases.
Understanding the role of climatic extremes can contribute to several pre outbreak and postoutbreak solutions. As the developed disease model suggests, with the knowledge of an imminent outbreak 1 month ahead, the health management organizations can implement extra vaccination efforts as well as awareness in the most vulnerable communities. In the developing world, where preventive resources are limited, prioritizing vaccination efforts and locations by public health authorities could save significant morbidity and mortality. During the epidemic, further outbreaks can be prevented by implementing disinfectant byproducts in water sources, improving drainage in the most vulnerable areas, and ensuring potable water in the infected communities. The postoutbreak measures can be improvement of sanitation situations by developing sewage structures, or educating the high‐risk communities about the transmission pathways of rotavirus. Structural solutions such as dikes, canals, or sewage networks can also be constructed to reduce water logging and improve sanitary and drainage conditions.
Immunization efforts targeting vulnerable communities would be another preventive measure to reduce the spread of rotavirus diarrhea. The efficacy of the vaccination is found to be 51% effective in reducing morbidity and mortality in recent trials in developing countries (Jiang et al., 2010). Two primary rotavirus vaccines have been certified (RotaTeq, Merck & Co, and Rotarix, GSK Biologicals) in major countries of the world and are slated to be incorporated across the developing world (Ruiz‐Palacios et al., 2006; Vesikari et al., 2006). The vaccination is usually administered to children under 1 year of age and typically costs from $1 to $7 per dose (Atherly et al., 2009).
5. Conclusions
In this study, we have analyzed the relationship of various climate variables and indices with rotavirus outbreaks in South Asia, formulated outbreak models, and proposed a forecast mechanism. In the validation process, we have utilized satellite‐derived climate products, which have the capacity to provide climatic information within a 24 hour latency period after the acquisition of data. To quantify the disease outbreaks, we used a spatial risk indicator to show the spatial pattern of rotavirus outbreaks throughout Bangladesh and South Asia and validated forecasted values with observed number of cases for October 2015 and November 2015.
The study strongly distinguished the effect of night and day time temperatures on the epidemiology of rotavirus. While previous studies pointed out that the cold and dry climate is favorable for rotavirus spread, the role of day and night temperature remained unexplored. Our analyses found that the number of colder nights 1 month before an epidemic dictates the magnitude of the rotavirus outbreak in subsequent months. This effect also matches with the number of 1 mm rainy days, as fewer numbers of rainy days or drier winters facilitate the transmission of the disease. Higher number of cold nights with less amount of rainfall during September and October may trigger the outbreak and the relationship was significant in all six cities of Bangladesh. Metropolitan areas of Dhaka and Chittagong experience similar but smaller outbreaks during the monsoon season due to the number of heavy rainfall events. As the cities have poor water supply, sanitation, and drainage systems, heavy rainfall events eventually connect the fecal‐oral route of rotavirus transmission pathway. Our analysis also showed that the rainfall and temperature products from GPM and MODIS, respectively, could be utilized to predict the occurrences and magnitudes of rotavirus outbreaks. The forecasted spatial patterns derived from these products matched with observed progression of rotavirus over Bangladesh.
The proposed disease forecasting mechanism provides great potential to improve the existing disease preparedness and vaccination strategies. The detection of risky hot spots can facilitate vaccination programs in similar climatic regions. As our model deterministically explained the environmental variability of the disease, future investigations can incorporate population‐based disease models to improve the performance of the forecasts. As shown in our study, satellite‐based forecasting has great potential to improve the health and well‐being and contribute toward sustainable development of the growing population of the planet.
Conflict of Interest
The authors declare no conflicts of interest relevant to this study.
Acknowledgments
This research was supported, in part, by a NASA Health and Air Quality grant (NNX15AF71G). The authors would like to thank Emine Bihter Yalcin and Soroush Kouhi Anbaran for their constructive comments. We also like to thank the anonymous reviewers for their detailed and insightful comments. The incidence rate of rotavirus over Dhaka can be found from icddr,b Health and Science Bulletins (http://dspace.icddrb.org/jspui/handle/123456789/6349). The rotavirus outbreak information for other cities in Bangladesh are available on the IEDCR website (http://www.iedcr.gov.bd/index.php/surveillance-rotavirus). The BMD and GHCN climate data can be obtained from BMD (http://bmd.gov.bd/?/home) and National Climatic Data Center (NCDC) website (https://www.ncdc.noaa.gov/cdo-web/datatools/findstation), respectively. The satellite data sets (GPM, MODIS, and TRMM) can be retrieved from the Google Earth Engine (https://earthengine.google.com/datasets/).
Hasan, M. A. , Mouw, C. , Jutla, A. , & Akanda, A. S. (2018). Quantification of rotavirus diarrheal risk due to hydroclimatic extremes over South Asia: Prospects of satellite‐based observations in detecting outbreaks. GeoHealth, 2, 70–86. 10.1002/2017GH000101
This article was corrected on 15 JUL 2019. The online version of this article has been modified to include a Conflict of Interest statement.
References
- Akanda, A. S. , & Hossain, F. (2012). The climate‐water‐health nexus in emerging megacities. Eos, Transactions American Geophysical Union, 93(37), 353–354. [Google Scholar]
- Akanda, A. S. , Jutla, A. S. , & Colwell, R. R. (2014). Global diarrhoea action plan needs integrated climate‐based surveillance. The Lancet Global Health, 2(2), e69–e70. 10.1016/S2214-109X(13)70155-4 [DOI] [PubMed] [Google Scholar]
- Akanda, A. S. , Jutla, A. S. , Gute, D. M. , Sack, B. R. , Alam, M. , Huq, A. , … Islam, S. (2013). Population vulnerability to biannual cholera peaks and associated macro‐scale drivers in the Bengal Delta. The American Journal of Tropical Medicine and Hygiene, 89(5), 950–959. [DOI] [PMC free article] [PubMed] [Google Scholar]
- Alexander, L. V. (2015). Global observed long‐term changes in temperature and precipitation extremes: A review of progress and limitations in IPCC Assessments and beyond1. Weather and Climate Extremes. 10.1016/j.wace.2015.10.007 [DOI] [Google Scholar]
- Ansari, S. A. , Springthorpe, V. S. , & Sattar, S. A. (1991). Survival and vehicular spread of human rotaviruses: Possible relation to seasonality of outbreaks. Reviews of Infectious Diseases, 13(3), 448–461. Retrieved from http://www.ncbi.nlm.nih.gov/pubmed/1866549 [DOI] [PubMed] [Google Scholar]
- Atchison, C. J. , Tam, C. C. , Hajat, S. , Van Pelt, W. , Cowden, J. M. , & Lopman, B. A. (2010). Temperature‐dependent transmission of rotavirus in Great Britain and The Netherlands. Proceedings of the Royal Society B, 277, 933–942. 10.1098/rspb.2009.1755 [DOI] [PMC free article] [PubMed] [Google Scholar]
- Atherly, D. , Dreibelbis, R. , Parashar, U. D. , Levin, C. , Wecker, J. , & Rheingans, R. D. (2009). Rotavirus vaccination: Cost‐effectiveness and impact on child mortality in developing countries. The Journal of Infectious Diseases, 200(s1), S28–S38. 10.1086/605033 [DOI] [PubMed] [Google Scholar]
- Bandyopadhyay, S. , Kanji, S. , & Wang, L. (2012). The impact of rainfall and temperature variation on diarrheal prevalence in Sub‐Saharan Africa. Applied Geography, 33(1), 63–72. 10.1016/j.apgeog.2011.07.017 [DOI] [Google Scholar]
- Bhavnani, D. , Goldstick, J. E. , Cevallos, W. , Trueba, G. , & Eisenberg, J. N. S. (2014). Impact of rainfall on diarrheal disease risk associated with unimproved water and sanitation. The American Journal of Tropical Medicine and Hygiene, 90(4), 705–711. 10.4269/ajtmh.13-0371 [DOI] [PMC free article] [PubMed] [Google Scholar]
- Brown, M. E. , Escobar, V. , Moran, S. , Entekhabi, D. , O'neill, P. E. , Njoku, E. G. , … Entin, J. K. (2013). NASA's soil moisture active passive (SMAP) mission and opportunities for applications users. Bulletin of the American Meteorological Society, 94(8). 10.1175/BAMS-D-11-00049.1 [DOI] [Google Scholar]
- Cash, B. A. , Rodo, X. , Emch, M. , Yunus, M. D. , Faruque, A. S. G. , & Pascual, M. (2014). Cholera and shigellosis: Different epidemiology but similar responses to climate variability. PLoS One, 9(9). 10.1371/journal.pone.0107223 [DOI] [PMC free article] [PubMed] [Google Scholar]
- Cheng, J. J. , & Berry, P. (2013). Development of key indicators to quantify the health impacts of climate change on Canadians. International Journal of Public Health, 58(5), 765–775. 10.1007/s00038-013-0499-5 [DOI] [PMC free article] [PubMed] [Google Scholar]
- Cunliffe, N. A. , Kilgore, P. E. , Bresee, J. S. , Steele, A. D. , Luo, N. , Hart, C. A. , & Glass, R. I. (1998). Epidemiology of rotavirus diarrhoea in Africa: A review to assess the need for rotavirus immunization. Bulletin of the World Health Organization, 76(5), 525–537. Retrieved from http://www.ncbi.nlm.nih.gov/pubmed/9868844 [PMC free article] [PubMed] [Google Scholar]
- Dennehy, P. H. (2000). Transmission of rotavirus and other enteric pathogens in the home. The Pediatric Infectious Disease Journal, 19(10 Suppl), S103–S105. Retrieved from http://www.ncbi.nlm.nih.gov/pubmed/11052397 [DOI] [PubMed] [Google Scholar]
- D'Souza, R. M. , Hall, G. , & Becker, N. G. (2008). Climatic factors associated with hospitalizations for rotavirus diarrhoea in children under 5 years of age. Epidemiology and Infection, 136(1), 56–64. 10.1017/S0950268807008229 [DOI] [PMC free article] [PubMed] [Google Scholar]
- Emamifar, S. , Rahimikhoob, A. , & Noroozi, A. A. (2013). Daily mean air temperature estimation from MODIS land surface temperature products based on M5 model tree. International Journal of Climatology, 33(15), 3174–3181. 10.1002/joc.3655 [DOI] [Google Scholar]
- FFWC (2012). Annual Report 2012, Flood Forecasting and Warning Centre (FFWC), Bangladesh. 10.1002/ejoc.201200111 [DOI]
- FFWC (2014). Annual Report 2014, Flood Forecasting and Warning Centre (FFWC), Bangladesh.
- Grassly, N. C. , & Fraser, C. (2008). Mathematical models of infectious disease transmission. Nature Reviews Microbiology. 10.1038/nrmicro1845 [DOI] [PMC free article] [PubMed] [Google Scholar]
- Gurarie, D. , & Seto, E. Y. W. (2009). Connectivity sustains disease transmission in environments with low potential for endemicity: Modelling schistosomiasis with hydrologic and social connectivities. Journal of the Royal Society, Interface, 6(35), 495–508. 10.1098/rsif.2008.0265 [DOI] [PMC free article] [PubMed] [Google Scholar]
- Harris, A. M. , Chowdhury, F. , Begum, Y. A. , Khan, A. I. , Faruque, A. S. G. , Svennerholm, A.‐M. , … Qadri, F. (2008). Shifting prevalence of major diarrheal pathogens in patients seeking hospital care during floods in 1998, 2004, and 2007 in Dhaka, Bangladesh. The American Journal of Tropical Medicine and Hygiene, 79(5), 708–714. 10.4269/ajtmh.2008.79.708 [DOI] [PMC free article] [PubMed] [Google Scholar]
- Hasan, M. A. , Islam, A. K. M. S. , & Akanda, A. S. (2017). Climatic extremes from dynamically downscaled CMIP5 models over Bengal Delta under RCP scenarios: An advanced bias‐correction approach with new gridded data. Climate Dynamics. 10.1007/s00382-017-4006-1 [DOI] [Google Scholar]
- Hashizume, M. , Armstrong, B. , Wagatsuma, Y. , Faruque, A. S. G. , Hayashi, T. , & Sack, D. A. (2008). Rotavirus infections and climate variability in Dhaka, Bangladesh: A time‐series analysis. Epidemiology and Infection, 136(9), 1281–1289. 10.1017/S0950268807009776 [DOI] [PMC free article] [PubMed] [Google Scholar]
- Hou, A. Y. , Kakar, R. K. , Neeck, S. , Azarbarzin, A. A. , Kummerow, C. D. , Kojima, M. , … Nakamura, K. (2014). The Global Precipitation Measurement mission (GPM).
- Huffman, G. J. , Bolvin, D. T. , & Nelkin, E. J. (2015). Integrated Multi‐satellitE Retrievals for GPM (IMERG) technical documentation. NASA/GSFC Code, 612, 47. Retrieved from ftp://arthurhou.pps.eosdis.nasa.gov/gpmdata
- Hutton, G. , & Bartram, J. (2008). Global costs of attaining the Millennium Development Goal for water supply and sanitation. Bulletin of the World Health Organization, 86(1), 13–19. 10.2471/BLT.07.046045 [DOI] [PMC free article] [PubMed] [Google Scholar]
- Islam, A. K. M. S. , & Hasan, M. A. (2012). Climate induced changes of precipitation extremes over Bangladesh. In Proceedings of International Conference On Environmental Aspects Of Bangladesh (pp. 67–105). Retrieved from http://www.binbd.com/benjp/iceab12/ICEAB12proceeding4.pdf
- Jagai, J. S. , Sarkar, R. , Castronovo, D. , Kattula, D. , McEntee, J. , Ward, H. , … Naumova, E. N. (2012). Seasonality of rotavirus in south asia: A meta‐analysis approach assessing associations with temperature, precipitation, and vegetation index. PLoS One, 7(5). 10.1371/journal.pone.0038168 [DOI] [PMC free article] [PubMed] [Google Scholar]
- Jiang, V. , Jiang, B. , Tate, J. , Parashar, U. D. , & Patel, M. M. (2010). Performance of rotavirus vaccines in developed and developing countries. Human Vaccines, 6(7), 532–542. 10.4161/HV.6.7.11278 [DOI] [PMC free article] [PubMed] [Google Scholar]
- Jutla, A. S. , Aldaach, H. , Billian, H. , Akanda, A. S. , Huq, A. , & Colwell, R. R. (2015). Satellite based assessment of hydroclimatic conditions related to cholera in Zimbabwe. PLoS One. 10.1371/journal.pone.0137828 [DOI] [PMC free article] [PubMed] [Google Scholar]
- Kazi, A. M. , Warraich, G. J. , Qureshi, S. , Qureshi, H. , Khan, M. M. A. , Zaidi, A. K. M. , et al. (2014). Sentinel Hospital‐Based Surveillance for Assessment of Burden of Rotavirus Gastroenteritis in Children in Pakistan. PLoS ONE, 9(10), e108221 10.1371/journal.pone.0108221 [DOI] [PMC free article] [PubMed] [Google Scholar]
- Keggenhoff, I. , Elizbarashvili, M. , & King, L. (2015). Recent changes in Georgia's temperature means and extremes: Annual and seasonal trends between 1961 and 2010. Weather and Climate Extremes, 8, 3445 10.1016/j.wace.2014.11.002 [DOI] [Google Scholar]
- Kummerow, C. , Barnes, W. , Kozu, T. , Shiue, J. , & Simpson, J. (1998). The Tropical Rainfall Measuring Mission (TRMM) sensor package. Journal of Atmospheric and Oceanic Technology, 15(3), 809–817. [Google Scholar]
- Lambrechts, L. , Paaijmans, K. P. , Fansiri, T. , Carrington, L. B. , Kramer, L. D. , Thomas, M. B. , & Scott, T. W. (2011). Impact of daily temperature fluctuations on dengue virus transmission by Aedes aegypti. Proceedings of the National Academy of Sciences of the United States of America, 108(18), 7460–7465. 10.1073/pnas.1101377108 [DOI] [PMC free article] [PubMed] [Google Scholar]
- Levy, K. , Hubbard, A. E. , & Eisenberg, J. N. S. (2009). Seasonality of rotavirus disease in the tropics: a systematic review and meta‐analysis. International Journal of Epidemiology, 38(6), 1487–1496. 10.1093/ije/dyn260 [DOI] [PMC free article] [PubMed] [Google Scholar]
- Maantay, J. , & Becker, S. (2012). The health impacts of global climate change: A geographic perspective. Applied Geography, 33, 1–3. 10.1016/J.APGEOG.2011.08.008 [DOI] [Google Scholar]
- Martinez, P. P. , King, A. A. , Yunus, M. , Faruque, A. S. G. , & Pascual, M. (2016). Differential and enhanced response to climate forcing in diarrheal disease due to rotavirus across a megacity of the developing world. Proceedings of the National Academy of Sciences of the United States of America, 113(15), 4092–4097. 10.1073/pnas.1518977113 [DOI] [PMC free article] [PubMed] [Google Scholar]
- Massey, F. J. (1951). The Kolmogorov‐Smirnov test for goodness of fit. Journal of the American Statistical Association, 46(253), 68–78. 10.1080/01621459.1951.10500769 [DOI] [Google Scholar]
- Menne, M. J. , Durre, I. , Korzeniewski, B. , McNeal, S. , Thomas, K. , Yin, X. , … Houston, T. G. (2012). Global Historical Climatology Network ‐ Daily (GHCN‐Daily). Journal of Atmospheric and Oceanic Technology, 29, 897–910. 10.1175/JTECH-D-11-00103.1 [DOI] [Google Scholar]
- Moe, K. , & Harper, G. J. (1983). The effect of relative humidity and temperature on the survival of bovine rotavirus in aerosol. Archives of Virology, 76(3), 211–216. [DOI] [PubMed] [Google Scholar]
- Moe, K. , & Shirley, J. A. (1982). The effects of relative humidity and temperature on the survival of human rotavirus in faeces. Archives of Virology, 72(3), 179–186. [DOI] [PubMed] [Google Scholar]
- Moors, E. , Singh, T. , Siderius, C. , Balakrishnan, S. , & Mishra, A. (2013). Climate change and waterborne diarrhoea in northern India: Impacts and adaptation strategies. Science of the Total Environment, 468–469, S139–S151. 10.1016/j.scitotenv.2013.07.021 [DOI] [PubMed] [Google Scholar]
- Mullick, S. , Mandal, P. , Nayak, M. K. , Ghosh, S. , De, P. , Rajendran, K. , … Chawla‐Sarkar, M. (2014). Hospital based surveillance and genetic characterization of rotavirus strains in children (<5 years) with acute gastroenteritis in Kolkata, India, revealed resurgence of G9 and G2 genotypes during 2011‐2013. Vaccine, 32(S1), A20–A28. 10.1016/j.vaccine.2014.03.018 [DOI] [PubMed] [Google Scholar]
- Pagano, T. S. , & Durham, R. M. (1993). Moderate resolution imaging spectroradiometer (MODIS) In Proceedings Volume 1939, Sensor Systems for the Early Earth Observing System Platforms (pp. 2–18). International Society for Optics and Photonics; 10.1117/12.152854 [DOI] [Google Scholar]
- Peterson, T. C. (2005). Climate change indices. WMO Bulletin, 54(2), 83–86. [Google Scholar]
- Prosser, D. J. , Hungerford, L. L. , Erwin, R. M. , Ottinger, M. A. , Takekawa, J. Y. , Newman, S. H. , … Ellis, E. C. (2016). Spatial modeling of wild bird risk factors for highly pathogenic A(H5N1) avian influenza virus transmission. Avian Diseases, 60(1s), 329–336. 10.1637/11125-050615-Reg [DOI] [PubMed] [Google Scholar]
- Remais, J. , Liang, S. , & Spear, R. C. (2008). Coupling hydrologic and infectious disease models to explain regional differences in schistosomiasis transmission in southwestern China. Environmental Science & Technology, 42(7), 2643–2649. Retrieved from http://www.ncbi.nlm.nih.gov/pubmed/18505010 [DOI] [PubMed] [Google Scholar]
- Ruiz‐Palacios, G. M. , Pérez‐Schael, I. , Velázquez, F. R. , Abate, H. , Breuer, T. , Clemens, S. C. , … O'Ryan, M. (2006). Safety and efficacy of an attenuated vaccine against severe rotavirus gastroenteritis. New England Journal of Medicine, 354(1), 11–22. 10.1056/NEJMoa052434 [DOI] [PubMed] [Google Scholar]
- Schwartz, B. S. , Harris, J. B. , Khan, A. I. , Larocque, R. C. , Sack, D. A. , Malek, M. A. , … Ryan, E. T. (2006). Diarrheal epidemics in Dhaka, Bangladesh, during three consecutive floods: 1988, 1998, and 2004. The American Journal of Tropical Medicine and Hygiene, 74(6), 1067–1073. Retrieved from http://www.ncbi.nlm.nih.gov/pubmed/16760521 [PMC free article] [PubMed] [Google Scholar]
- Shapiro, S. S. , & Wilk, M. B. (1972). An analysis of variance test for the exponential distribution (complete samples). Technometrics, 14(2), 355–370. 10.1080/00401706.1972.10488921 [DOI] [Google Scholar]
- Sherchand, J. B. , Nakagomi, O. , Dove, W. , Nakagomi, T. , Yokoo, M. , Pandey, B. D. , … Cunliffe, N. A. (2009). Molecular epidemiology of rotavirus diarrhea among children aged <5 years in nepal: predominance of emergent G12 strains during 2 years. The Journal of Infectious Diseases, 200(Suppl 1), S182–S187. 10.1086/605046 [DOI] [PubMed] [Google Scholar]
- Shetty, R. S. , Kamath, V. G. , Nayak, D. M. , Hegde, A. , & Saluja, T. (2017). Rotavirus associated acute gastroenteritis among under‐five children admitted in two secondary care hospitals in southern Karnataka, India. Clinical Epidemiology and Global Health, 5(1), 28–32. [Google Scholar]
- Siddique, A. K. , Ahmed, S. , Iqbal, A. , Sobhan, A. , Poddar, G. , Azim, T. , … Sack, R. B. (2011). Epidemiology of rotavirus and cholera in children aged less than five years in rural Bangladesh. Journal of Health, Population and Nutrition, 29(1), 1–8. 10.3329/jhpn.v29i1.7560 [DOI] [PMC free article] [PubMed] [Google Scholar]
- Tawhid, K. G. (2004). Causes and effects of water logging in Dhaka City, Bangladesh. Retrieved from https://s3.amazonaws.com/academia.edu.documents/31161625/LWR_EX_04_45.pdf?AWSAccessKeyId=AKIAIWOWYYGZ2Y53UL3A26amp%3BExpires=150841626626amp%3BSignature=yJgO5T20jTWLKAggbA2MR5WAgd4%3D26amp%3Bresponse-content-disposition=inline%3Bfilename%3DCauses_and_effects_of_water_loggi
- Troeger, C. , Forouzanfar, M. , Rao, P. C. , Khalil, I. , Brown, A. , Reiner, R. C. , … Others (2017). Estimates of global, regional, and national morbidity, mortality, and aetiologies of diarrhoeal diseases: A systematic analysis for the Global Burden of Disease Study 2015. The Lancet Infectious Diseases, 909–948. 10.1016/S1473-3099(17)30276-1 [DOI] [PMC free article] [PubMed] [Google Scholar]
- Vesikari, T. , Matson, D. O. , Dennehy, P. , Van Damme, P. , Santosham, M. , Rodriguez, Z. , … Heaton, P. M. (2006). Safety and efficacy of a pentavalent human–bovine (WC3) reassortant rotavirus vaccine. New England Journal of Medicine, 354(1), 23–33. 10.1056/NEJMoa052664 [DOI] [PubMed] [Google Scholar]
- Wang, H. , Naghavi, M. , Allen, C. , Barber, R. M. , Carter, A. , Casey, D. C. , … Zuhlke, L. J. (2016). Global, regional, and national life expectancy, all‐cause mortality, and cause‐specific mortality for 249 causes of death, 1980–2015: A systematic analysis for the Global Burden of Disease Study 2015. The Lancet, 388(10053), 1459–1544. 10.1016/S0140-6736(16)31012-1 [DOI] [PMC free article] [PubMed] [Google Scholar]
- Wang, X. L. , & Feng, Y. (2013). RHtestsV4 user manual.
- Wangchuk, S. , Dorji, T. , Tsheten, Tshering, K. , Zangmo, S. , Pem Tshering, K. , … Ahmed, K. (2015). A prospective hospital‐based surveillance to estimate rotavirus disease burden in Bhutanese children under 5 years of age. Tropical Medicine and Health, 43(1), 63–68. 10.2149/tmh.2014-22 [DOI] [PMC free article] [PubMed] [Google Scholar]
- WHO (2011). Rotavirus surveillance worldwide‐2009. Weekly Epidemiological Record, 86(18), 174–176.21608199 [Google Scholar]
- WHO (2014). Preventing diarrhoea through better water, sanitation and hygiene: exposures and impacts in low‐and middle‐income countries. World Health Organization. [Google Scholar]
- World Population Review . (2017). World population review. Retrieved April 6, 2017, from http://worldpopulationreview.com/world-cities/dhaka-population/