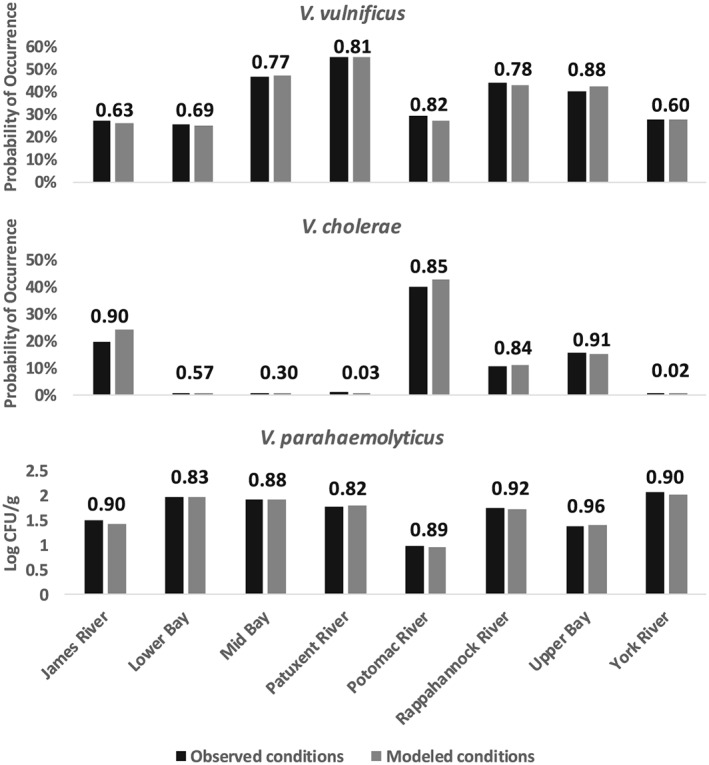
Figure 4.

Estimated probability of occurrence (V. vulnificus and V. cholerae) and concentration of V. parahaemolyticus in oysters (log), in each region of the Chesapeake Bay, from GLMs in Table 1. Temperature and salinity values are sourced from CTD casts (black bars) and estimates from the statistical framework in Figure 3 at the same locations (gray bars), during seasons of highest detectability (May–October for V. vulnificus and V. parahaemolyticus, March–August for V. cholerae). R2 values between GLM predictions for each species from CTD casts and the statistical framework from within each region are shown. Note that only out‐of‐model test years (2006–2015) were used [see Muhling et al., 2017].
