

Abstract
Explosive volcanic eruptions lead to ash deposition and subsequent leaching of contaminants into soils or surface water, impacting flora and fauna, including human health. This study determined the control of ash surface area and chemical composition on ash dissolution rates. Fresh, unhydrated ash samples from four contrasting volcanoes were analyzed in the laboratory. Column leachate tests were used to compare leaching rates over a range of basaltic to andesitic ashes as a function of time and surface area, to analyze the effects of ash deposition. It was found that surface area, measured both geometrically and by multipoint Brunauer‐Emmett‐Teller analysis, generally increases for a short time, gradually decreases, then increases over the rest of the leaching experiment, due to area to mass ratio fluctuations. After the column leachate tests, postleaching water analyses for elemental compositions were conducted by inductively coupled plasma‐mass spectrometry and ion chromatography. Steady state dissolution rates initially decayed rapidly due to the smallest size fraction of ash (dust), which provides a large area of fresh leachable surfaces as well as the rapid dissolution of highly soluble metal salts. Some of the dissolved concentrations of elements relevant to human and ecosystem health such as F, Cd, Se, As, and Cr rose above World Health Organization (WHO) drinking water standards within an hour of experimental leaching. In nature, however, safe consumption standards are further dependent upon bioaccumulation and chronic exposure. As such, individual and recurring ash deposition events have applications to emergency response and preparedness in volcanic regions.
Keywords: Volcanic Ash Leaching, Ash Morphology, Column Leachate Tests, Fluorosis, Dissolution rates, Bubbles
Key Points
After volcanic eruptions, ash is deposited and leached into soil and surface water impacting flora and fauna, including humans
Metals and volatiles of concern, to human and ecosystem health, are released from ash particles within an hour of leaching
Dissolution rates are a function of both ash morphology and chemical composition
1. Introduction
Volcanic ash eruptions produce well‐known hazards, but the geochemical impacts on ecosystems and human health are not as well understood. Health hazards associated with volcanic eruptions include inhalation dangers and water contamination, which can lead to increased cancer risk, kidney damage, and skeletal and dental fluorosis (Baxter & Ancia, 2002; Genareau et al., 2016; Horwell et al., 2003; Ivhhn.org, 2018). After deposition and subsequent leaching in soils or water bodies, volcanic ash leachates may have both poisoning and fertilizing potential; by contaminating water and vegetation, making it unsafe for human and animal consumption, but also enriching volcanic soils with critical nutrients in the long term. Both chemistry and morphology of ash can vary widely, thus affecting the rate of leaching anions and cations into the environment.
This study characterizes the geochemical effect of ash leachates on the natural environment by determining the impact of ash morphology and chemistry on dissolution rates. These controls on leaching rates from ash have not been considered before and can provide a deeper understanding of the outcomes of volcanic events on human health and the environment. Numerous previous ash leachate studies have been conducted in both the field and the laboratory, including analysis of leachate chemistry from a range of compositions from andesitic to basaltic ash (Bosshard‐Stadlin et al., 2017; Cangemi et al., 2017; Flaathen & Gislason, 2007; Frogner et al., 2001; Frogner Kockum et al., 2006; Genareau et al., 2016; Jones & Gislason, 2008; Witham et al., 2005). Similar leachate studies have used previously weathered ash (Genareau et al., 2016; Jones & Gislason, 2008), while others used unhydrated pristine ash (Cronin et al., 2014; Gislason et al., 2011; Olgun et al., 2011) to explore various environmental geochemical conditions and processes that follow volcanic eruptions. For this study, pristine ash is used and is defined as natural ash, collected immediately after an eruption, prior to being altered naturally by precipitation (unhydrated) or mechanically in the lab. Pristine ash provides the opportunity to understand how natural ash morphology and volcanic dust affect surface area, and how evolving surface area, in turn, affects leaching of cations and anions from ash. To date, studies have assumed an invariant surface area (Jones & Gislason, 2008; Wolff‐Boenisch et al., 2004). In the present study, ash surface area was measured throughout four distinct, week‐long leaching experiments, which revealed how dissolution rates were impacted by changing surface area. Measurements of surface area fluctuations in conjunction with leachates from pristine ash demonstrate how people and ecosystems are impacted by chemically altered water during and throughout a volcanic eruption, with applications to emergency response and preparedness in volcanic regions.
1.1. Chemical Impacts
Volcanic glass that makes up ash is highly soluble and undergoes rapid mechanical and chemical weathering. This enables us to conduct laboratory analyses that reflect short‐term chemical changes in the environment after volcanic eruptions. Volcanic aerosols in an ash plume consist of acid magmatic gases (HF, HCl, and SO2) that adsorb onto the surface of volcanic ash particles and form deliquescent metal salt encrustations (crust of highly soluble metal salts), such as fluorides, chlorides, and sulfates (Cronin et al., 2014; Frogner et al., 2001; Óskarsson, 1980; Óskarsson, 1981). These encrusted surfaces are extremely water‐soluble and dissolve rapidly to release ions into the resulting soil and surface water (Frogner et al., 2001; Óskarsson, 1981). Released nutrients and trace metals have both contaminating and fertilizing potential for affected soils, waters, and ecosystems.
The chemical impact of ash leaching in part depends on the chemistry of the ash itself. Basaltic ashes have greater concentrations of certain metals such as Fe and Mg, while more silicic ashes contain greater concentrations of other cations such as K and Na. As such, magmatic chemistry in part controls the nature of leachate after ash deposition, so it is instructive to examine leachates from ashes of various compositions.
The elevated concentrations of dissolved ions leached from volcanic ash, such as Cl, F, Al, Fe, Mn, As, Cd, Cr, Cu, Pb, Se, and Zn, can chemically alter the water, leading to a change in pH or toxic bioaccumulation, which can render the water unsafe for human and animal consumption (Flaathen & Gislason, 2007; Genareau et al., 2016; Stewart et al., 2006; Wilson et al., 2010). Certain metals are of particular concern for bioaccumulation because they may be toxic in low concentrations and do not degrade. Although some ions (Mn, Fe, Na, SO4 2−, and Zn) do not necessarily cause toxicity, they still render water unpalatable for human consumption (Stewart et al., 2006). Small amounts of Cd, Cu, and Se in water can all lead to liver or kidney damage, and As can damage skin and lead to increased cancer risk. High concentrations of Al and Mn from ash leachates can threaten the health of flora and fauna as was seen in the 1991 and 2000 eruptions of Hekla, Iceland (Flaathen & Gislason, 2007). Mn is both an essential micronutrient, yet toxic when found in excessive concentrations (Millaleo et al., 2010).
High levels of fluoride (F) have been frequently measured in volcanic ash leachates (Araya et al., 1990; Cordeiro et al., 2012; Cronin & Sharp, 2002; Cronin et al., 2003; Flaathen & Gislason, 2007; Madonia et al., 2013; Rubin et al., 1994; Stewart et al., 2006; Thordarson & Self, 2003). When present in very dilute concentrations, fluoride can be beneficial, but when present in elevated concentrations or when consistently consumed, it can lead to chronic skeletal and dental fluorosis. The 1783–1784 Laki flood lava eruption in Iceland resulted in >60% of the grazing livestock to be decimated by the high fluoride in the surface water (Thordarson et al., 2003). Additionally, the effect of concentrated fluoride is harmful to plants. Fluoride is not essential for plant growth, but it accumulates in plants when present. This can be an issue because concentrated Al, also leached from ash, is toxic to plants, and in acidic environments Al and F bind to create toxic aluminofluoride complexes (Frogner Kockum et al., 2006).
Although many ions released from the leaching of volcanic ash can be dangerous, there are also benefits of ash deposition. Nutrients such as K, P, Mg, Fe, and other micronutrients derived from ash can immediately fertilize soils and aid in long‐term plant growth or short‐term ocean fertilization. Fe leached from ash can fertilize marine ecosystems (Browning et al., 2015; Durant et al., 2012; Frogner et al., 2001; Olgun et al., 2011). Aerosol deposition from the 2010 Eyjafjallajökull eruption led to significant dissolved Fe input and fertilization of the Iceland Basin. The eruption had the potential to increase the dissolved Fe in the water by >0.2 nM over an area of 570,000 km2 (Achterberg et al., 2013). Cronin et al. (1998) studied how the volcanic ash from the 1995 and 1996 Ruapehu eruptions chemically affected soils in New Zealand. Beneficial elevated concentrations of S, Mg, K, and Se from the volcanic ash were measured in the soils. These and other water soluble elements were readily available to be used by plants and can immediately influence soil fertility (Cronin et al., 1998). Thus, by understanding how ash influences soil and water chemistry, better predictions can be made regarding the effects of specific volcanic eruptions on local ecosystems.
1.2. Volcanic Ash Surface Area
Ash morphology (external and internal structure), vesicles, particle size, and presence of dust are all contributing factors of volcanic ash surface area. The concentration and size of the vesicles in ash varies with composition and eruption energetics. While partial bubble imprints are seen on the exteriors of ash particles, some vesicles remain intact in ash interiors. Two populations of bubbles may form during eruption. Preeruptive bubbles nucleate deep within the conduit and grow due to decompression and diffusion during ascent within the conduit (Genareau et al., 2012; Toramaru, 2014). In some cases, late‐stage explosive decompression is sufficiently rapid to produce a second nucleation phase that produces another population of bubbles, called syneruptive bubbles, which are typically smaller and far more numerous than preeruptive bubbles (Genareau et al., 2013; Toramaru, 2014). The volcanic explosivity index (VEI) is a measure of the violence of a volcanic eruption (Newhall and Self, 1982) and can be related to bubble production. Lower VEI eruptions are characterized as less energetic with slower decompression rates and produce shorter column heights, while eruptions with a higher VEI are more explosive and energetic and have taller column heights. As VEI increases (Genareau et al., 2013; Toramaru, 2006), the bubbles' number density generally increases, so that upon fragmentation, surface area per mass also increases.
Surface area per mass is strongly controlled by particle size. Smaller particles have greater surface area per mass compared to a larger size population of ash. Volcanic dust is an end‐member of particle size, in this study considered to be any particle with length scale <5 μm (Walker, 1981). Volcanic dust is likely created after fragmentation by milling and comminution of ash particles in the upper conduit and eruptive column (Langmann, 2013; Rose & Durant, 2009), although the details of this process have yet to be quantified. Small fragments of ash (<5μm) break off the larger particles and adhere to the surfaces of the ash particles. Similar processes can be seen in pebble abrasion during fluvial transport (Attal & Lavé, 2009). Dust is important because it can add a large amount of surface area and therefore greatly increases leachable surface area. Ash aggregates, the result of dust adhering onto the surface of ash particles, can be bound by liquid‐bonds, hydro‐bonds, and electrostatic forces (Brown et al., 2012). Mueller et al. (2016) suggested that the liquid binding agents (liquid‐bonds) of ash aggregates are NaCl salt bridges. These bond‐forming salt bridges allow aggregates to be preserved in the geologic record (Mueller et al., 2016). Hydro‐bonds form in the upper troposphere as ice that binds ash particles together, causing the relatively large aggregates to settle quickly out of the atmosphere. As humidity decreases or temperature increases, leaving less available water in the atmosphere, electrostatic forces play a larger role. It is not currently known if these binding forces can act in concert or if they are completely separate throughout the aggregate formation, deposition, and leaching processes. Although not the focus of the present study, this continues to be an area of active research (Rose and Durant, 2011).
It is necessary to quantify the surface area of ash because it enables us to correctly determine its control on experimental volcanic glass dissolution rates. The relation of mineral surface morphology on dissolution rates has been previously quantified (Jeschke & Dreybrodt, 2002) and can help determine how to assess surface area measurements of glassy volcanic ash. Previous specific surface areas of volcanic ash have been reported to range from 1 to 10 m2/kg using BET analysis (Delmelle et al., 2005; Langmann, 2013), whereas geometric surface areas range from 0.005 to 0.07 m2/kg. Wolff‐Boenisch et al. (2004) determined that the geometric surface areas were more appropriate than BET surface areas due to stronger linear regression between the log of the measured dissolution rates and the silica content of the glasses for geometric normalized rates relative to BET rates (Wolff‐Boenisch et al., 2004), but Jeschke and Dreybrodt (2002), who studied the relation between mineral dissolution rates with surface morphology, demonstrated that the appropriate surface area measurement is dependent upon surface morphology. If the entire surface contributes to leaching, then BET surface area should be used when determining dissolution rates, but if there is a surface with deep “ink bottle” pores or a complex and poorly connected internal network of vesicles (which would trap water and saturate like batch experiments and not contribute to short‐term dissolution rates), it may be more accurate to use geometric surface area (Jeschke & Dreybrodt, 2002). Unlike a column leaching test (used in this experiment), which has a constant flow of source water, batch experiments have no water flux (ash and water are in a closed system) and tend to reach saturation state quickly. The internal permeability of volcanic ash is challenging to quantify, and therefore, it is unknown if the water can easily flow in and out of the vesicles or if some water gets trapped and chemically saturated. There are still many unknowns about the interactions between water and ash particles, and this is a fertile area for future study. This study aims to characterize the geochemical effect of ash leachates on the natural environment by determining the impact of ash morphology and chemistry on dissolution rates. This is the first study to consider these controls on volcanic ash leaching rates, and it hopes to provide a deeper understanding of the outcomes of volcanic events on human health and the environment.
2. Materials and Methods
2.1. Ash Samples
Ash samples from Alaska (Redoubt), Costa Rica (Turrialba), Iceland (Eyjafjallajökull), and Hawaii (Kilauea) were used to determine the chemical evolution of leaching from ashes with varying composition and morphology over time. The bulk chemistry of ash, ranged from basaltic (Kilauea) to andesitic (Turrialba), from these volcanoes has been previously analyzed and published (Clague et al., 1999; Coombs et al., 2013; De Moor et al., 2016; Di Piazza et al., 2015; Gislason et al., 2011). It would be instructive for this study to incorporate rhyolitic ashes but no volcanoes with rhyolitic ash erupted during the duration of this project, and furthermore, the collection of fresh, rhyolitic ash would have presented a serious hazard due to the explosivity of felsic eruptions.
Redoubt: Mount Redoubt (60.485°N, 152.742°W) is a 3.1 km above sea level (asl) glacier‐covered stratovolcano in Lake Clark National Park, Alaska. Mount Redoubt is located on a subduction zone where the Pacific plate subducts under the North American plate creating the Aleutian volcanic arc. The low‐silica andesitic ash was collected soon after being deposited from a car windshield in March 2009 and had not been altered by precipitation or other exposure to water.
Turrialba: Turrialba (10.025°N, 83.767°W) is a 3.3 km asl stratovolcano in Costa Rica. Turrialba is a part of the Central America Volcanic Arc, which was created by the oceanic Cocos plate subducting under the continental Caribbean plate. Andesitic ash from was collected on 20 May 2016 by Gino Gonzalez. Turrialba is currently active and has undergone many eruptive phases. The ash used in this study represents just one eruptive phase that began on 20 May 2016. Another study collected volcanic glass in 2014 and found that the chemical composition of the ash was basaltic andesite to trachyandesite (De Moor et al., 2016), which should be similar to the composition of the glasses used in this study.
Eyjafjallajökull: Eyjafjallajökull (63.633°N, 19.633°W) is a 1.7 km asl stratovolcano located in southern Iceland. The volcano is located on the Mid‐Atlantic Ridge where the North American Plate is diverging from the Eurasian Plate. Basaltic ash was collected by Dr. Joseph Licciardi of University of New Hampshire on 6 May 2010, on the south side of the volcano, shortly after deposition, while the eruption was ongoing. The ash has a blocky to coarsely vesicular morphology (Cioni et al., 2014). Gislason et al. (2011) explained chemical differences of two ash eruption phases from the initial explosive phase (producing explosive ash) in April to what was characterized as more “typical” ash later in the eruption.
Kilauea: Kilauea (19.421°N, 155.287°W) is a 1.2‐km asl shield volcano located on the Big Island of Hawaii. The Hawaiian hot spot drives the melt of the overriding Pacific Plate to create the volcano. Basaltic ash was collected in the winter and spring of 2017 by Dr. Don Swanson of the Hawaii Volcano Observatory (HVO), ~470 m from the vent in the lava lake in Halemaumau Crater. Kilauea produces basaltic Pele's spherules, hair, tears, breadcrust tears, scoria, and reticulite tephra, dependent upon the magma drop size and cooling time of the particle (Porritt et al., 2012). In this study, Pele's tears, spherules, and hairs were used for the leachate experimentation. There have been few detailed studies of Pele's spheres, and there is much to be learned about the formation and characteristic of these unique pyroclasts. Glass spheres can be formed during various geophysical processes including lightning storms (Genareau et al., 2015) meteorite impacts, and low‐viscosity volcanic eruptions. The spherules are most commonly associated with high‐temperature, low‐viscosity, basaltic explosive eruptions such as the recent eruption at the Halemaumau crater, Kilauea volcano. The spherules are formed by rapid viscous relaxation due to surface tension before the spherules can cool and vitrify (Porritt et al., 2012). Previous comprehensive studies mostly focused on the formation of larger tephra or Pele's hair or tears, but Pele's spherules have only been rarely studied (Porritt et al., 2012). In the present study, in addition to leaching, a dozen spherules were mounted in epoxy and sanded approximately in half into order to expose the interior of the ash.
2.2. Surface Area Analysis
Ash surface area changes were measured during the leachate experiment geometrically by scanning electron microscope (SEM), which assumes perfect geometric shape, and by gas adsorption using Brunauer‐Emmett‐Teller (BET) analysis, which accounts for every surface including internal vesicles through gas adsorption. It is unknown which method better represents natural conditions, so we compare both geometric and BET surfaces areas, which can be very different due to the complex internal morphology of some ash particles. This strongly affects the magnitude of the calculated dissolution rate. Ash particles were imaged and characterized using a desktop SEM at Lehigh University, and the long axis of each ash particle was measured using ImageJ software. No samples were sieved except for Kilauea, which originally had a much broader size distribution that included some very large particles that would not be pertinent to this study. The Kilauea ash was separated using a stainless‐steel sieve (to minimize metal contamination (Jones & Gislason, 2008; Witham et al., 2005)) to include only particles <150 μm. Tephra larger than this was not expected to contribute to short‐term leaching in the surface water and soil due to its small surface area to volume ratio. Samples were characterized based on morphology and dust on the ash surfaces. A small portion of each ash sample (~100–200 particles, >5μm) were measured after each leaching period (before leaching, post 1 hr, 8 hrs, 4 days, and 7 days). The particles were then binned based on their sizes to quantify size distribution. The changes in size distribution allowed the changes in geometric surface area to be correctly assessed. The geometric surface area (Ageo) was calculated using the area of an inscribed cube:
| (1) |
where r is half of the measured long axis of an ash particle. The area was calculated for each measured ash particle then summed and divided by the sum of the total mass of all the ash particles. The mass of single ash particles was calculated using the volume of an inscribed sphere:
| (2) |
and then multiplying it by the glass density. For these calculations, the bulk density of Turrialba, Redoubt, and Eyjafjallajökull ash was taken as 1,500 kg/m3. This value was determined in previous studies (Cronin et al., 1998; Langmann, 2013; Moen & McLucas, 1980; Scott & McGimsey, 1994; Stewart et al., 2006), which presented a range of dry bulk densities of 500–3,000 kg/m3 depending on whether it was freshly fallen ash or compacted ashfall, if the chemistry was basaltic or andesitic, if there were crystals present, and the measurement of porosity. There was little to no crystallinity in the ash samples analyzed in this study, aside from some adhered to some of the Turrialba samples. Porosity varied between the Kilauea spherules with few internal vesicles and the more vesicular Eyjafjallajökull and Turrialba ash. Due to the greater density of Kilauea, 2,020 kg/m3 was used in calculations, a value previously determined as the average bulk density of Pele's spherules and tears (Porritt et al., 2012). In previous leaching studies (Jones & Gislason, 2008; Wolff‐Boenisch et al., 2004) geometric surface area (Brantley et al., 1999; Gautier et al., 2001) was calculated by
| (3) |
where ρ is the bulk density of the ash and d eff is the effective particle diameter. The value in the numerator reflects the assumption that the particles are smooth and spherical. The value for d eff was calculated in previous studies under the assumption of a homogenous (flat) particle size distribution using (Tester et al., 1994):
| (4) |
where d max and d min represent the minimum and maximum particle size of the ash sample used for the leachate experimentation. This previously accepted calculation is not an accurate assessment of the geometric surface area because it assumes a homogeneous particle distribution in which there are an equal number of particles in each size bin. There are no natural samples of ash particles that are evenly distributed in terms of size. Rather, the number density of small particles is far greater than that of larger particles. A flat size distribution may be a more appropriate assumption if the samples are milled and sieved prior to the leachate experiment. However, if samples are sieved and have a fixed maximum and minimum particle size, the calculation of d eff cannot reflect the change in geometric surface area over time. These calculations also assume a spherical shape, which minimizes the surface area of a particle, and does not consider any external (dust or other small surface particles or indentations) or internal (vesicles) complexities of the ash that significantly increase the surface area available to leaching. While this may reasonably apply to Kilauea's perfect spherules, Kilauea is an end‐member in terms of ash morphology. Most ash is angular, imperfect, vesicular, and dusty, providing far more surface area per mass than smooth, spherical particles. The surface area to volume ratio of an inscribed cube is a better geometric representation of ash particles than a sphere as assumed in previous studies, since it increases that ratio (Equation (1)). This new way to calculate geometric surface area is recommended for future ash leachate studies.
The specific surface area of the ash particles before and throughout the leachate experiment was quantified by the BET method. BET surface area is determined by physical adsorption of Kr gas into the volcanic ash sample. Physical adsorption occurs due to weak van der Waals forces that exist between the adsorbate gas molecules and the adsorbent surface area of the sample (Gelb & Gubbins, 1998; Naderi, 2015). The surface area was quantified 5 times, once before and 4 times throughout the leachate experiment. When the surface area, obtained by BET, is used in the calculation of leaching rates, it is assumed that all surfaces of the ash are available to be leached by the source water (Jeschke & Dreybrodt, 2002). Both geometric and BET‐derived surface areas can then be compared as a function of time and composition.
2.3. Column Leachate Tests
In order to understand how leaching rates are dependent on volcanic ash morphology and chemistry in the natural environment, column leachate tests (CLT) were completed to manipulate flow‐through conditions (Figure S1 in the supporting informaiton). CLT was chosen for this study rather than batch tests to allow the reaction to remain farther from equilibrium, as it would do in nature, and thus most realistically recreate natural conditions (Taylor, Blum, & Lasaga, 2000). Both steady state (which exists in CLT) and chemical equilibrium (which is reached in batch tests) may produce unchanging concentrations, but during chemical equilibrium the net reaction rate is approximately zero.
The constant flow of water in the CLT method prevents solution saturation state, and therefore chemical equilibrium, from being reached rapidly. Approximately 4–6 g of <200‐μm ash particles, unsieved (besides Kilauea), were used from each eruption for analysis. This provided many thousands of particles for a representative population in each ash sample. The ash samples were leached according to standard CLT methods described in the literature (e.g., Chichester & Landsberger, 1996; Jones & Gislason, 2008; Taylor, Blum, Lasaga, & MacInnis, 2000; Witham et al., 2005). The CLT was conducted in four identical BioSafe FEP Teflon tubes with an inner diameter of 0.46 cm and a length of 7.5 cm. Approximately 1–1.5 g of dry ash was inserted into each column and mass was recorded. Milli‐Q water was used as the leaching solute, and the columns rested in a thermostatic water bath of 25 ±0.2°C. The Milli‐Q source water passed through the columns at a rate of 0.28 ±0.1 ml/min, based on previous CLT studies (Cabré et al., 2016; Chichester and Landsberger, 2012; Escudey et al., 2014; Frogner et al., 2001; Taylor & Lichte, 1980; Witham et al., 2005). Columns were positioned vertically so that source water entered through the bottom of the column allowing any air pockets to escape. Each column had a 2 μm FEP (fluorinated ethylene propylene) Teflon filter at both the inlet and the outlet to prevent ash >2 μm from leaving the column. Four identical columns were set up simultaneously so that the experiment could be stopped at four different times. This allowed the ash to be characterized and surface area measured after 1 hr, 8 hr, 4 days, and 7 days. The leachate solution was collected every hour for the first 8 hr (two samples in the first hour), then every 12 hr after that for 4 days, then every 24 hr for another 3 days. Replicate columns allowed for 2–3 water samples from identical sample times.
2.4. Geochemical Analyses
In order to reveal when water was most influenced by volcanic leaching, and potentially unsafe for human or animal consumption, the water resulting from the CLT was prepared for geochemical analyses. Thirty‐four cation concentrations, including health related cations (Cd, Se, As, and Cr), were determined by inductively coupled plasma‐mass spectrometry. Ca, Mg, Na, Al, and Si were some of the cations that have been previously measured by this technique in leaching studies (Armienta et al., 2002; Bagnato et al., 2011; Jones & Gislason, 2008). Ion chromatography was used to measure anion concentrations including F, SO4 2−,and Cl. Once the geochemical concentrations were collected, the concentrations of the leachates from each eruption were compared.
Steady‐state, far from equilibrium, dissolution rates of halogens, sulfate, and major nutrients were calculated as a function of time using BET surface areas using
| (5) |
where C is the aqueous species concentration of the outlet solution, f r is the flow rate of the system, A is the specific or geometric surface area of the volcanic ash, and m is the initial mass of the sample (Wolff‐Boenisch et al., 2004). Previous studies assumed an invariant surface area when calculating dissolution rates, but in this study dissolution rates were calculated using the evolving BET surface area over the leaching experiment in order to improve the accuracy of the rates.
2.5. Experimental Uncertainties
Uncertainties in the determination of dissolution rates derive from various aspects of the experimental and computational aspects of the study, including some expected error sources in the solution concentration measurement and variations in the fluid flow rates. The errors inherent in measuring leachate concentrations do not exceed ± 10%. Fluid flow rate tended to decline over the week‐long experiment presumably due to compaction of the ash in the column and clogging of the frits, which led to a varying flow rate over the experiment. It is likely, however, that a similar process may occur in nature as ash deposited compacts over time. Uncertainties in elemental concentrations were greater for more dilute samples.
As it is very challenging to correctly recreate natural conditions in the laboratory, it is important to highlight the limitations of the experiment. As indicated in Witham et al. (2005), temperature, ratio of ash to water, flow rate, and ash density are all factors that vary in both leachate experiments and the natural environment. It is important to understand what is actually being tested. As these factors change so can the dissolution rates, therefore altering the applicability of laboratory analyses to the natural environment.
3. Results
3.1. Quantitative Assessment of Surface Area
Prior to the leaching, the four pristine ash samples were imaged and characterized by scanning electron microscope (SEM; Figure 1). The size distribution of the ashes is as follows, the majority of Redoubt ash particles are 5–10 μm, Turrialba are 5–20 μm, Eyjafjallajökull are 5–10 μm, and the Kilauea ash spherules are mostly >100 μm (Figure S2). Over the leachate experiment, the surface area of volcanic ash changed at different rates over the week depending on the nature of the ash (Figure 2). For all samples, BET measured specific surface areas were 2 to 3 orders of magnitude larger than geometric surface areas. The more silicic ashes (andesitic), such as Redoubt and Turrialba, had BET surface areas that increased then gradually decreased, whereas for the basaltic ashes, Kilauea and Eyjafjallajökull decreased then gradually increased over the week‐long experiment (Figure 2).
Figure 1.

Scanning electron microscope images of the four pristine, unhydrated ash samples prior to leaching. The left column of images shows a larger population view, while the right column shows one representative particle from each eruption: (a) Redoubt ash, (b) Turrialba ash, (c) Eyjafjallajökull ash, and (d) Kilauea ash. Redoubt ash is angular and has few preeruptive bubbles with some dust. The Turrialba ash is very dusty and has no obvious syneruptive bubbles. Eyjafjallajökull ash is irregularly shaped with some dust and contains preeruptive vesicles. Kilauea ash spherules contain few internal vesicles and are not generally dusty.
Figure 2.

(a) Geometric and Brunauer‐Emmett‐Teller (BET) surface area data for all ash samples over 1 week calculated and measured, respectively, in m2/g. Time is plotted in days. Geometric surface area is plotted on the primary (left) y‐axis, and BET surface area is plotted on the secondary (right) y‐axis, and time of the leaching experiment is on the x‐axis. For BET, andesitic ashes (Turrialba & Redoubt) show an initial increasing trend in surface area then gradual decrease, basaltic ashes (Eyjafjallajökull & Kilauea) show an initial decrease, and then gradual increase in surface area. Geometric surface area only incorporates particles >5 μm. These ashes generally show an initial increasing trend in surface area then gradual decrease over the remainder of the leaching experiment. (b) The same data shown over the first 9 hr.
The surface area of Redoubt ash increased from 1.17 to 1.35 m2/g over the first 8 hr, then fell to 1.16 m2/g over the rest of the week. There is a maximum surface area between the start of the experiment and four days later, but that point may be greater than 1.35 m2/g, reached at some time between measurements. Turrialba presented a similar trend where it increased from 7.46 to 20.6 m2/g over 8 hr, then decreased to 8.59 m2/g by the end of the leaching experiment. There is likely a surface area maximum that was not recorded between 8 hr and 4 days of the experiment. Previous studies that measured specific surface area of ash reported a range of <2 up to 10 m2/g (Delmelle et al., 2005; Langmann, 2013). Our results show that Turrialba measured twice this previous maximum, which may reflect the exceptionally large amount of dust and numerous small vesicles present in the analyzed ash. For the basaltic ashes, Eyjafjallajökull and Kilauea, the surface area initially decreased and then increased over the week‐long experiment. Eyjafjallajökull decreased from 3.33 to 0.83 m2/g over the first 8 hr then increased to 4.25 m2/g over the rest of the experiment. The comparison of BET measurements provides evidence that the ash used in this study, which produced an initial specific surface area of 3.3 m2/g, is more similar to the initial explosive ash (surface area of 4.3 m2/g) than the typical ash (surface area of 0.43 m2/g) analyzed in the 2011 study (Gislason et al., 2011). Kilauea ash had a similar trend of a decrease of 3.12 to 1.04 m2/g over the first 8 hr then increased to 3.02 m2/g over the rest of the 7‐day experiment.
3.2. Image Analysis of Surface Area
The trend seen in the BET surface areas of Redoubt and Turrialba ashes, initially increasing, then decreasing, is also seen with geometrically calculated surface areas. Measured particle size distribution allowed for a visible representation of how the population of particles was changing over time (Figure S2). This aided in calculating geometric surface areas. For most samples, there was an initial increase in geometric surface area over the first 1–8 hr of the experiment (Figure 2).
Turrialba ash surface area increased from 0.026 to 0.11 m2/g over the first 8 hr, then decreased to 0.058 m2/g over the week. Redoubt increased from 0.007 to 0.027 m2/g over the first hour, then decreased to 0.008 m2/g over the next 8 hr. The surface area of Redoubt ash increased to 0.021 m2/g at 4 days before decreasing to 0.007 m2/g by the end. Eyjafjallajökull increased from 0.015 to 0.06 m2/g over the first hour before decreasing to 0.035 m2/g by the end of the experiment. The Kilauea ash did not share the same trend as the other samples as its surface area varied only by 0.003 m2/g over the leaching experiment, most likely due to its unique morphology, ranging from 0.013 to 0.016 m2/g. The spherules do not have angular edges or significant dust, minimizing readily dissolvable surfaces with a favorable hydrodynamic shape where water can easily flow over and around the particles.
Imagery from the SEM clearly reveals particle alteration throughout the leaching experiment. Turrialba is a useful example to understand the effect of surface area on dissolution rates since there is a significant change in the specific surface area over the leaching experiment (Figure 3).
Figure 3.
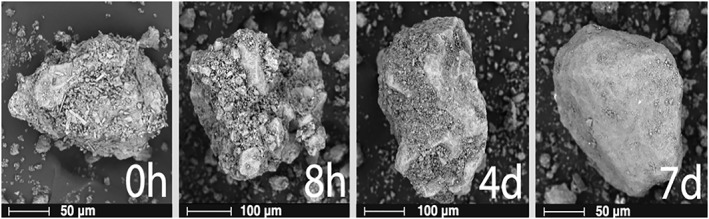
Scanning electron microscope images of Turrialba ash throughout the leaching experiment at four different time intervals: initially, post 8 hr, post 4 days, and post 7 days. This time series demonstrates the “balding effect,” which consists of the disaggregation and dissolution of the dust particles into the leachate.
Figure 3 shows SEM images of Turrialba particles throughout the leaching experiment. The first image shows an unhydrated ash particle before leaching. The surface of the ash particle is covered in dust. The second image shows a particle after it had been leached for eight hours. The small dusty pieces are less apparent, and some of the surface complexities, such as small ash nodules that are likely held on by NaCl bonds, are revealed as the ash begins to disaggregate. The process of disaggregation disconnects some of the dust from the ash surface and thus increases overall surface area per mass. After 4 days, some bare surfaces were revealed, while smaller particles lingered in the crevices. After 7 days, some surfaces were bare of the dust, decreasing the overall surface area per mass. This “balding” effect that occurred in this SEM time series was not seen with all particles but was prevalent enough to explain the measured and calculated trends in surface area. Once the ash particles were stripped of the surface dust (“balding”), overall surface area decreased because at least some of the dust was completely dissolved or otherwise left the system through the end cap filters. This pattern also occurs with Redoubt and Eyjafjallajökull ash samples, but Turrialba is the best model to visualize the change in surface area due to its high dust content. In comparison, Pele's spherules from Kilauea weathered uniquely. Some of the outer shells of the spherules fractured in a mud‐crack pattern (Figure S3).
3.3. Chemistry
Over the leachate experiment, the ashes from all analyzed eruptions released halogens (F and Cl), sulfate (SO4 2−), nutrients (Ca, Mg, Fe, Mn, etc.), and heavy metals (Pb, As, Cd, Al, and Ti) into the source water (see Data Set S1 in the supporting information). The mass concentrations of SO4 2−, Cl, and F from this study aligned closely with the chemistry from other studies (Jones & Gislason, 2008; Witham et al., 2005). The leachate water did not contain any particles, indicating that dust smaller than the 2‐μm end cap frit that entered the leachate must have completely dissolved in the outlet solution within the time of the experiment. The greatest initial concentrations of ions were released into the Milli‐Q water within the first half hour of the leachate experiment, including SO4 2− (≤38,900 μmol/kg), Mg (≤19,400 μmol/kg), Al (≤14,900 μmol/kg), Ca (≤13,500 μmol/kg), F (≤4,050 μmol/kg), Na (≤3,010 μmol/kg), and Cl (≤3,010 μmol/kg; Figure 4). Figure 4 shows concentration, flow rate data, and dissolution rates for the major elements released by each eruption.
Figure 4.

Concentrations (μmol/kg), flow rates (ml/min), and dissolution rates (mol/m2 s) of major elements from all volcanic ash samples against time (days) over the week‐long experiment. (a) Redoubt, (b) Turrialba, (c) Eyjafjallajökull, and (d) Kilauea. Rapid initial decay in concentration and dissolution rate seen in all samples. Two chemical populations seen in Kilauea and potentially in Turrialba. The inset figures show the same data over the first nine hours.
The initial leachate samples (i.e. volcanic ash with source water) revealed an initial decrease in pH then a slight increase over the rest of the experiment (Figure 5).
Figure 5.

(a) pH of volcanic ash leachates for all samples over the week‐long leaching experiment plotted against time in days. There is an initial decrease in all samples and then a gradual increase towards a neutral pH towards the end of the week. This provides evidence for the dissolution of the acid magmatic gases which initially dissociate to lower pH. (B) The data over the first 9 hr.
Ash leachate from Eyjafjallajökull underwent the greatest change in pH over the time series, starting at a pH of 8.0 before plunging to a pH of 4.8 after 5 hr. Turrialba dropped to the lowest pH of the samples at 3.3 after 3 days but then increased to 5.5. With slight differences in timing, trends in pH are similar for Kilauea and Redoubt.
Regardless of the ion, dissolution rate had an initial rapid decay. Some ions reached steady state over the week (e.g., Ca, Al, Na, and K in the Eyjafjallajökull leaching record), whereas others did not (e.g., Al in the Eyjafjallajökull and the Kilauea leaching record and Na in the Redoubt leaching record; Figure 4).
The fastest dissolution rates of various ions resulted from the Turrialba samples, which had the greatest surface area. Ash with the highest surface areas and most dust were expected to have the greatest number of leaching surfaces and therefore the highest dissolution rates. Taking changing surface area into consideration when calculating dissolution rates is of greater importance for dusty samples, which have a broader size distribution of particles, and whose surface area changes more dramatically over time as a result of disaggregation and dissolution of dust. After the leaching experiment had been completed for some time, the leached Turrialba water precipitated gypsum.
3.4. Health Implications
The range of heavy metals that are released into the environment by leaching of ash can be detrimental to human and animal health. Initial accumulated concentrations after 1 hr were calculated and are shown in Figure 6 for ashes for each of the eruptions studied. Initial accumulations (after 1 hr) of F (≤2,430 μmol/kg), Cu (≤40.4 μmol/kg), Cd (≤3.83 μmol/kg), Cr (≤0.96 μmol/kg), Se (≤0.20 μmol/kg), and As (≤0.13 μmol/kg) are the main elements of health concern for these ashes. Some of the accumulated concentrations are above the World Health Organization (WHO) standards for safe drinking water (Figure 6). Kilauea ash, the basaltic chemical end‐member, and Turrialba ash, the surface area end‐member, are consistently the ashes leaching the highest concentrations of harmful species.
Figure 6.

Accumulated concentrations (μmol/kg) of health‐relevant elements (As, Cd, Cr, Cu, F, and Se) after 1 hr of leaching. The solid black line represents the WHO upper limit for safe drinking water standards. Kilauea, the chemical (basaltic) end‐member, and Turrialba, the surface area end‐member, consistently leach the highest concentrations.
The WHO standard for fluoride in drinking water is 79 μmol/kg. The accumulated concentration of F exceeded the safe drinking standards by all eruptions except Redoubt (Figure 7). The leachate from Kilauea ash resulted in the greatest total F accumulation (≤7,890 μmol/kg), followed by Turrialba (≤305 μmol/kg), Eyjafjallajökull (≤214 μmol/kg), then Redoubt (≤38.8 μmol/kg). The highest concentrations are once again from the chemical and surface area end‐members, Kilauea and Turrialba, respectively. Pure basaltic ash (Kilauea) released a higher amount of fluoride than andesitic or andesitic‐basaltic ash.
Figure 7.
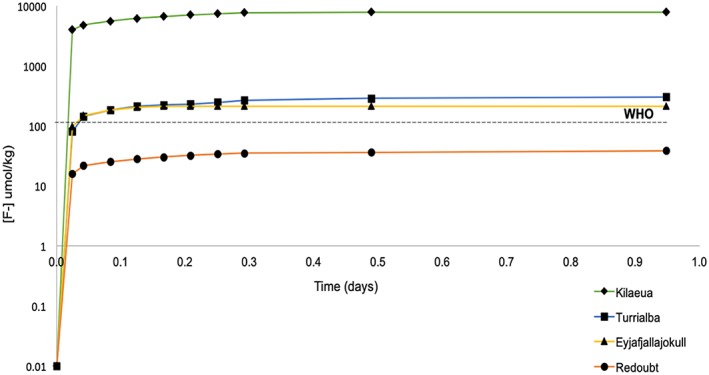
Accumulated fluoride concentrations (μmol/kg) over the first day of the leaching experiment for all ash samples. The World Health Organization (WHO) dashed line marks the upper limit for safe drinking water. Kilauea, the chemical (basaltic) end‐member, and Turrialba, the surface area end‐member, leach the highest concentration of fluoride.
3.5. Pele's Spheres
A dozen spherules from Kilauea were mounted in epoxy and polished to expose the interiors of the spherules (Figure S4). In a previous study, Pele's tears (~5 mm long) from Kilauea were exposed in epoxy to observe the interior and it was reported that the tears contain spherical vesicles that are evenly distributed throughout the body of the particles, but not at the margins, which have fewer, smaller vesicles (Porritt et al., 2012). The observations of the spherules in this study did not entirely agree with the previous results of Pele's tears. These spherules' interiors revealed nonuniform complexities. While all the internal vesicles were spherical, some spherules had large interior vesicles whereas others lacked vesicles entirely. The number density of vesicles in the center of the spherules was no greater than near the margins of the particles. Because the interior vesicles were observed to be intact and not connected to each other or to particle surfaces, they were not considered to play a role in either effective surface area or leaching rates. Only the outer spherical surface was involved in leaching.
4. Discussion
4.1. Trends in BET and Geometric Surface Areas
Based on the results of this study, volcanic ash morphology and chemical composition both affect dissolution rates of ions into the environment. Surface area of the volcanic ash over the leachate experiment was measured by BET analysis and calculated geometrically. These two methods provide the end‐members of a range of surface areas that could be relevant to leaching rates in nature. While measured BET surface areas are likely an overestimate of natural conditions, calculated geometric surface areas are a gross underestimate of surface area. Thus, the surface areas of volcanic ash in natural environments are bracketed by the measured and calculated ranges of BET and geometric surface areas.
The BET technique is based on a measurement of Kr gas adsorption onto solid surfaces, normalized by sample mass. The BET‐measured surface areas are much larger due to the incorporation of external complexities of the ash such as vesicle imprints and especially dust, as well as internal complexities such as networks of interconnected vesicles that make the particles porous and permeable to krypton gas (but not necessarily to water). In BET analysis, Kr is drawn into particle interiors under vacuum, but there are no such conditions in nature where water is far more viscous than Kr gas. The BET measured surface areas were 2 to 3 orders of magnitude larger than geometric surface areas. The BET measured surface areas are still considered a better estimate than geometric surface areas due to the incorporation of surface complexities (especially dust), which have a significant control on dissolution rates (Jeschke & Dreybrodt, 2002). Previous studies have nevertheless used geometric surface area to calculate rates (e.g., Wolff‐Boenisch et al., 2004; equation (3)), assuming a homogeneous particle size distribution (equal counts of all sizes) and a spherical particle shape. In this study, we observed a wide range of particle sizes with a far greater number density in smaller sizes (Figure S2), and the ash particles are far from spherical, except for the Kilauea spherules.
Using geometric and BET surface area trends, the surface area of the ash particles during the leaching experiment is observed to initially increase rapidly, decrease for some time, and then eventually increase. This trend is likely explained by initial disaggregation of the ash, followed by dissolution, followed by weathering of the ash particles. If the trend was extrapolated past the measured time, it would be expected that the surface area would continue to increase due to the continued dissolution and shrinking of ash particles and therefore decreasing mass more quickly than surface area. The observed temporal pattern in BET surface area for basaltic and andesitic ashes seems to differ (Figure 2). Basaltic ash surface area decreased and then increased, while the andesitic ash increased and then decreased. However, upon closer investigation, it appears that these ashes likely follow the same pattern, but they do so over different time scales. The basaltic ash surface areas are expected to have changed on a much shorter time‐scale, so that the initial increase in surface area may have occurred before the first hour of leaching completes and begins to decrease after the first hour of the leaching (Figure 2). This inferred initial increase is not shown in the BET record due to the coarse temporal resolution of surface area data. The inferred rapid change occurs because basaltic material weathers faster than andesitic material.
The initial increase in surface area, reflected in both the BET data for andesitic ashes and the geometric surface area data, is interpreted to represent the initial disaggregation of the dust and small particles that are attached to larger particles. The bonds allowing ash particles to aggregate are potentially a combination of electrostatic forces and liquid bonds. Since some of the dust remains on the surface of the ash particles throughout the entire leaching experiment, the bonds adhering the dust to the particle are likely to be liquid bonds (NaCl bridges). Additional evidence for liquid bonds over electrostatic bonds is that when the particles were analyzed under the SEM, the electron beam did not destroy the bonds and cause the dust to move. After some time, depending on the sample, the initial dissolution of Na and Cl released some of the liquid salt‐bonds that adhered dust to the surface of the ash particle (Brown et al., 2012; Mueller et al., 2016). As these bonds were partially dissolved by the water, some dust became loose. This loose dust increased overall surface area per mass, seen as the initial increase in surface area in the geometric surface areas for all samples and for the BET surface areas for andesitic samples (again, it likely exists for the basaltic ashes but is not seen in the coarse resolution surface area record). Overall surface area increased and mass remained constant, which caused the overall surface area to mass ratio to increase. The liquid‐bonds (NaCl bridges) continued to dissolve over the week creating the balding effect (complete disaggregation) that is seen in the SEM images of Turrialba ash (Figure 3). The smallest dust particles, which detached from the larger particles, are preferentially dissolved into the leachate. Small dust particles contribute a great deal of surface area per mass, but as soon as they dissolve completely, their contribution to surface area is eliminated, and thus, surface area to mass ratio rapidly decreases. Meanwhile, larger particles continue to shrink, thus increasing the overall surface area to mass ratio. As such, the observed trends in surface area are interpreted as follows: surface area increases initially due to disaggregation, then decreases due to complete dissolution of dust, then increases again due to size reduction (weathering) of the remaining ash particles. The details of this and is implications for leaching and consequent health impacts would be interesting to explore in subsequent studies. The BET method of analyzing surface area is critical to understand this process because this method accounts for the entire range of particle sizes.
4.2. Metal Salts and Glass Dissolution
Results of this study indicate that dissolution rates of certain cations decayed rapidly (e.g., Ca, Al, and K in the Eyjafjallajökull leaching record and K in the Kilauea leaching record), reaching a slow and steady state dissolution rate after about three hours of the experiment (Figures 4c and 4d). In part, the rapid decay in rate can be attributed to the soluble metal salts (which can be strong acids) on the particles' surfaces that dissolve into water and dissociate to reduce pH (Frogner et al., 2001; Jones & Gislason, 2008; Óskarsson, 1980; Smith et al., 1982). Evidence of acid formation can be seen in the initial drop in the pH record (Figure 5). It can also be seen in the chemical populations evident in the Kilauea and Turrialba records (Figure 4). High initial surface areas of fresh leachable surfaces also contribute to the initial rapid decay of rates. Dust on the particle's surfaces initially provides a large amount of surface area to be leached. There is evidence that high surface area has a stronger control on the rapid decay (and therefore dissolution rates), than soluble metal salts, as there is a large number density of small particles (less than 20 μm) contributing to surface area. This is in contrast to the presence of metal salts on the ash particles for which there is only strong evidence for the dissolution for a second population of chemical interactions (metal salts versus glasses) for Kilauea. Once the surface dust is leached and there are no more readily available leachable surfaces, many ions reach steady state. During the initial period of rapid leaching (first hour), surface area increases due to disaggregation. However, disaggregation continues far longer than the initial rapid leaching event. The decrease in leaching rate due to depletion of leachable ions from grain surfaces exceeds the addition of new surface area for leaching provided by disaggregation.
Although some dissolution rates reach a background steady state rapidly, there are some small variations on the longer‐term, week‐long scale (Figure 4). Some of these variations can be attributed to flow rate. Flow rate slowed for all samples, sometimes from initial conditions of ~3 ml/min to as low as ~0.05 ml/min. Similar variations of the flow rate have been reported in related studies (Jones & Gislason, 2008).
4.3. Environmental Contamination and Fertility Implications
As a result of rapid leaching from freshly deposited ash, there is potential for short‐term flora and fauna poisoning from contaminated water and soils. Dissolution rate is greatest immediately upon contact with water, so the greatest impact would occur during the first rain event after deposition or initial deposition into surface water. Ions detrimental to human health present in the ash‐leachates include F, Cu, Cd, Cr, As, and Se, which if consumed in sufficient amounts can potentially lead to cancer, kidney damage, and skeletal and dental fluorosis (Stewart et al., 2006). While at most times throughout the leaching experiment conducted in this study, the concentrations of ions (Cu, Cd, Cr, As, and Se) fell below the WHO standards for safe drinking water, in the natural environment, ions accumulate from past and future eruptions and may magnify to unsafe concentrations. Therefore, there may be a significant health risks in active volcanic regions and water should be monitored for toxic levels from previous, current, and future eruptions.
Fluoride provides an excellent example of potential water contamination by ash leachates, particularly from basaltic Kilauea ash in this study. The WHO standard for fluoride in drinking water is 79 μmol/kg. In this study, this level was exceeded by leachate from all eruptions except Redoubt. There is significantly more F present in the basaltic Kilauea ash. High levels of F can potentially harm humans and animal tissue, as chronic exposure to F leads to skeletal and dental fluorosis. This should be seriously considered in volcanic regions, especially in Hawaii and other areas subject to basaltic ash leaching. We also see a high amount of F in the more silicic Turrialba ash. Independent of chemical composition of ash, fluoride has consistently proven to be a significant health concern in volcanic regions (Armienta et al., 2011; Stewart et al., 2006).
Although toxic waters can lead to poisoning of flora and fauna, the ash leachates also release nutrients such as N, P, K, Mg, Ca, and Fe that can lead to long‐term fertilization in soils and short‐term fertilization in the ocean. In the ocean, nutrients are rapidly consumed by phytoplankton since Fe is often a limiting nutrient in the ocean (van Creveld et al., 2016). Although it has been shown that an eruption can provide a concentrated release of Fe, the benefits will not last long after the supply of ash ceases. In soils, bioaccumulation of Mg, Ca, and K allows the nutrients to remain in the area. This is seen in the formation of fertile volcanic soils, which are used to grow important crops such as coffee.
The environmental impacts reported in this study can be interpreted as an analog to natural conditions. The flow rate of 0.3 ml/min through the column used in this study corresponds to a percolation rate into the soils of 16 mm/hr. This is comparable to measured rates in the field near Turrialba volcano, which ranged from ~10–30 mm/hr (Toohey et al., 2018). Steady flow through a column best represents soil percolation or initial ash deposition into surface water. This is more realistic than batch experiments, which would represent a static body of water that has no inflow or outflow.
5. Conclusions
This study concluded that the rate of leaching into the environment is controlled by both physical (ash morphology, i.e., surface area) and chemical (composition) characteristics of volcanic ash. When exposed to water, volcanic ash has a rapid initial dissolution rate due to both a high number density of small particles and metal salts, which may decay to a background steady state dissolution rate in less than an hour (e.g., Ca, Al, and K in the Eyjafjallajökull leaching record). Some ion dissolution rates from the analyzed glasses occurred over a longer period and did not reach steady state within the week‐long experiment (e.g., Al in the Eyjafjallajökull and Kilauea leaching record and Na in the Redoubt leaching record; Figure 4). Surface area was measured by BET and calculated geometrically. The dissolution rates calculated with BET surface area were more representative of natural conditions due to the inclusion of external and internal particle complexities. On this basis, the measured change in surface area for basaltic ashes occurred on a shorter time scale than the andesitic ashes. This suggests that populations surrounding volcanoes typically erupting basaltic ash may have a more intense, yet shorter‐lived exposure hazard than those living near more silicic volcanoes.
Chemically, although both the andesitic and basaltic ashes leach a wide range of ions, in this study it was found that basaltic ash from Hawaii leaches the greatest concentration of fluoride, although the fluoride from the dusty Turrialba ash was significant as well. These high levels of fluoride exceed the WHO standard for safe drinking water and pose a serious threat to both livestock and humans who may consume this water.
The experimental results from the CLT can inform new and previous volcanic leachate models (e.g., Stewart et al., 2006) and provide a basis for assessing environmental impacts of a chemically broader range of volcanic eruptions around the world. Models can lead to better preparation for, and mitigation of, the impacts of surface water contamination from current and future eruptions.
The role of volcanic dust is an important factor revealed in this study that is still not well understood. It would be advantageous to understand how far into the particle's interior water penetrates under natural conditions and thus, how much surface area is available to leach over time. It would also be instructive to perform the methods developed in this study on highly vesicular, unhydrated rhyolitic ash. Fresh ash of this sort is very difficult to obtain due to the explosive, dangerous, and infrequent nature of eruptions that produce it, and none have occurred during the term of this project. Hopefully, it will be possible to address these questions in future studies to better understand the geochemical influence of a range of ash compositions and surface areas on the ecosystem and thus provide an improved understanding of the influences of volcanic ash on marine and terrestrial ecosystems as well as animal and human health.
Conflict of Interest
The authors declare no conflicts of interest relevant to this study.
Supporting information
Supporting Information S1
Data Set S1
Data Set S2
Acknowledgments
This research was partially supported by Lehigh University College of Arts and Sciences, Lehigh University's Earth and Environmental Science Department, and the National Science Foundation grant EAR‐16503369. The authors are grateful to Don Swanson, Gino González, and Joe Liccardi for collecting and providing pristine ash samples for analysis and to Tamara Carley and Karen Hudson‐Edwards for their insightful reviews of the original manuscript. Data presented in this paper can be accessed in Data Set S1 and S2 of the supporting information.
Wygel, C. M. , Peters, S. C. , McDermott, J. M. , & Sahagian, D. L. (2019). Bubbles and dust: Experimental results of dissolution rates of metal salts and Glasses From volcanic ash deposits in terms of surface area, chemistry, and human health impacts. GeoHealth, 3, 338–355. 10.1029/2018GH000181
References
References
- Achterberg, E. P. , Moore, C. M. , Henson, S. A. , Steigenberger, S. , Stohl, A. , Eckhardt, S. , Avendano, L. C. , Cassidy, M. , Hembury, D. , Klar, J. K. , Lucas, M. I. , Macey, A. I. , Marsay, C. M. , & Ryan‐Keogh, T. J. (2013). Natural iron fertilization by the Eyjafjallajökull volcanic eruption. Geophysical Research Letters, 40, 921–926. 10.1002/grl.50221 [DOI] [Google Scholar]
- Araya, O. , Wittwer, F. , Villa, A. , & Ducom, C. (1990). Bovine fluorosis following volcanic activity in the southern Andes. Veterinary Record, 126(26), 641–642. ISSN: 0042‐4900 [PubMed] [Google Scholar]
- Armienta, M. A. , De la Cruz‐Reyna, S. , Cruz, O. , Ceniceros, N. , Aguayo, A. , & Marin, M. (2011). Fluoride in ash leachates: environmental Environmental implications at Popocatépetl volcano, central Mexico. Natural Hazards and Earth System Sciences, 11(7), 1949–1956. 10.5194/nhess-11-1949-2011 [DOI] [Google Scholar]
- Armienta, M. A. , De la Cruz‐Reyna, S. , Morton, O. , Cruz, O. , & Ceniceros, N. (2002). Chemical variation of tephra‐fall deposit leachates for three eruptions from Popocatépelt volcano. Journal of Volcanology and Geothermal Research, 113(1‐2), 61–80. 10.1016/S0377-0273(01)00251-7 [DOI] [Google Scholar]
- Attal, M. , & Lavé, J. (2009). Pebble abrasion during fluvial transport: Experimental results and implications for the evolution of the sediment load along rivers. Journal of Geophysical Research, 114, F04023 10.1029/2009JF001328 [DOI] [Google Scholar]
- Bagnato, E. , Aiuppa, A. , Andronico, D. , Cristaldi, A. , Liotta, M. , Brusca, L. , & Miraglia, L. (2011). Leachate analyses of volcanic ashes from Stromboli volcano: A proxy for the volcanic gas plume composition? Journal of Geophysical Research, 116, D17204 10.1029/2010JD015512 [DOI] [Google Scholar]
- Baxter, P. J. , & Ancia, A. (2002). Human Health and Vulnerability in the Nyiragongo Volcano Crisis Democratic Republic of Congo, 2002. Acta Vulcanologica, 14(1–2), 109–114. [Google Scholar]
- Bosshard‐Stadlin, S. A. , Mattsson, H. B. , Stewart, C. , & Reusser, E. (2017). Leaching of lava and tephra from the Oldoinyo Lengai volcano (Tanzania): Remobilization of fluorine and other potentially toxic elements into surface waters of the Gregory Rift. Journal of Volcanology and Geothermal Research, 332, 14–25. 10.1016/j.jvolgeores.2017.01.009 [DOI] [Google Scholar]
- Brantley, S. , White, A. , & Hodson, M. (1999). Surface area of primary silicate minerals In Meakin B. P. (Eds.), Growth, Dissolution dissolution and Pattern pattern Formation formation in Geogeo‐systems (Chap. 14, pp. 291–326). London: Chapman & Hall; 10.1007/978-94-015-9179-9_14 [DOI] [Google Scholar]
- Brown, R. J. , Bonadonna, C. , & Durant, A. J. (2012). A review of volcanic ash aggregation. Physics and Chemistry of the Earth, 45–46, 65–78. 10.1016/j.pce.2011.11.001 [DOI] [Google Scholar]
- Browning, T. J. , Stone, K. , Bouman, H. A. , Mather, T. A. , Pyle, D. M. , Moore, C. M. , & Martinez‐Vicente, V. (2015). Volcanic ash supply to the surface ocean: remote sensing of biological responses and their wider biogeochemical significance. Frontiers in Marine Science, 2(March), 1–22. 10.3389/fmars.2015.00014 [DOI] [Google Scholar]
- Cabré, J. , Aulinas, M. , Rejas, M. , & Fernandez‐Turiel, J. L. (2016). Volcanic ash leaching as a means of tracing the environmental impact of the 2011 Grímsvötn eruption, Iceland. Environmental Science and Pollution Research, 23(14), 14,338–14,353. 10.1007/s11356-016-6559-7 [DOI] [PubMed] [Google Scholar]
- Cangemi, M. , Speziale, S. , Madonia, P. , D'Alessandro, W. , Andronico, D. , Bellomo, S. , Brusca, L. , & Kyriakopoulos, K. (2017). Potentially harmful elements released by volcanic ashes: Examples from the Mediterranean area. Journal of Volcanology and Geothermal Research, 337, 16–28. 10.1016/j.jvolgeores.2017.03.015 [DOI] [Google Scholar]
- Chichester, D. L. , & Landsberger, S. (1996). Determination of the leaching dynamics of metals from municipal solid waste incinerator fly ash using a column test. Journal of the Air and Waste Management Association, 46(7), 643–649. 10.1080/10473289.1996.10467498 [DOI] [PubMed] [Google Scholar]
- Cioni, R. , Pistolesi, M. , Bertagnini, A. , Bonadonna, C. , Hoskuldsson, A. , & Scateni, B. (2014). Insights into the dynamics and evolution of the 2010 Eyjafjallajökull summit eruption (Iceland) provided by volcanic ash textures. Earth and Planetary Science Letters, 394(May 2010), 111–123. 10.1016/j.epsl.2014.02.051 [DOI] [Google Scholar]
- Clague, D. A. , Hagstrum, J. T. , Beeson, M. H. , & Champion, D. E. (1999). Kilauea summit overflows: Their ages and distribution in the Puna District, Hawaii. Bulletin of Volcanology, 61(6), 363–381. 10.1007/s004450050279 [DOI] [Google Scholar]
- Coombs, M. L. , Bleick, H. A. , Cervelli, P. F. , Bull, K. F. , & Wessels, R. L. (2013). Volcano‐ice interactions precursory to the 2009 eruption of Redoubt Volcano, Alaska. Journal of Volcanology and Geothermal Research, 259, 373–388. 10.1016/j.jvolgeores.2012.10.008 [DOI] [Google Scholar]
- Cordeiro, S. , Coutinho, R. , & Cruz, J. V. (2012). Fluoride content in drinking water supply in São Miguel volcanic island (Azores, Portugal). Science of the Total Environment, 432, 23–36. 10.1016/j.scitotenv.2012.05.070 [DOI] [PubMed] [Google Scholar]
- Cronin, S. J. , Hedley, M. J. , Neall, V. E. , & Smith, R. G. (1998). Agronomic impact of tephra fallout from the 1995 and 1996 Ruapehu Volcano eruptions, New Zealand. Environmental Geology, 34(1), 21–30. 10.1007/s002540050253 [DOI] [Google Scholar]
- Cronin, S. J. , Neall, V. E. , Lecointre, J. A. , Hedley, M. J. , & Loganathan, P. (2003). Environmental hazards of fluoride in volcanic ash: A case study from Ruapehu volcano, New Zealand. Journal of Volcanology and Geothermal Research, 121(3–4), 271–291. 10.1016/S0377-0273(02)00465-1 [DOI] [Google Scholar]
- Cronin, S. J. , & Sharp, D. S. (2002). Environmental impacts on health from continuous volcanic activity at Yasur (Tanna) and Ambrym, Vanuatu. International Journal of Environmental Health Research, 12(2), 109–123. 10.1080/09603120220129274 [DOI] [PubMed] [Google Scholar]
- Cronin, S. J. , Stewart, C. , Zernack, A. V. , Brenna, M. , Procter, J. N. , Pardo, N. , Christenson, B. , Wilson, T. , Stewart, R. B. , & Irwin, M. (2014). Volcanic ash leachate compositions and assessment of health and agricultural hazards from 2012 hydrothermal eruptions, Tongariro, New Zealand. Journal of Volcanology and Geothermal Research, 286, 233–247. 10.1016/j.jvolgeores.2014.07.002 [DOI] [Google Scholar]
- De Moor, J. M. , Aiuppa, A. , Avard, G. , Wehrmann, H. , Dunbar, N. , Muller, C. , Tamburello, G. , Giudice, G. , Liuzzo, M. , Moretti, R. , Conde, V. , & Galle, B. (2016). Turmoil at Turrialba Volcano (Costa Rica): Degassing and eruptive processes inferred from high‐frequency gas monitoring. Journal of Geophysical Research: Solid Earth, 121, 5761–5775. 10.1002/2016JB013150.Received [DOI] [PMC free article] [PubMed] [Google Scholar]
- Delmelle, P. , Villiéras, F. , & Pelletier, M. (2005). Surface area, porosity and water adsorption properties of fine volcanic ash particles. Bulletin of Volcanology, 67, 160–169. 10.1007/s00445-004-0370-x [DOI] [Google Scholar]
- Di Piazza, A. , Rizzo, A. L. , Barberi, F. , Carapezza, M. L. , De Astis, G. , Romano, C. , & Sortino, F. (2015). Geochemistry of the mantle source and magma feeding system beneath Turrialba volcano, Costa Rica. Lithos, 232, 319–335. 10.1016/j.lithos.2015.07.012 [DOI] [Google Scholar]
- Durant, A. J. , Villarosa, G. , Rose, W. I. , Delmelle, P. , Prata, A. J. , & Viramonte, J. G. (2012). Long‐range volcanic ash transport and fallout during the 2008 eruption of Chaitén volcano, Chile. Physics and Chemistry of the Earth, 45–46, 50–64. 10.1016/j.pce.2011.09.004 [DOI] [Google Scholar]
- Escudey, M. , Arancibia‐Miranda, N. , Pizarro, C. , & Antilén, M. (2014). Effect of ash from forest fires on leaching in volcanic soils. Catena, 135, 383–392. 10.1016/j.catena.2014.08.006 [DOI] [Google Scholar]
- Flaathen, T. K. , & Gislason, S. R. (2007). The effect of volcanic eruptions on the chemistry of surface waters: The 1991 and 2000 eruptions of Mt. Hekla, Iceland. Journal of Volcanology and Geothermal Research, 164(4), 293–316. 10.1016/j.jvolgeores.2007.05.014 [DOI] [Google Scholar]
- Frogner Kockum, P. C. , Herbert, R. B. , & Gislason, S. R. (2006). A diverse ecosystem response to volcanic aerosols. Chemical Geology, 231(1–2), 57–66. 10.1016/j.chemgeo.2005.12.008 [DOI] [Google Scholar]
- Frogner, P. , Gíslason, S. R. , & Óskarsson, N. (2001). Fertilizing potential of volcanic ash in ocean surface water. Geology, 29(6), 487–490. 10.1130/0091-7613(2001)029<0487:FPOVAI>2.0.CO [DOI] [Google Scholar]
- Gautier, J.‐M. , Oelkers, E. , & Schott, J. (2001). Are quartz dissolution rates proportional to BET surface areas? Geochimica et Cosmochimica Acta, 65(7), 1059–1070. 10.1016/S0016-7037(00)00570-6 [DOI] [Google Scholar]
- Gelb, L. D. , & Gubbins, K. E. (1998). Characterization of porous glasses: Simulation models, adsorption isothermsPorous Glasses: Simulation Models, Adsorption Isotherms, and the Brunauer‐Emmett‐Teller Analysis Method. Langmuir, 14(8), 2097–2111. 10.1021/la9710379 [DOI] [Google Scholar]
- Genareau, K. , Cronin, S. J. , Stewart, C. , Bhattacharyya, S. , & Donahoe, R. (2016). Posteruptive impacts of pyroclastic deposits from basaltic andesite stratovolcanoes on surface water composition. Journal of Geophysical Research: Biogeosciences, 121, 1275–1287. 10.1002/2015JG003316 [DOI] [Google Scholar]
- Genareau, K. , Mulukutla, G. K. , Proussevitch, A. A. , Durant, A. J. , Rose, W. I. , & Sahagian, D. L. (2013). The size range of bubbles that produce ash during explosive volcanic eruptions. Journal of Applied Volcanology, 2(1), 4 10.1186/2191-5040-2-4 [DOI] [Google Scholar]
- Genareau, K. , Proussevitch, A. , Durant, A. , Mulukutla, G. , & Sahagian, D. (2012). Sizing up the bubbles that produce very fine ash during explosive volcanic eruptions. Journal of Geophysical Research, 39, L15306 10.1029/2012GL052471 [DOI] [Google Scholar]
- Genareau, K. , Wardman, J. B. , Wilson, T. M. , McNutt, S. R. , & Izbekov, P. (2015). Lightning‐induced volcanic spherules. Geology, 43(4), 319–322. 10.1130/G36255.1 [DOI] [Google Scholar]
- Gislason, S. R. , Hassenkam, T. , Nedel, S. , Bovet, N. , Eiriksdottir, E. S. , Alfredsson, H. A. , Hem, C. P. , Balogh, Z. I. , Dideriksen, K. , Oskarsson, N. , Sigfusson, B. , Larsen, G. , & Stipp, S. L. S. (2011). Characterization of Eyjafjallajokull volcanic ash particles and a protocol for rapid risk assessment. Proceedings of the National Academy of Sciences, 108(18), 7307–7312. 10.1073/pnas.1015053108 [DOI] [PMC free article] [PubMed] [Google Scholar]
- Horwell, C. J. , Sparks, R. S. J. , Brewer, T. S. , Llewellin, E. W. , & Williamson, B. J. (2003). Characterization of respirable volcanic ash from the Soufrière Hills volcano, Montserrat, with implications for human health hazards. Bulletin of Volcanology, 65(5), 346–362. 10.1007/s00445-002-0266-6 [DOI] [Google Scholar]
- Ivhhn.org . (2018). The International Volcanic Health Hazard Network (IVHHN), http://www.ivhhn.org/, http://ivhhn.org/information/health-impacts-volcanic-ash
- Jeschke, A. A. , & Dreybrodt, W. (2002). Dissolution rates of minerals and their relation to surface morphology. Science, 66(17), 3055–3062. [Google Scholar]
- Jones, M. T. , & Gislason, S. R. (2008). Rapid releases of metal salts and nutrients following the deposition of volcanic ash into aqueous environments. Geochimica et Cosmochimica Acta, 72(15), 3661–3680. 10.1016/j.gca.2008.05.030 [DOI] [Google Scholar]
- Langmann, B. (2013). Volcanic ash versus mineral dust: Atmospheric processing and environmental and climate impacts. ISRN Atmospheric Sciences, 2013(ii), 1–17. 10.1155/2013/245076 [DOI] [Google Scholar]
- Madonia, P. , Cangemi, M. , Bellomo, S. , & D'Alessandro, W. (2013). Influence of volcanic activity on the quality of water collected in roof water catchment systems at Stromboli Island (Italy). Journal of Geochemical Exploration, 131, 28–36. 10.1016/j.gexplo.2012.08.018 [DOI] [Google Scholar]
- Millaleo, R. , Reyes‐ Diaz, M. , Ivanov, A. , Mora, M. , & Alberdi, M. (2010). Manganese as essential and toxic element for plants: Transport, accumulation and resistance mechanisms. Journal of Soil Science and Plant Nutrition, 10(4), 470–481. 10.4067/S0718-95162010000200008 [DOI] [Google Scholar]
- Moen, W.S. , & McLucas, G.B. , (1980). Mount St. Helens ash: Properties and possible uses. Report of Investigation, vol. 24. Washington Department of Natural Resources, Division of Geology and Earth Resources. 60 pp.
- Mueller, S. B. , Kueppers, U. , Ayris, P. M. , Jacob, M. , & Dingwell, D. B. (2016). Experimental volcanic ash aggregation: Internal structuring of accretionary lapilli and the role of liquid bonding. Earth and Planetary Science Letters, 433, 232–240. 10.1016/j.epsl.2015.11.007 [DOI] [Google Scholar]
- Naderi, M. (2015). Surface Area: Brunauer‐Emmett‐Teller (BET) In Progress in Filtration filtration and Separation separation, (pp. 585–608). Alperton, London, UK: Surface Measurement Systems, Ltd; 10.1016/B978-0-12-384746-1.00014-8 [DOI] [Google Scholar]
- Newhall, C. G. , & Self, S. (1982). The volcanic explosivity index (VEI) an estimate of explosive magnitude for historical volcanism. Journal of Geophysical Research, 87(C2), 1231–1238. 10.1029/JC087iC02p01231 [DOI] [Google Scholar]
- Olgun, N. , Duggen, S. , Croot, P. L. , Delmelle, P. , Dietze, H. , Schacht, U. , Óskarsson, N. , Siebe, C. , Auer, A. , & Garbe‐Schönberg, D. (2011). Surface ocean iron fertilization: The role of airborne volcanic ash from subduction zone and hot spot volcanoes and related iron fluxes into the Pacific Ocean. Global Biogeochemical Cycles, 25, GB4001 10.1029/2009GB003761 [DOI] [Google Scholar]
- Óskarsson, N. (1980). The interaction between volcanic gases and tephra: Fluorine adhering to tephra of the 1970 hekla eruption. Journal of Volcanology and Geothermal Research, 8(2–4), 251–266. 10.1016/0377-0273(80)90107-9 [DOI] [Google Scholar]
- Óskarsson, N. (1981). The chemistry of icelandic lava incrustations and the latest stages of degassing. Journal of Volcanology and Geothermal Research, 10(1–3), 93–111. 10.1016/0377-0273(81)90057-3 [DOI] [Google Scholar]
- Porritt, L. A. , Russell, J. K. , & Quane, S. L. (2012). Pele's tears and spheres: Examples from Kilauea Iki. Earth and Planetary Science Letters, 333–334, 171–180. 10.1016/j.epsl.2012.03.031 [DOI] [Google Scholar]
- Rose, W. I. , & Durant, A. J. (2011). A new perspective on continental moisture recycling. Eos Trans. AGU, 90(52), Fall Meet. Suppl., Abstract H41G‐0988‐Oral. 10.5194/acp [DOI]
- Rose, W. I. , & Durant, A. J. (2009). Fine ash content of explosive eruptions. Journal of Volcanology and Geothermal Research, 186(1–2), 32–39. 10.1016/j.jvolgeores.2009.01.010 [DOI] [Google Scholar]
- Rubin, C. H. , Noji, E. K. , Seligman, P. J. , Holtz, J. L. , Grande, J. , & Vittani, F. (1994). Evaluating a fluorosis hazard after a volcanic eruption. Archives of Environmental Health, 49(5), 395–401. 10.1080/00039896.1994.9954992 [DOI] [PubMed] [Google Scholar]
- Scott, W. E. , & McGimsey, R. G. (1994). Character, mass, distribution, and origin of tephra‐fall deposits of the 1989–1990 eruption of Redoubt volcano, south–central Alaska. Journal of Volcanology and Geothermal Research, 62(1‐4), 251–272. 10.1016/0377-0273(94)90036-1 [DOI] [Google Scholar]
- Smith, D. B. , Zielinski, R. A. , & Rose, W. I. (1982). Leachability of uranium and other elements from freshly erupted volcanic ash. Journal of Volcanology and Geothermal Research, 13(1‐2), 1–30. 10.1016/0377-0273(82)90017-8 [DOI] [Google Scholar]
- Stewart, C. , Johnston, D. M. , Leonard, G. S. , Horwell, C. J. , Thordarson, T. , & Cronin, S. J. (2006). Contamination of water supplies by volcanic ashfall: A literature review and simple impact modelling. Journal of Volcanology and Geothermal Research, 158(3–4), 296–306. 10.1016/j.jvolgeores.2006.07.002 [DOI] [Google Scholar]
- Taylor, A. S. , Blum, J. D. , & Lasaga, A. C. (2000). The dependence of labradorite dissolution and Sr isotope release rates on solution saturation state. Geochimica et Cosmochimica Acta, 64(14), 2389–2400. 10.1016/S0016-7037(00)00361-6 [DOI] [Google Scholar]
- Taylor, A. S. , Blum, J. D. , Lasaga, A. C. , & MacInnis, I. N. (2000). Kinetics of dissolution and Sr release during biotite and phlogopite weathering. Geochimica et Cosmochimica Acta, 64(7), 1191–1208. 10.1016/S0016-7037(99)00369-5 [DOI] [Google Scholar]
- Taylor, H. E. , & Lichte, F. E. (1980). Chemical Composition of Mount St. Helens Volcanic Ash. Geophysical Research Letters, 7(11), 949–952. 10.1029/GL007i011p00949 [DOI] [Google Scholar]
- Tester, J. W. , Worley, W. G. , Robinson, B. A. , Grigsby, C. O. , & Feerer, J. L. (1994). Correlating quartz dissolution kinetics in pure water from 25 to 625°C. Geochimica et Cosmochimica Acta, 58(11), 2407–2420. 10.1016/0016-7037(94)90020-5 [DOI] [Google Scholar]
- Thordarson, T. , & Self, S. (2003). Atmospheric and environmental effects of the 1783–1784 Laki eruption: A review and reassessment. Journal of Geophysical Research, 108(D1), 4011 10.1029/2001JD002042 [DOI] [Google Scholar]
- Toohey, R. C. , Boll, J. , Brooks, E. S. , & Jones, J. R. (2018). Effects of land use on soil properties and hydrological processes at the point, plot, and catchment scale in volcanic soils near Turrialba, Costa Rica. Geoderma, 315, 138–148. 10.1016/j.geoderma.2017.11.044 [DOI] [Google Scholar]
- Toramaru, A. (2006). BND (bubble number density) decompression rate meter for explosive volcanic eruptions. Journal of Volcanology and Geothermal Research, 154(3‐4), 303–316. 10.1016/j.jvolgeores.2006.03.027 [DOI] [Google Scholar]
- Toramaru, A. (2014). On the second nucleation of bubbles in magmas under sudden decompression. Earth and Planetary Science Letters, 404, 190–199. 10.1016/j.epsl.2014.07.035 [DOI] [Google Scholar]
- van Creveld, S. G. , Rosenwasser, S. , Levin, Y. , & Vardi, A. (2016). Chronic iron limitation confers to transient resistance to oxidative stress in marine diatoms. Plant Physiology, 172(2), 968–979. [DOI] [PMC free article] [PubMed] [Google Scholar]
- Walker, G. P. L. (1981). Generation and dispersal of fine ash and dust by volcanic eruptions. Journal of Volcanology and Geothermal Research, 11(1), 81–92. 10.1016/0377-0273(81)90077-9 [DOI] [Google Scholar]
- Wilson, T. , Stewart, C. , Cole, J. , Johnston, D. , & Cronin, S. (2010). Vulnerability of farm water supply systems to volcanic ash fall. Environmental Earth Sciences, 61(4), 675–688. 10.1007/s12665-009-0380-2 [DOI] [Google Scholar]
- Witham, C. S. , Oppenheimer, C. , & Horwell, C. J. (2005). Volcanic ash‐leachates: A review and recommendations for sampling methods. Journal of Volcanology and Geothermal Research, 141(3–4), 299–326. 10.1016/j.jvolgeores.2004.11.010 [DOI] [Google Scholar]
- Wolff‐Boenisch, D. , Gislason, S. R. , Oelkers, E. H. , & Putnis, C. V. (2004). The dissolution rates of natural glasses as a function of their composition at pH 4 and 10.6, and temperatures from 25 to 74°C. Geochimica et Cosmochimica Acta, 68(23), 4843–4858. 10.1016/j.gca.2004.05.027 [DOI] [Google Scholar]
References From the Supporting Information
- Bau, M. , Tepe, N. , & Mohwinkel, D. (2013). Siderophore‐promoted transfer of rare earth elements and iron from volcanic ash into glacial meltwater, river and ocean water. Earth and Planetary Science Letters, 364, 30–36. 10.1016/j.epsl.2013.01.002 [DOI] [Google Scholar]
- Bull, K. F. , Anderson, S. W. , Diefenbach, A. K. , Wessels, R. L. , & Henton, S. M. (2013). Emplacement of the final lava dome of the 2009 eruption of Redoubt Volcano, Alaska. Journal of Volcanology and Geothermal Research, 259, 334–348. 10.1016/j.jvolgeores.2012.06.014 [DOI] [Google Scholar]
- Bull, K. F. , & Buurman, H. (2013). An overview of the 2009 eruption of Redoubt Volcano, Alaska. Journal of Volcanology and Geothermal Research, 259, 2–15. 10.1016/j.jvolgeores.2012.06.024 [DOI] [Google Scholar]
- Fu, G. , Lin, H. X. , Heemink, A. W. , Segers, A. J. , Lu, S. , & Palsson, T. (2015). Assimilating aircraft‐based measurements to improve forecast accuracy of volcanic ash transport. Atmospheric Environment, 115, 170–184. 10.1016/j.atmosenv.2015.05.061 [DOI] [Google Scholar]
- Gudmundsson, M. T. , Thordarson, T. , Hoskuldsson, A. , Larsen, G. , Bjornsson, H. , Prata, F. J. , Oddsson, B. , Magnusson, E. , Hognadottir, T. , Petersen, G. N. , Hayward, C. L. , Stevenson, J. A. , & Jonsdottir, I. (2012). Ash generation and distribution from the April–May 2010 eruption of Eyjafjallajokull, Iceland. Scientific Reports, 2(1), 1–12. 10.1038/srep00572 [DOI] [PMC free article] [PubMed] [Google Scholar]
- Swanson, D. A. (2008). Hawaiian oral tradition describes 400 years of volcanic activity at Kīlauea. Journal of Volcanology and Geothermal Research, 176(3), 427–431. 10.1016/j.jvolgeores.2008.01.033 [DOI] [Google Scholar]
Associated Data
This section collects any data citations, data availability statements, or supplementary materials included in this article.
Supplementary Materials
Supporting Information S1
Data Set S1
Data Set S2