

Abstract
Valley fever is endemic to the southwestern United States. Humans contract this fungal disease by inhaling spores of Coccidioides spp. Changes in the environment can influence the abundance and dispersal of Coccidioides spp., causing fluctuations in valley fever incidence. We combined county‐level case records from state health agencies to create a regional valley fever database for the southwestern United States, including Arizona, California, Nevada, New Mexico, and Utah. We used this data set to explore how environmental factors influenced the spatial pattern and temporal dynamics of valley fever incidence during 2000–2015. We compiled climate and environmental geospatial data sets from multiple sources to compare with valley fever incidence. These variables included air temperature, precipitation, soil moisture, surface dust concentration, normalized difference vegetation index, and cropland area. We found that valley fever incidence was greater in areas with warmer air temperatures and drier soils. The mean annual cycle of incidence varied throughout the southwestern United States and peaked following periods of low precipitation and soil moisture. From year‐to‐year, however, autumn incidence was higher following cooler, wetter, and productive springs in the San Joaquin Valley of California. In southcentral Arizona, incidence increased significantly through time. By 2015, incidence in this region was more than double the rate in the San Joaquin Valley. Our analysis provides a framework for interpreting the influence of climate change on valley fever incidence dynamics. Our results may allow the U.S. Centers for Disease Control and Prevention to improve their estimates of the spatial pattern and intensity of valley fever endemicity.
Keywords: coccidioidomycosis, coccidioides, incidence/epidemiology, climate, surveillance/epidemiology, mycoses
Key Points
We created a valley fever database for the southwestern United States and explored the climate factors influencing the dynamics of disease incidence
Incidence was higher in areas with warmer air temperatures and drier soils and seasonal peaks followed periods of low environmental moisture
Our results may improve estimates of valley fever endemicity and aid future analysis of global change and valley fever incidence dynamics
1. Introduction
Coccidioidomycosis, also known as valley fever, is an infectious disease that has gained attention from a recent increase in cases. Fluctuations in cases are likely driven by changes in climate and environmental conditions, which impact the lifecycle of the disease agent. The agent for valley fever is Coccidioides spp., which are saprotrophic fungi that grow in the soils of the southwestern United States (Smith, Beard, Whiting, et al., 1946). When water‐stressed, Coccidioides spp. autolyze into spores comparable in size to dust aerosols (Huppert et al., 1967). Soil disturbance can aerosolize these spores, which if inhaled, cause valley fever in roughly 40% of hosts (Smith, Beard, Whiting, et al., 1946). No valley fever cases have been reported from human transmission, so cases are likely a direct consequence of environmental exposure to Coccidioides spp.
Valley fever symptoms range from short term, flu‐like illness, to long‐term, disseminated disease (Thompson, 2011; Tsang et al., 2010). Moreover, human populations differ in their disease risk. Immunocompromised persons are more susceptible to valley fever (Bercovitch et al., 2011; Blair & Logan, 2001; Rosenstein et al., 2001; Woods et al., 2000). In addition, disseminated cases are more frequent in non‐white races (Crum et al., 2004; Durry et al., 1997; Rosenstein et al., 2001).
The amount of Coccidioides spp. in the soil and air may be modulated by both abiotic and biotic factors (Nguyen et al., 2013), therefore influencing valley fever incidence (Figure 1). Important environmental factors include air temperature, water availability, biological competition, and anthropogenic and natural dust emissions (Nguyen et al., 2013). Previous studies examining the relationship between climate and valley fever incidence analyzed time series from a few, highly endemic counties (Comrie, 2005; Coopersmith et al., 2017; Kolivras & Comrie, 2003; Komatsu et al., 2003; Park et al., 2005; Talamantes et al., 2007; Tamerius & Comrie, 2011; Tong et al., 2017; Zender & Talamantes, 2006). Climate controls on the spatial structure of valley fever incidence have not been systematically explored across the suspected endemic region of the southwestern United States due to the lack of an integrated valley fever incidence database.
Figure 1.
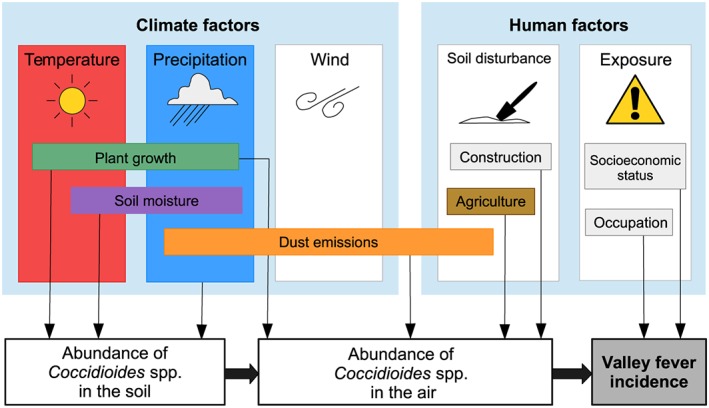
Climate, environmental, and human factors may modulate the abundance of Coccidioides spp. in the soil and air and therefore influence the temporal and spatial patterns of valley fever incidence.
The temperature range of habitats favorable for Coccidioides spp. remains poorly constrained. One study found Coccidioides spp. spores survived for 6 months at temperatures ranging from −15°C to 37°C and for over a week at 50°C (Friedman et al., 1956). This temperature adaptability is the basis for the soil sterilization hypothesis, which suggests high temperature extremes limit the growth of many fungi, but Coccidioides spp. may survive by retreating to deeper soils (Maddy, 1965). Then, upon the return of rain, Coccidioides spp. grow toward the soil surface and proliferate with little competition. Two independent studies in Pima and Maricopa Counties in Arizona found significant positive relationships between temperature in the preceding season and valley fever incidence, which supports the soil sterilization hypothesis (Kolivras & Comrie, 2003; Park et al., 2005). This hypothesis may help explain how Coccidioides spp. can flourish at the same location for many years (Barker et al., 2012; Greene et al., 2000), even though lab experiments suggest they are poor competitors relative to other fungi (Barker et al., 2012; Greene et al., 2000; Swatek & Omioczynski, 1970).
The most established relationship between precursor climate conditions and fluctuations in valley fever incidence is that a wet period followed by a dry period causes increased incidence (Pappagianis, 1994; Smith, Beard, Rosenberger, et al., 1946). This pattern first provides water availability, a critical factor for Coccidioides spp. growth in arid desert soils (Fisher et al., 2007; Maddy, 1957; Swatek, 1975). Then, when soils dry, the fungi may autolyze into spores that are small and easily dispersed by winds (Huppert et al., 1967). Previous studies provide support for this hypothesis on both seasonal and interannual time scales in a few, highly endemic counties in Arizona (Comrie, 2005; Coopersmith et al., 2017; Kolivras & Comrie, 2003; Komatsu et al., 2003; Park et al., 2005; Tamerius & Comrie, 2011), but support for this hypothesis is mixed in California (Coopersmith et al., 2017; Talamantes et al., 2007; Zender & Talamantes, 2006).
Since precipitation is subject to runoff and evaporation, soil moisture may be a more precise measurement of water availability for Coccidioides spp. In several Arizona and California counties, decreases in soil moisture preceded increased valley fever incidence (Coopersmith et al., 2017). Other work focusing on Maricopa, Pima, and Pinal Counties in Arizona used normalized difference vegetation index (NDVI), a measure of green plant cover, as a proxy for soil moisture (Stacy et al., 2012). The authors found no correlation with valley fever incidence on an interannual time scale but identified a bimodal mean annual cycle in NDVI that was negatively correlated with a bimodal seasonality of valley fever incidence (Stacy et al., 2012). Use of NDVI as a proxy for water availability may have further implications to environmental conditions, because changes in plant cover may also influence near surface winds and thus the dispersal of spores from the soil surface (e.g., Zender & Talamantes, 2006).
Human activity can exacerbate dust emissions from natural and managed ecosystems, thus increasing the probability of aerosolizing Coccidioides spp. spores. Population in the southwestern United States is increasing faster than many other parts of the nation (U.S. Census Bureau, 2011b). To meet the demands of a rising population, increased soil disturbance from construction and agriculture may aerosolize more Coccidioides spp. spores. Individuals directly disturbing the soil have a high risk of contracting valley fever. Soil disturbance from construction sites (California Department of Public Health, 2013; Wilken et al., 2015), military training (Smith, Beard, Rosenberger, et al., 1946), archaeological digs (Perera et al., 2002; Petersen et al., 2004; Werner & Pappagianis, 1973), and film shoots (Wilken et al., 2014) have been associated with valley fever outbreaks. Dust storms have also been correlated with increased incidence in a few, highly endemic Arizona counties (Tong et al., 2017) and have caused localized outbreaks of valley fever in California (Williams et al., 1979). Human soil disturbance may exacerbate these natural events, leading to increased exposure to Coccidioides spp.
The goal of our study was to identify spatial and temporal relationships between environmental factors and valley fever incidence throughout the southwestern United States, drawing upon a new regional valley fever incidence database that we assembled. In our analysis, we assessed how surface air temperature, precipitation, soil moisture in the top 10 cm, surface dust concentration, normalized difference vegetation index, and cropland area influence valley fever incidence. We hypothesized that valley fever incidence will be higher in counties with warmer and drier conditions, and where human land use and natural processes increase dust concentrations. We tested our hypothesis using linear and nonlinear regression models to quantify climate and environmental controls on the spatial pattern of incidence in 152 counties across 5 states. In addition, we assessed the influence of climate on seasonal and annual variability as well as the spatial structure of long‐term trends in valley fever incidence. Improving our understanding of the spatial extent of valley fever incidence and the relationships between climate and incidence may help mitigate both immediate and future health impacts of this disease. This information can help to predict how climate change may modify the vulnerability of different communities to valley fever outbreaks over the next several decades.
2. Methods
2.1. Valley Fever Database
We compiled county‐level valley fever case data from Arizona, California, Nevada, New Mexico, and Utah using state‐level data records to create a regional valley fever incidence database (Table 1). We selected this domain because Coccidioides spp. is known to be endemic to the desert soils of the southwestern United States. Our analysis spanned the period from January 2000 to December 2015, when month‐level data were available for each county. During this period, each of the five state health agencies identified valley fever as a reportable disease, meaning immediate disease control was necessary and reporting cases to state health agencies was mandatory (Centers for Disease Control and Prevention, 2015). Over the 16 years and 152 counties in our analysis, our database consisted of 149,286 individual valley fever cases. County‐level cases was the finest spatial scale for which curated valley fever data was available.
Table 1.
County‐Level Data Gathered From State Health Agencies Used to Create the Valley Fever Database
| State | Year made reportable | Data availability | Reference |
|---|---|---|---|
| Arizona | 1997 | 1990–2015 | Arizona Department of Health Services, 150 N 18th Ave, Ste 140, Phoenix, AZ 85007 |
| California | 1995 | 2000–2015 | California Department of Public Health, PO Box 997377, MS 0500, Sacramento, CA 95899 |
| Nevada | 1992 | 1991–2015 | Nevada Department of Health and Human Services, 4126 Technology Way, Carson City, NV 89706 |
| New Mexico | 1988 | 1993–2015 | New Mexico Department of Health, 1190 St. Francis Drive, Runnels N1361, Santa Fe, New Mexico 87502 |
| Utah | 1995 | 1998–2015 | Utah Department of Health, PO Box 142104, Salt Lake City, Utah 84114 |
Each valley fever case has a date corresponding to the month and year when the diagnosing health institution submitted the official case report. However, there is an incubation time between environmental exposure to Coccidioides spp. and the onset of symptoms from 1 to 3 weeks (Smith, Beard, Rosenberger, et al., 1946) and a further lag between the onset of symptoms, subsequent valley fever diagnosis, and submission of the official case report. The time lag between onset of symptoms and submission of the official valley fever case report is estimated to be between 1 and 1.5 months (Comrie, 2005; Tsang et al., 2010). It is important to consider this lag when interpreting temporal relationships between climate and valley fever incidence. In addition, the location of infection may have not occurred in the county which filed the case report, if for example, an individual was exposed to Coccidioides spp. during travel.
We estimated county‐level valley fever incidence by dividing the number of monthly reported cases by annual county‐level population. We obtained county‐level population data for 2000 to 2015 using intercensal population estimates from the U.S. Census Bureau (U.S. Census Bureau, 2011a, 2015).
We compared our dataset of incidence with the endemicity map from the U.S. Centers for Disease Control and Prevention (CDC). The CDC endemicity map is derived from about 49,000 skin tests administered from 1945 to 1951, with 80% of participants being 17 to 21 year old, Caucasian male, Navy personnel (Centers for Disease Control and Prevention, 2017; Edwards & Palmer, 1957). The map was modified to include valley fever outbreaks in northern California (Werner & Pappagianis, 1973), northeastern Utah (Petersen et al., 2004), and southeastern Washington State (Marsden‐Haug et al., 2013). When interpreting differences between our mean annual valley fever maps and that used by the CDC, it is important to recognize that Caucasian males and people 17 to 21 years old are not recognized as a highly susceptible population to valley fever, and there have been considerable changes in population and land use in the southwestern United States over the past half century.
2.2. Climate and Environmental Data
We collected monthly climate and environmental data from 2000 to 2015 (Table 2). The gridded data were spatially averaged to the county‐level using county cartographic boundary shapefiles from the U.S. Census Bureau at 1:500,000 scale in the Quantum Geographic Information System (QGIS, http://www.qgis.org/en/site).
Table 2.
Climate and Environmental Variables Analyzed Against the Valley Fever Database
| Variable | Data product | Resolution | Time span | Reference |
|---|---|---|---|---|
| Surface precipitation | PRISM Climate Group, AN81m | 4 km2 | 2000–2015 | Daly et al. (1994, 2008) |
| Surface air temperature | PRISM Climate Group, AN81m | 4 km2 | 2000–2015 | Daly et al. (1994, 2008) |
| Average soil moisture 0–10 cm | NASA Global Land Data Assimilation System, Noah land surface model L4, Version 2.1 | 0.25 × 0.25° | 2000–2015 | Rodell et al. (2004) and Rodell and Beaudoing (2007) |
| Surface dust concentration | MERRA‐2 Monthly mean, time averaged, aerosol diagnostics, Version 5.12.4 | 0.5 × 0.625° | 2000–2015 | Rienecker et al. (2011), Bosilovich et al. (2015), and Molod et al. (2015) |
| Normalized difference vegetation index | NASA Terra MODIS L3, Version 6, MOD13C2 | 0.05 × 0.05° | 02/2000–2015 | Huete et al. (2002, 2010) and Didan (2015) |
| Cropland area | USDA, NASS, Cultivated Layer based upon the NASS Cropland Data Layers | 30 m | 2015 | Boryan et al. (2011, 2012) |
For surface air temperature and precipitation, we used 4 km gridded products from the Precipitation‐elevation Regressions on Independent Slopes Model (PRISM) (Daly et al., 2008, 1994). PRISM is a climate interpolation model for the conterminous United States that assimilates surface station data using topographic variables and other information. It is recognized as the official spatial climate data set of the U.S. Department of Agriculture. For soil moisture, we used the 0–10 cm layer product at a 0.25° spatial resolution from NASA's Global Land Data Assimilation System (GLDAS) (Rodell et al., 2004; Rodell & Beaudoing, 2007). GLDAS is a land surface model that assimilates precipitation and solar radiation observations and other land surface driving variables from reanalysis. For dust loading, we used the 0.5° × 0.625° surface dust concentration from the second Modern‐Era Retrospective Analysis for Research and Applications (MERRA 2) atmospheric reanalysis data (Bosilovich et al., 2015; Molod et al., 2015; Rienecker et al., 2011). For NDVI, we used the Moderate Resolution Imaging Spectroradiometer (MODIS) collection 6 product (MOD13C2) (Didan, 2015; Huete et al., 2002, 2010). NDVI values range from −1 to 1; barren rock and sand often have values between 0.1 and 0.2, grasslands or other ecosystems with sparse leaf area have values between 0.2 and 0.4, and high leaf area ecosystems, including closed canopy forests, often have values between 0.6 and 0.8 (Huete et al., 2010). As a measure of agricultural activity, we used an estimate of the cropland area per county from the 2015, 30 m cultivated land layer developed by the U.S. Department of Agriculture (USDA) National Agricultural Statistics Service (NASS) (Boryan et al., 2011, 2012). The area of cropland is estimated by taking the sum of the individual NASS Cropland Data Layers within each county. Cultivated land includes any land area prepared for crop cultivation, fallow land, or idle crop land (Boryan et al., 2012).
2.3. Statistical Analysis
We constructed mean annual valley fever case and incidence maps for the 2000 to 2015 period using the valley fever database and population data. We used month‐level climate and environmental data to construct mean annual maps over the same period, allowing for a direct comparison between these variables and mean annual valley fever incidence.
For cropland area, we used the 2015 map because of a lack of cropland data for other years. We used the total area of cropland per county, instead of fractional cover, to better represent the impact of agriculture in large heterogeneous counties that also encompass large regions with mountain or desert ecosystems.
We focused our time series analyses on two valley fever endemic subregions: the San Joaquin Valley of California and southcentral Arizona. We selected these regions because the large number of cases in these areas allowed us to quantitatively examine environmental controls on seasonal and interannual timescales. The San Joaquin Valley of California consisted of Fresno, Kern, Kings, Madera, Merced, San Joaquin, Stanislaus, and Tulare Counties and included the cities of Fresno, Bakersfield, and Stockton. Southcentral Arizona consisted of Maricopa, Pima, and Pinal Counties and included the cities and metropolitan areas of Phoenix and Tucson.
We used linear and nonlinear regression to examine the relationships between climate and valley fever incidence. For each variable, we first calculated county‐level means. For the San Joaquin Valley and southcentral Arizona, we calculated regional means as an area‐weighted average of the individual counties. We calculated the mean annual cycles of both climate variables and valley fever incidence by computing the long‐term mean for each month from 2000 to 2015 (or when data were available, see Table 2). We then subtracted this mean annual cycle from the climate and incidence data to examine climate controls on monthly incidence anomalies.
3. Results
3.1. Spatial Extent and Climate Controls on Valley Fever Incidence
We constructed mean annual maps of valley fever cases and incidence per county by averaging annual case and incidence data from 2000 to 2015 (Figure 2). These maps highlighted regions endemic to valley fever. Valley fever incidence (Figure 2b) was greatest in the San Joaquin Valley of California and southcentral Arizona. Within California, valley fever incidence was almost nonexistent in northern coastal counties, at low to intermediate levels in the coastal and desert counties of southern California, and at very high levels in the San Joaquin Valley and along the southcentral coast. In Arizona, the highest levels of incidence occurred in the Basin and Range regions.
Figure 2.
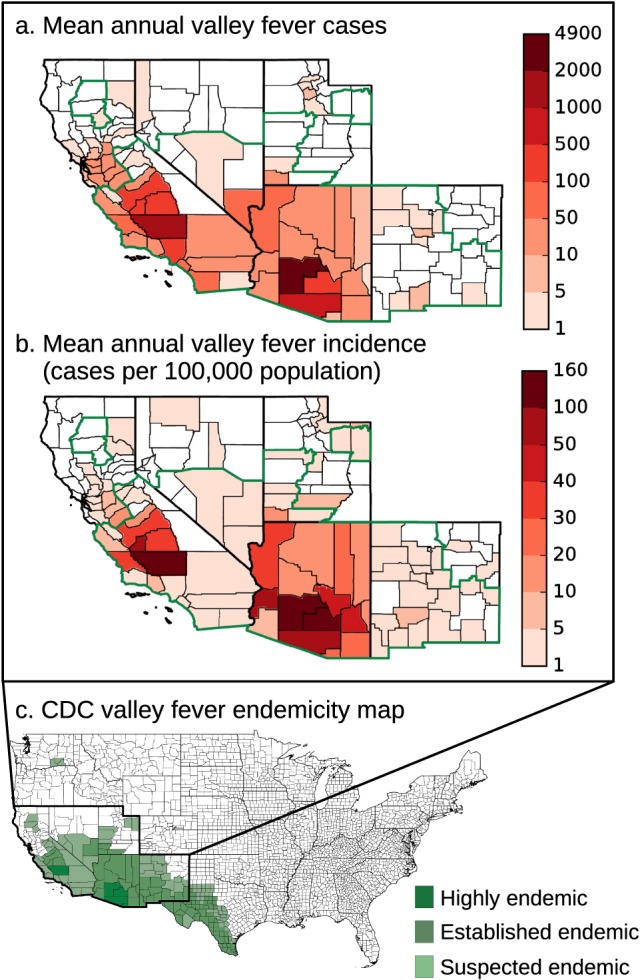
The mean annual maps of valley fever (a) cases and (b) incidence per county from 2000 to 2015 demonstrate that the extent of valley fever differs in some areas than depicted by (c) the CDC (Centers for Disease Control and Prevention, 2017), including the northern San Joaquin Valley and southcentral coast of California. Units are mean annual cases from 2000 to 2015 (Figure 2a) and mean annual incidence from 2000 to 2015 (Figure 2b). Counties considered endemic by the CDC are outlined in green in Figures 2a and 2b.
Our map provided evidence that valley fever incidence may extend beyond the suspected endemic regions identified by the CDC in several areas (Centers for Disease Control and Prevention, 2017). In California, valley fever incidence extended farther north in the San Joaquin Valley, into Merced, Stanislaus, and San Joaquin Counties. Combined, these three counties reported 1,622 cases from 2000 to 2015. In contrast, a neighboring CDC suspected endemic region of similar area to the east, including Amador, Calaveras, Tuolumne, and Mariposa Counties, reported only 64 cases. Incidence throughout northern California, Nevada, New Mexico, and Utah was low, but more widespread and extended farther north than depicted by the CDC. We also note that our data set did not detect valley fever incidence in several counties that the CDC reported as endemic. These differences may have been caused by the interpolation approach used by the CDC, small sample sizes in sparsely populated counties in our incidence data set, or changes in Coccidioides spp. abundance over time.
We compared our mean annual map of valley fever incidence with the maps of the climate and environmental drivers and found valley fever incidence was higher in hotter, drier, and dustier regions, and often where there were large areas of cropland (Figure 3, Figure 4, and Table 3). Mean annual surface air temperature was a significant, positive nonlinear driver of valley fever incidence (p < 0.001, Figure 4a). No county with a mean annual temperature lower than 10°C had incidence higher than 6 cases per 100,000 population, whereas the six counties in Arizona and California with the highest incidence (greater than 70 cases per 100,000 population) all had mean annual temperatures exceeding 16°C. The two measures of ecosystem moisture had significant, negative nonlinear relationships with valley fever incidence (precipitation: p < 0.001, soil moisture: p < 0.001). No county with mean annual precipitation greater than 600 mm/yr had valley fever incidence exceeding 4 cases per 100,000 population (Figure 4b). Thus, northern coastal counties of California had very low levels of valley fever incidence. Similarly, counties with the greatest soil moisture had almost no valley fever incidence (Figure 4c). Surface dust concentrations had a weak, positive linear relationship with valley fever incidence (p < 0.001, Figure 4d). NDVI did not have a significant linear or nonlinear relationship with valley fever incidence, although counties with over 10 cases per 100,000 population spanned a range of NDVI values between 0.16 and 0.45, indicating that valley fever incidence was elevated in areas with intermediate levels of vegetation cover (Figure 4e). Valley fever incidence was less than or equal to 1 case per 100,000 in counties with NDVI values greater than 0.55, suggesting dense vegetation and tree cover may decrease human exposure to Coccidioides spp.
Figure 3.
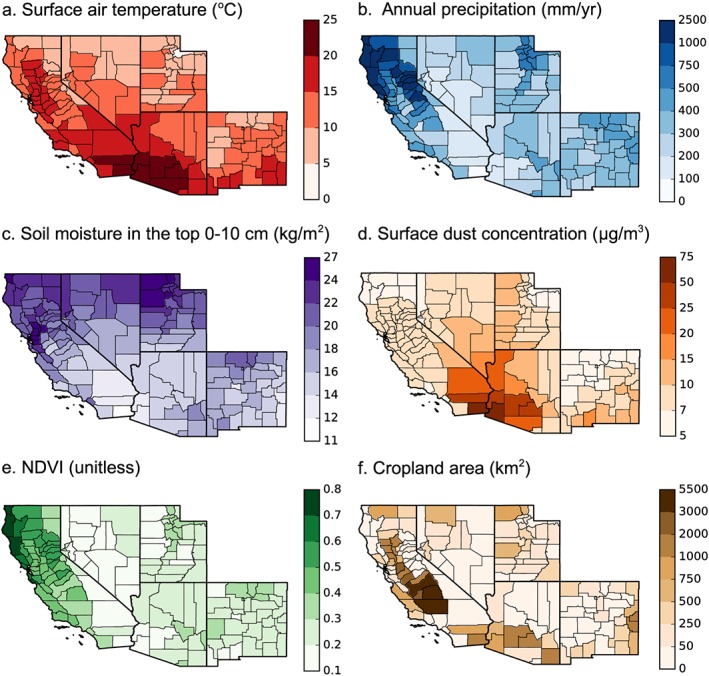
The mean annual maps of climate and environmental drivers from 2000 to 2015 (except cropland area, which include 2015 data only). (a) Surface air temperature, (b) annual precipitation, (c) average soil moisture in the top 10 cm, (d) surface dust concentration, (e) NDVI, and (f) cropland area.
Figure 4.
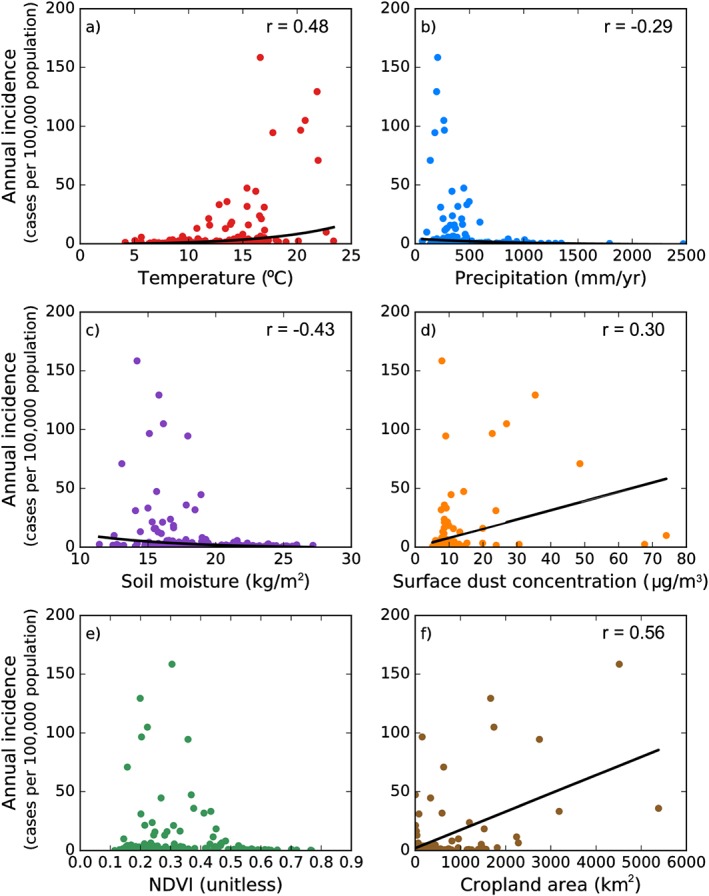
The spatial relationships between mean annual valley fever incidence and (a) surface air temperature, (b) annual precipitation, (c) average soil moisture in the top 10 cm, (d) surface dust concentration, (e) NDVI, and (f) cropland area. Statistically significant nonlinear relationships for surface air temperature (p < 0.001), annual precipitation (p < 0.001), soil moisture (p < 0.001) and statistically significant linear relationships for surface dust concentration (p < 0.001) and cropland area (p < 0.001) are plotted in black lines. All variables except cropland area are averaged from 2000 to 2015; cropland area is 2015 data only.
Table 3.
The Statistical Relationships Between Mean Annual Valley Fever Incidence and Climate and Environmental Variables
| Variable | Time span | Best fit | r | Threshold (counties greater than 10 cases/100,000 population, n = 22) |
|---|---|---|---|---|
| Temperature | 2000–2015 | Exponential | 0.48** | >11°C |
| Precipitation | 2000–2015 | Exponential | −0.29** | <600 mm/yr |
| Soil moisture | 2000–2015 | Exponential | −0.43** | <19 kg/m2 |
| Surface dust concentration | 2000–2015 | Linear | 0.30** | |
| NDVI | 02/2000 – 2015 | Not Significant | 0.16–0.45 | |
| Cropland area | 2015 only | Linear | 0.56** |
Note. Data were averaged across the time spans indicated.
Values are significant at p < 0.05.
The amount of cropland area per county in 2015 had a significant, positive linear relationship with valley fever incidence (p < 0.001, Figure 4f). Counties with higher levels of cropland area were more likely to have elevated levels of valley fever incidence. This relationship was weaker (r = 0.20), but still significant (p = 0.01), when we analyzed the fraction of county area with cropland (data not shown). Valley fever incidence was particularly high in the Central Valley of California, a major area of agricultural activity. Over 250 different crops are grown and approximately one quarter of United States food production occurs in that region (U.S. Geological Survey, 2017). There were also large areas of agriculture in southeastern Arizona, which overlapped with higher incidence counties in southcentral Arizona.
3.2. Seasonal Dynamics of Climate and Valley Fever Incidence
Valley fever incidence had a different mean annual cycle in the San Joaquin Valley of California compared to southcentral Arizona (Figure 5). Maximum valley fever incidence in the San Joaquin Valley occurred in October, at a level (6.2 cases per 100,000 population) about double the minimum incidence observed in April (3.2 cases per 100,000 population). In contrast, valley fever incidence in southcentral Arizona was less variable across seasons (averaging 10.1 cases per 100,000 population) and had a bimodal distribution with small peaks in both summer (10.3 cases per 100,000 population) and winter (13.3 cases per 100,000 population).
Figure 5.
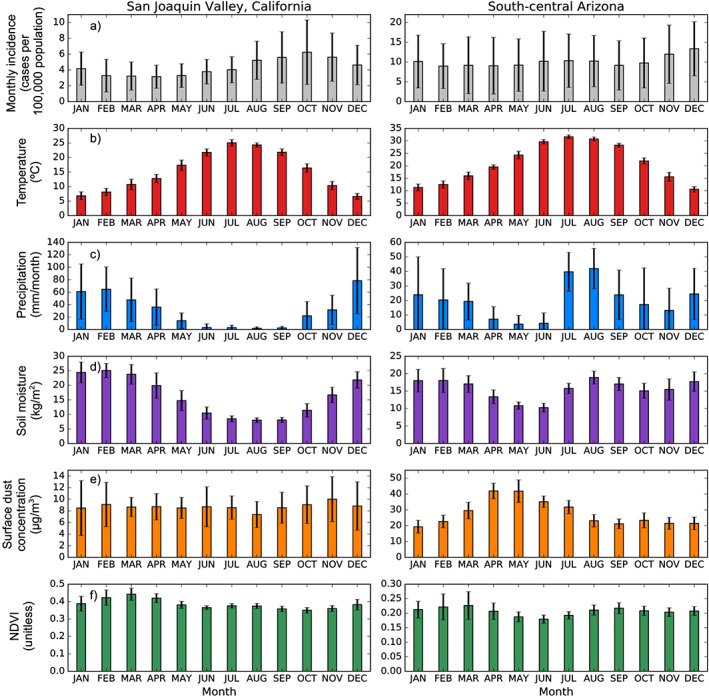
Mean annual cycles of valley fever incidence and climate variables in the San Joaquin Valley of California and southcentral Arizona. (a) Monthly valley fever incidence, (b) surface air temperature, (c) monthly precipitation, (d) average soil moisture in the top 10 cm, (e) surface dust concentration, and (f) NDVI. Valley fever incidence reaches seasonal maximums following periods of low environmental moisture. Error bars are the standard deviation of the monthly averages between counties in each subregion.
In the San Joaquin Valley of California, the October peak in incidence occurred approximately 3 months after the maximum in surface air temperature and 2 months after the summer minimum in precipitation and soil moisture (Figures 5b–5d and Table 4). Surface dust concentrations were lower in the San Joaquin Valley compared to southcentral Arizona. We observed a small peak in dust concentration in the San Joaquin Valley during late autumn and winter months (October–December). The dust peak had a long lead time relative to the seasonal maximum in valley fever incidence (Figure 5e). NDVI was at a minimum in October, during the same month as peak incidence (Figure 5f). Low levels of plant cover during late summer and fall may allow for greater exposure of bare soils that increase surface wind speeds and loft Coccidioides spp. spores into the air (Zender & Talamantes, 2006). Combined, the monthly patterns of climate and incidence in the San Joaquin Valley suggested that dispersal was greater during hot and dry periods following wet conditions optimal for Coccidioides spp. growth, supporting previous work (Pappagianis, 1994; Smith, Beard, Rosenberger, et al., 1946).
Table 4.
The Statistical Relationships Between Valley Fever Incidence and Climate Variables at Each Time Scale
| Seasonal cycle | Monthly anomalies | Long‐term annual | ||||||||||
|---|---|---|---|---|---|---|---|---|---|---|---|---|
| San Joaquin Valley of California | Southcentral Arizona | San Joaquin Valley of California | Southcentral Arizona | San Joaquin Valley of California | Southcentral Arizona | |||||||
| Variable | r | Lag (month) [0–11] | r | Lag (month) [0–11] | r | Lag (month) [0–11] | r | Lag (month) [0–11] | r | Lag (year) [0–2] | r | Lag (year) [0–2] |
| Temperature | 0.95** | 3 | 0.59** | 4 | −0.32** | 6 | −0.11 | 11 | −0.59** | 0 | −0.37 | 1 |
| Precipitation | 0.92** | 8 | 0.72** | 4 | 0.26** | 9 | −0.17** | 2 | 0.57** | 1 | −0.26 | 0 |
| Soil Moisture | 0.98** | 8 | −0.74** | 6 | 0.42** | 7 | −0.19** | 1 | 0.55** | 1 | −0.23 | 0 |
| Surface Dust Concentration | 0.51* | 11 | 0.71** | 7 | 0.17** | 3 | 0.23** | 1 | 0.33 | 0 | 0.35 | 0 |
| NDVI | 0.90** | 7 | −0.76** | 6 | 0.48** | 9 | −0.28** | 0 | 0.66** | 1 | −0.30 | 0 |
Note. Lag times refer to the delay in valley fever incidence relative to each environmental variable.
Values are significant at p < 0.10.
Values are significant at p < 0.05.
In southcentral Arizona, peaks of valley fever incidence during summer and winter months follow minima in precipitation during spring and autumn (Figure 5 and Table 4). Soil moisture was less seasonally variable in southcentral Arizona than in the San Joaquin Valley, which may have contributed to the more homogenous seasonal dynamics of valley fever incidence. Surface dust concentrations had a lead time of 7 months relative to the peak of valley fever incidence in winter; however, dust concentrations did not follow a bimodal seasonal pattern like environmental moisture, plant growth, and valley fever incidence.
To further explore the role of precipitation in structuring valley fever incidence, we created a seasonality index by calculating the fraction of mean annual precipitation and incidence that occurred during each three‐month season (Figure 6). Areas surrounding and including the San Joaquin Valley of California had a more pronounced seasonality of valley fever incidence than areas surrounding and including southcentral Arizona. Near the San Joaquin Valley, high winter precipitation preceded low levels of valley fever incidence in spring, while low summer precipitation preceded a peak of incidence in autumn. This annual cycle changed to the east. Across Arizona and New Mexico, counties experienced increased precipitation from the North American monsoon during summer and autumn. The regional differences in precipitation timing may be one of the factors contributing to differences in the seasonality of valley fever incidence observed across the southwestern United States.
Figure 6.
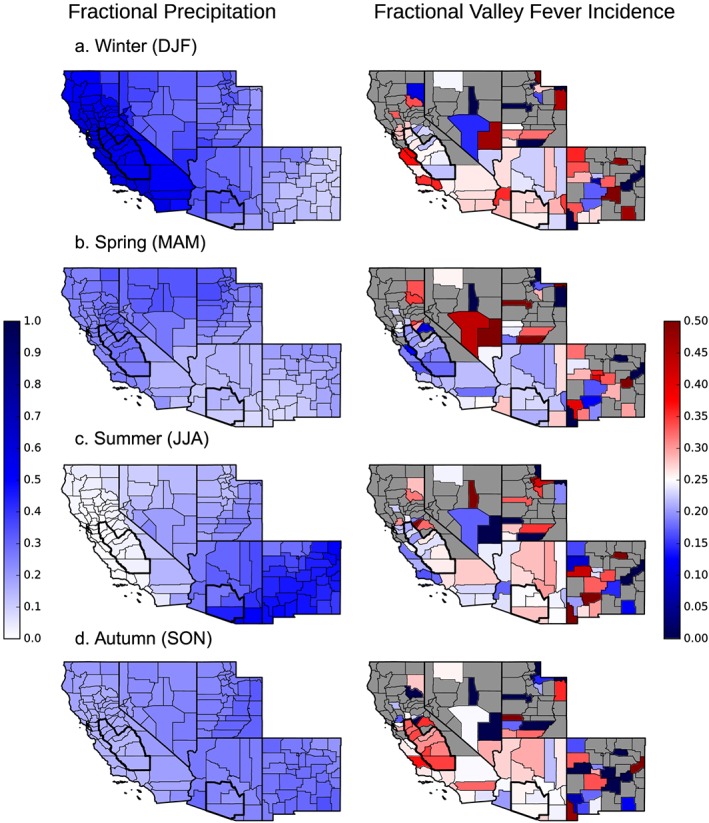
A seasonality index showing the fraction of annual precipitation and annual valley fever incidence that occurred during each 3 month period. (a) Winter (DJF), (b) spring (MAM), (c) summer (JJA), and (d) autumn (SON) intervals. Counties that averaged less than one valley fever case per 1,000,000 population per year from 2000 to 2015 were masked to reduce the noise associated with small sample sizes.
3.3. Monthly Climate and Valley Fever Incidence Anomalies
We calculated monthly climate and valley fever incidence anomalies by removing the mean annual cycle from the original time series for each variable (Figure 7). In the San Joaquin Valley of California, monthly air temperature anomalies were negatively correlated with valley fever incidence anomalies 6 months later (Figure 7b and Table 4). Precipitation, soil moisture, and NDVI anomalies all had significant, positive correlations with valley fever incidence anomalies 7–9 months later (Figures 7c,d,f and Table 4). Taken together, these results provide preliminary evidence for higher autumn valley fever incidence in years with cool, wet, and productive spring growing seasons.
Figure 7.
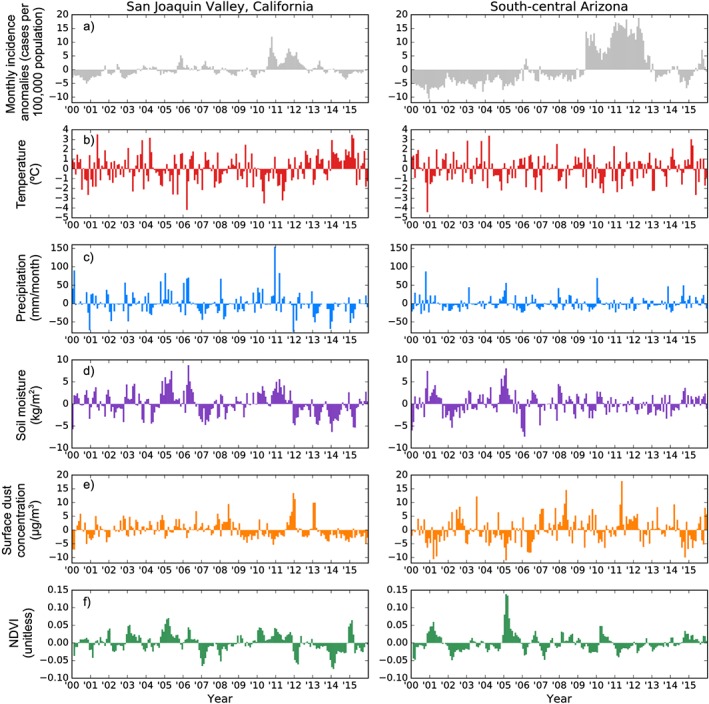
Monthly climate and valley fever incidence anomalies after removing the mean annual cycle from the original time series for each variable. (a) Valley fever incidence anomalies, (b) surface air temperature anomalies, (c) monthly precipitation anomalies, (d) soil moisture in the top 10 cm anomalies, (e) surface dust concentration anomalies, and (f) NDVI anomalies.
In southcentral Arizona, we found no significant relationship between air temperature anomalies and valley fever incidence anomalies (Figure 7b). Incidence anomalies were negatively correlated with precipitation and soil moisture anomalies over the previous 1–2 months, positively correlated with surface dust in the previous month, and negatively correlated with NDVI anomalies in the same month (Figures 7c–f and Table 4). The shorter lag times of incidence following climate and dust anomalies suggested that in southcentral Arizona, climate variability within a single season can modify the risk of contracting valley fever. The dual influence of both Pacific storms and the North American monsoon likely contributes to both the bimodal seasonality of valley fever incidence and shorter time delays observed between climate and incidence anomalies.
3.4. Long‐Term Trends in Valley Fever Incidence
Trends in annual valley fever cases and incidence across the southwestern United States followed similar patterns between states, especially in Arizona and California (Figure 8a). Cases in Arizona and California had a minor peak in 2006 and a longer‐duration peak from 2009 to 2012, which was followed by a moderate decrease from 2013 to 2015. The majority of cases within Arizona and California occurred in the two subregions with high valley fever incidence; the San Joaquin Valley of California accounted for over 57% of cases in California each year and southcentral Arizona accounted for over 94% of cases in Arizona each year (Figure 8a). The combined set of cases from Nevada, New Mexico, and Utah was small compared to the totals from Arizona and California.
Figure 8.
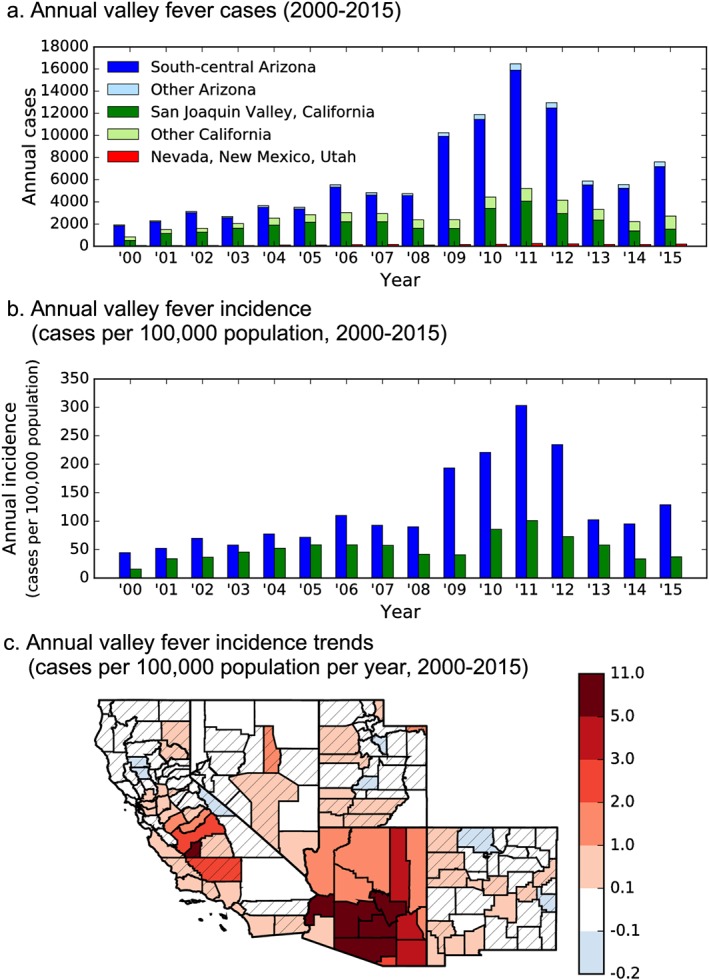
Long‐term trends of valley fever from 2000 to 2015, with relative peaks in 2006 and 2011. (a) Annual cases in California and Arizona are dominated by two subregions of high valley fever cases: the San Joaquin Valley of California and southcentral Arizona, (b) annual incidence in Arizona becomes greater than in California by 2015, and (c) significant changes in annual valley fever incidence occurred throughout the entire state of Arizona and portions of the San Joaquin Valley and southcentral coast of California. Striped counties indicate trends that were not significant at p < 0.10. The units are the change in annual incidence per year.
Valley fever incidence in the San Joaquin Valley and southcentral Arizona was similar at the beginning of our time series from 2000 to 2008 (Figure 8b). However, from 2009 to 2012, southcentral Arizona experienced a rapid increase in incidence, with levels more than doubling during this 4 year interval. Incidence in both subregions declined after 2012, but incidence in southcentral Arizona remained over 2.5 times the annual incidence in the San Joaquin Valley. Overall, the long‐term trend in annual valley fever incidence in southcentral Arizona significantly increased on average by 9.3 cases per 100,000 population per year from 2000 to 2015 (p < 0.05), whereas the San Joaquin Valley had no significant trend. At the state level, Arizona (p < 0.05), California (p < 0.05), Nevada (p < 0.001), New Mexico (p < 0.01), and Utah (p < 0.05) all had significant positive long‐term trends in annual valley fever incidence.
A map of long‐term trends in valley fever incidence (Figure 8c) highlighted significant (p < 0.1) increases in annual valley fever incidence throughout the entire state of Arizona. Annual incidence in the northern part of the San Joaquin Valley of California increased significantly, but this was balanced by areas in the southern part of the valley that did not significantly change. Small increases in annual incidence also occurred along the southcentral and southern coast of California, including Monterey, Santa Barbara, Los Angeles, Orange, and San Diego Counties. Of the 152 counties of the southwestern United States, 38 (25%) had a positive, significant increase in annual incidence over 0.01 cases per 100,000 population per year (p < 0.1) and no county had a significant decrease in incidence. These trends provide evidence that southcentral Arizona is the current, main endemic area to valley fever.
We examined relationships between annual climate and valley fever incidence, examining 0, 1, and 2 year lags in incidence (Table 4). In the San Joaquin Valley of California, temperature was negatively correlated with valley fever incidence in the same year, which is consistent with the negative relationship we found between monthly anomalous temperature and incidence. Precipitation, soil moisture, and NDVI were all positively correlated with incidence in the following year. Since the Pacific storm tracks are the main source of precipitation in the San Joaquin Valley, October through December precipitation in the previous year may be important for the growth of Coccidioides spp. and subsequent spore formation during the following autumn. In southcentral Arizona, we found no significant correlations between annual climate and valley fever incidence. There were no significant correlations between annual dust concentrations and incidence in either subregion.
4. Discussion
4.1. The Spatial Extent of Valley Fever Incidence and Need for Enhanced Valley Fever Surveillance
Our mean annual map of valley fever incidence suggested that regions of valley fever endemicity may extend beyond the current boundaries depicted by the CDC, most notably extending farther north. This highlights the need for systematic monitoring in counties with lower valley fever incidence and states outside the suspected endemic zone.
Texas was not included in our study since the state does not declare valley fever as a reportable disease. However, the CDC estimates Texas is an established endemic region (Centers for Disease Control and Prevention, 2017) and cases in Texas date back to the 1930s (Caldwell, 1932; Maddy, 1965). A few county‐level health departments in Texas initiated local valley fever surveillance programs and reported nonzero amounts of cases (i.e., El Paso County: 12 cases in 2015, or 1.4 cases per 100,000 population) (City of El Paso Department of Public Health, 2015).
States outside of the southwestern United States have also reported increases in valley fever. Several cases of valley fever in Washington State led to an investigation that detected Coccidioides spp. in Washington State soils (Litvintseva et al., 2015). Cases in Missouri are increasing, largely in part to people traveling to endemic areas (Turabelidze et al., 2015). Humans may unintentionally aid spore dispersal and cause new communities to be at risk for valley fever, especially since population and domestic travel are increasing (Bureau of Transportation Statistics, 2016). Defining valley fever as a reportable disease outside the endemic zone would strengthen our ability to quantify climate and environmental drivers that structure the spatial and temporal trends of valley fever.
More broadly, international collaboration on valley fever surveillance would improve disease management, especially in countries with cases or where Coccidioides spp. has been detected; this includes countries in North, Central, and South America (Baptista‐Rosas et al., 2012; Campins, 1961; de Macêdo et al., 2011; Eulálio et al., 2001). For example, Coccidioides spp. has been detected in Mexico at multiple locations over 70 years (Baptista‐Rosas et al., 2012; Sotomayor et al., 1960). An environmental niche model of Coccidioides spp. highlighted substantial portions of Mexico as suitable habitat (Baptista‐Rosas et al., 2007). Tracking valley fever cases in Mexico could help define the main drivers of disease trend, especially since there are large similarities in climate and land use patterns between the southwestern United States and northern Mexico, yet differences in demographics and healthcare infrastructure.
4.2. The Role of Climate and Environmental Variables in Structuring the Spatial Pattern of Valley Fever Incidence
Comparing the mean annual map of valley fever incidence with climate and environmental variables does not suggest that regions of high valley fever incidence are structured by a single driver, but rather a combination of climate factors. Hot, dry, and dusty conditions appeared to create the optimal conditions for elevated disease incidence. Collectively, the relationships between valley fever incidence and climate variables begin to define a climate envelope for increased valley fever incidence, and by proxy, the geographical range of Coccidioides spp. Air temperature, precipitation, soil moisture, surface dust concentration, NDVI, and cropland area may all be useful for developing a predictive model of valley fever incidence, and thus a means to analyze scenarios of future environmental change.
Local‐ to regional‐scale patterns of high valley fever incidence are likely structured by a broad suite of mechanisms influencing soil disturbance. In this context, it would be beneficial to further examine human activities that contribute to dust emission. Land use change and some agricultural practices are known to enhance the wind erosion of soils (Liu et al., 2007; McConnell et al., 2007; Neff et al., 2008). In combination with reduced water availability for irrigation, these factors may increase the number of dust storms, which are known to carry large numbers of fungal spores (Griffin, 2007). Dust storm activity in the United States increased in recent decades and has been linked to changes in valley fever incidence (Tong et al., 2017; Williams et al., 1979). Other short‐lived natural dust events, including a landslide triggered by an earthquake, have also been related to valley fever outbreaks (Harp & Jibson, 1996). Since our study was limited to the monthly time scale, the impact of dust contributions on the daily or weekly time scales were not well resolved. New, high‐resolution observations and reanalysis of surface dust, including the contributions from dust storms, is needed to further explore controls on valley fever incidence.
Soil characteristics may also play a role in structuring the spatial extent of valley fever. However, the low number of soil samples that have detected Coccidioides spp. makes it difficult to identify key soil characteristics that influence abundance (Barker et al., 2012; Elconin et al., 1957; Greene et al., 2000; Lacy & Swatek, 1974; Lauer et al., 2012; Maddy, 1958; Swatek & Omieczynski, 1970; Swatek et al., 1967). Alkalinity, salinity, soil porosity, and soil texture may be important factors; however, more systematic soil sampling campaigns across the southwestern United States are needed to better constrain these soil characteristics.
In addition to local environmental conditions, human demographics may contribute to the observed patterns of valley fever incidence. Race, gender, and local population age may play a role, especially in disseminated disease (Hector et al., 2011; Louie et al., 1999; Odio et al., 2017; Rosenstein et al., 2001). Occupation, especially in agriculture, may also be a compounding factor that influences dust exposure and subsequent valley fever incidence.
4.3. Seasonal and Interannual Dynamics of Valley Fever Incidence in Relation to Climate
Our study found support that a wet season, which allows the fungi to grow, followed by a dry period, which allows the generation of dust and dispersal of spores (Pappagianis, 1994; Smith, Beard, Rosenberger, et al., 1946), regulates the seasonal timing of valley fever incidence. Our analysis builds upon this paradigm by showing that incidence seasonality varied across the southwestern United States and was linked to different precipitation regimes, including Pacific storm systems and the North American monsoon. In California, the October peak in incidence occurred near the end of a hot and dry Mediterranean summer climate. In contrast, smaller bimodal peaks in incidence in southcentral Arizona occurred during summer and early winter after dry intervals in late spring and autumn.
The differences we observed in seasonal valley fever dynamics between California and Arizona were consistent with previous studies, but differed slightly in timing. In the San Joaquin Valley of California, the singular peak of valley fever incidence we observed during autumn is consistent with individual studies in Kern County. However, our study indicated an October maximum of valley fever incidence, while earlier studies broadly identified that the maximum occurred in summer to autumn (Smith, Beard, Rosenberger, et al., 1946), or in October to January (Zender & Talamantes, 2006). In southcentral Arizona, the bimodal peak of valley fever incidence is similar to previous temporal patterns identified for Pima County (Hugenholtz, 1957). Our results indicated that a secondary peak in incidence occurs in December, whereas prior analyses reported this peak to occur earlier, between October and November (Comrie, 2005; Hugenholtz, 1957; Kerrick et al., 1985).
The sensitivity of valley fever incidence to wetting and drying cycles appeared to impact interannual anomalous incidence. In the San Joaquin Valley of California, cool, wet, and productive springs appeared to increase valley fever incidence the following autumn. In southcentral Arizona, no significant pattern was observed on this timescale, possibly from dual forcing from Pacific storms and the North American monsoon damping out seasonal precipitation variability. However, a recent study used aggregated soil moisture and valley fever incidence data over varying, interannual monthly time intervals and found evidence for this relationship in both California and Arizona (Coopersmith et al., 2017).
Our study lacked strong evidence supporting dust as a driver of seasonal valley fever incidence. There was significant, but weak, support for this relationship on the interannual time scale. In both the San Joaquin Valley and southcentral Arizona, dust concentrations in the preceding 1–3 months were positively correlated with valley fever incidence. This may suggest that localized dust emissions that are not captured in atmospheric reanalysis models may be an important mechanism for the dispersion of Coccidioides spp. spores. Moreover, isolated short‐lived dust storms may be an important mechanism for widespread exposure to Coccidioides spp., especially storms that impact large populations (Tong et al., 2017). Recent work found that the frequency of dust storms was a better indicator of increased valley fever incidence than surface dust measurements (Tong et al., 2017). However, this finding was only significant for two highly endemic counties: Maricopa and Pima Counties (Tong et al., 2017). Dust storms may have caused anomalous monthly surface dust concentrations in our analysis if the signal was strong enough. Otherwise, the signal from these short‐lived events may be lost by analyzing monthly averaged data.
4.4. Long‐Term Trends in Valley Fever Incidence
Our study highlighted a shift from 2000 to 2015 in the location of the highest valley fever incidence from the San Joaquin Valley of California to southcentral Arizona. Levels of valley fever incidence between the San Joaquin Valley and southcentral Arizona in the beginning of our time series analysis were similar. However, incidence in southcentral Arizona has been significantly increasing since 2000 and is now more than double the incidence rate in the San Joaquin Valley. Significant increases in incidence in counties surrounding the southcentral Arizona hot spot may suggest that the major endemic region is also expanding spatially.
It is unclear whether the extended peak in valley fever incidence from 2009 to 2011 is a result of precursor climate conditions or other factors related to demographics and health management. Peaks in annual valley fever incidence were suggested to be the result of changes in valley fever diagnosis protocol and reporting, especially the 2009 peak in Arizona (Arizona Department of Health Services, 2012). However, valley fever hospitalization rates in both Arizona and California also peaked in 2006 and from 2009 to 2011 (Arizona Department of Health Services, 2013; Koski et al., 2016; Sondermeyer et al., 2013). Simultaneous increases in both valley fever incidence and hospitalization rates suggest that these peaks may not be the result of changes in diagnosis alone.
4.5. The Potential Effects of Climate Change on Valley Fever Incidence Dynamics
Climate change may have varying effects on the suitable habitat, abundance, and dispersion of Coccidioides spp. Temperatures in the southwestern United States are expected to increase by at least 2°C by 2100, with the greatest increase expected during summer and autumn (Garfin et al., 2014). Given the temperature threshold for higher valley fever incidence identified in our analysis (Table 3), this warming may shift valley fever endemic regions farther north as Coccidioides spp. inhabits locations previously unsuitable for survival.
Projections of precipitation are more uncertain for the southwestern United States (Cayan et al., 2013; Garfin et al., 2014; Kunkel et al., 2013). Winter and spring precipitation is projected to decrease for the southern part of the region, but not significantly change in the north. Less water availability and increases in evaporative demand in the southwestern United States may limit the growth of Coccidioides spp. However, periods of drought throughout the southwestern United States are expected to intensify (Cayan et al., 2013), which could increase dust concentrations and Coccidioides spp. dispersal.
Considering changes in precipitation and temperatures together, the effects of climate change in the southwestern United States may favor both the enhanced growth and prolonged emission of Coccidioides spp. spores. Previous work identified populations in Tulare, Madera, and Kern Counties in California and in Pinal, Pima, and Maricopa Counties in southcentral Arizona as particularly vulnerable to increased valley fever incidence (Shriber et al., 2017). These counties already have some of the highest valley fever incidence and climate change may further increase the disease burden. The potential effects of climate change warrant enhanced surveillance of this disease and more work to understand the relationship between climate and valley fever incidence.
5. Conclusions
We assessed environmental controls on the spatial extent, seasonal dynamics, and long‐term trends of valley fever incidence using a new regional valley fever database. Our analysis drew upon over 149,000 case reports from 152 counties in the southwestern United States. We found that surface air temperature, precipitation, soil moisture, surface dust concentrations, NDVI, and cropland area all provided information regulating spatial and temporal patterns of valley fever incidence. Incidence was higher in regions with warm surface air temperatures and drier soils, with elevated levels of incidence in counties with a mean annual temperature above 11°C. The seasonal pattern of valley fever incidence differed across the southwestern United States and appeared to be linked to precipitation drivers, including the influence of Pacific storm systems and the North American monsoon. Two hot spots of valley fever in the San Joaquin Valley of California and in southcentral Arizona had maximum seasonal valley fever incidence following dry periods, supporting previous work showing that a wet season followed by a dry season increases incidence (Pappagianis, 1994; Smith, Beard, Rosenberger, et al., 1946).
Our results suggested there are several northern regions where valley fever is endemic that are outside the current domain identified by the CDC. To improve our ability to map endemic regions of valley fever, surveillance programs should be implemented to enhance disease management and reporting, especially in areas where Coccidioides spp. is hypothesized or proven to be present. Improving our ability to link the current magnitude and extent of valley fever with climate observations at a regional scale may help us to predict future changes in disease impact. Changes may occur in both the timing and levels of valley fever incidence, as climate change alters regional temperatures and precipitation. The relationships between climate and incidence defined in our study can be incorporated into future forecast models that estimate the risk of contracting valley fever.
Conflict of Interest
The authors declare no conflicts of interest relevant to this study.
Acknowledgments
M. E. Gorris is supported by a Department of Defense (DoD) National Defense Science and Engineering Graduate Fellowship (32 CFR 168a). L. A. Cat and K. K. Treseder acknowledge the UC Mexico Initiative, and K. K. Treseder was supported by National Science Foundation DEB‐1457160. C. S. Zender gratefully acknowledges support from the Borrego Valley Endowment Fund and the U.S. Department of Energy, Office of Science, Office of Biological and Environmental Research. J. T. Randerson received support from the Gordon and Betty Moore Foundation (GBMF3269), NASA Soil Moisture and Interdisciplinary Science Programs, and the U.S. Department of Energy Office of Science RUBISCO Science Focus Area. We thank Shane Brady from the Arizona Department of Health Services, Colleen McLellan from the California Department of Public Health, Joseph Bareta from the New Mexico Department of Health, Jennifer Thompson from the Nevada Department of Health and Human Services, and Randon Gruninger from the Utah Department of Health for providing us with valley fever case data from their respective state health agencies. Valley fever data may be obtained from the affiliated state health agencies. The authors declare no competing financial interests.
Gorris, M. E. , Cat, L. A. , Zender, C. S. , Treseder, K. K. , & Randerson, J. T. (2018). Coccidioidomycosis dynamics in relation to climate in the southwestern United States. GeoHealth, 2, 6–24. 10.1002/2017GH000095
This article was corrected on 15 JUL 2019. The online version of this article has been modified to include a Conflict of Interest statement.
References
- Arizona Department of Health Services (2012). Arizona—Valley fever report, 2007–2011. Arizona Department of Health Services. Phoenix, AZ. Retrieved from http://vfce.arizona.edu/sites/vfce/files/5-year-review-07-11.pdf
- Arizona Department of Health Services (2013). Valley fever 2012 annual report. Arizona Department of Health Services. Phoenix, AZ. Retrieved from http://www.azdhs.gov/documents/preparedness/epidemiology-disease-control/valley-fever/reports/valley-fever-2012.pdf
- Baptista‐Rosas, R. C. , Catalán‐Dibene, J. , Romero‐Olivares, A. L. , Hinojosa, A. , Cavazos, T. , & Riquelme, M. (2012). Molecular detection of Coccidioides spp. from environmental samples in Baja California: Linking valley fever to soil and climate conditions. Fungal Ecology, 5(2), 177–190. 10.1016/j.funeco.2011.08.004 [DOI] [Google Scholar]
- Baptista‐Rosas, R. C. , Hinojosa, A. , & Riquelme, M. (2007). Ecological niche modeling of Coccidioides spp. in western North American deserts. Annals of the New York Academy of Sciences, 1111(1), 35–46. 10.1196/annals.1406.003 [DOI] [PubMed] [Google Scholar]
- Barker, B. M. , Tabor, J. A. , Shubitz, L. F. , Perrill, R. , & Orbach, M. J. (2012). Detection and phylogenetic analysis of Coccidioides posadasii in Arizona soil samples. Fungal Ecology, 5(2), 163–176. 10.1016/j.funeco.2011.07.010 [DOI] [Google Scholar]
- Bercovitch, R. S. , Catanzaro, A. , Schwartz, B. S. , Pappagianis, D. , Watts, D. H. , & Ampel, N. M. (2011). Coccidioidomycosis during pregnancy: A review and recommendations for management. Clinical Infectious Diseases, 53(4), 363–368. 10.1093/cid/cir410 [DOI] [PubMed] [Google Scholar]
- Blair, J. E. , & Logan, J. L. (2001). Coccidioidomycosis in solid organ transplantation. Clinical Infectious Diseases, 33(9), 1536–1544. 10.1086/323463 [DOI] [PubMed] [Google Scholar]
- Boryan, C. , Yang, Z. , & Di, L. (2012). Deriving 2011 cultivated land cover data sets using USDA National Agricultural Statistics Service historic cropland data layers. Proceedings of Geoscience and Remote Sensing Symposium, 6297–6300. Munich, Germany: 2012 IEEE International. 10.1109/IGARSS.2012.6352699 [DOI]
- Boryan, C. , Yang, Z. , Mueller, R. , & Craig, M. (2011). Monitoring U.S. agriculture: The U.S. Department of Agriculture, National Agricultural Statistics Service, Cropland Data Layer Program. Geocarto International, 26(5), 341–358. 10.1080/10106049.2011.562309 [DOI] [Google Scholar]
- Bosilovich, M. G. , Akella, S. , Coy, L. , Cullather, R. , Draper, C. , Gelaro, R. , … & Wargan, K. (2015). MERRA‐2: Initial evaluation of the climate (Tech. Rep. NASA/TM‐2015‐10, 43). Greenbelt, MD: NASA Goddard Space Flight Center. Retrieved from https://gs6101-gmao.gsfc.nasa.gov/pubs/docs/Bosilovich803.pdf
- Bureau of Transportation Statistics (2016). Passenger travel facts and figures 2016. Washington, DC: U.S. Department of Transportation. Retrieved from http://www.rita.dot.gov/bts/sites/rita.dot.gov.bts/files/PTFF%202016_full.pdf
- Caldwell, C. T. (1932). Coccidioidal granuloma: A report of three cases recognized in Texas. Texas State Journal of Medicine, 28, 327–333. [Google Scholar]
- California Department of Public Health (2013). Hazard Evaluation System and Information Service, Preventing work‐related coccidioidomycosis (valley fever). Sacramento, CA: California Department of Public Health. Retrieved from http://www.elcosh.org/record/document/3684/d001224.pdf
- Campins, H. (1961). Coccidioidomycosis. Comments on the case histories in Venezuela. Mycopathologia, 15, 306–316. 10.1007/BF02136335 [DOI] [PubMed] [Google Scholar]
- Cayan, D. , Tyree, M. , Kunkel, K. E. , Castro, C. , Gershunov, A. , Barsugli, J. , … Duffy, P. (2013). Future climate: Projected average In Garfin G, Jardine A, Merideth R, Black M, & LeRoy S. (Eds.), Assessment of climate change in the southwest United States: A report prepared for the National Climate Assessment, (pp. 101–125). Washington, DC: Island Press; 10.5822/978-1-61091-484-0_6 [DOI] [Google Scholar]
- Centers for Disease Control and Prevention (2015). National Notifiable Diseases Surveillance System, Data Collection and Reporting. Atlanta, GA: CDC. Retrieved from https://wwwn.cdc.gov/nndss/data-collection.html
- Centers for Disease Control and Prevention (2017). Sources of valley fever (coccidioidomycosis). Atlanta, GA: CDC. Retrieved from https://www.cdc.gov/fungal/diseases/coccidioidomycosis/causes.html
- City of El Paso Department of Public Health (2015). Notifiable conditions report. El Paso, TX: City of El Paso Department of Public Health. Retrieved from https://www.elpasotexas.gov/~/media/files/coep/public%20health/epidemiology/2015%20epidemiology%20reports/notifiable%20conditions%20report%20_dec15_ir_ver2.ashx
- Comrie, A. C. (2005). Climate factors influencing coccidioidomycosis seasonality and outbreaks. Environmental Health Perspectives, 113(6), 688–692. 10.1289/ehp.7786 [DOI] [PMC free article] [PubMed] [Google Scholar]
- Coopersmith, E. J. , Bell, J. E. , Benedict, K. , Shriber, J. , McCotter, O. , & Cosh, M. H. (2017). Relating coccidioidomycosis (valley fever) incidence to soil moisture conditions. GeoHealth, 1(1), 51–63. 10.1002/2016GH000033 [DOI] [PMC free article] [PubMed] [Google Scholar]
- Crum, N. F. , Lederman, E. R. , Stafford, C. M. , Parrish, J. S. , & Wallace, M. R. (2004). Coccidioidomycosis: A descriptive survey of a reemerging disease, Clinical characteristics and current controversies. Medicine, 83(3), 149–175. 10.1097/01.md.0000126762.91040.fd [DOI] [PubMed] [Google Scholar]
- Daly, C. , Halbleib, M. , Smith, J. I. , Gibson, W. P. , Doggett, M. K. , Taylor, G. H. , … Pasteris, P. P. (2008). Physiographically sensitive mapping of climatological temperature and precipitation across the conterminous United States. International Journal of Climatology, 28(15), 2031–2064. 10.1002/joc.1688 [DOI] [Google Scholar]
- Daly, C. , Neilson, R. P. , & Phillips, D. L. (1994). A statistical‐topographic model for mapping climatological precipitation over mountainous terrain. Journal of Applied Meteorology, 33(2), 140–158. 10.1175/1520-0450(1994)033<0140:ASTMFM>2.0.CO;2 [DOI] [Google Scholar]
- de Macêdo, R. C. , Rosado, A. S. , da Mota, F. F. , Cavalcante, M. A. , Eulálio, K. D. , Filho, A. D. , … Wanke, B. (2011). Molecular identification of Coccidioides spp. in soil samples from Brazil. BMC Microbiology, 11(1), 108 10.1186/1471-2180-11-108 [DOI] [PMC free article] [PubMed] [Google Scholar]
- Didan, K. (2015). MOD13C2 MODIS/Terra vegetation indices monthly L3 global 0.05deg CMG V006, NASA EOSDIS Land Processes CAAD. Sioux Falls, SD: USGS Earth Resources Observation and Science (EROS) Center. 10.5067/MODIS/MOD13C2.006 [DOI]
- Durry, E. , Pappagianis, D. , Werner, S. B. , Hutwagner, L. , Sun, R. K. , Maurer, M. , … Pinner, R. W. (1997). Coccidioidomycosis in Tulare County, California, 1991: Reemergence of an endemic disease. Journal of Medical and Veterinary Mycology, 35(5), 321–326. 10.1080/02681219780001361 [DOI] [PubMed] [Google Scholar]
- Edwards, P. Q. , & Palmer, C. E. (1957). Prevalence of sensitivity to coccidioidin, with special reference to specific and nonspecific reactions to coccidioidin and to histoplasmin. Chest Journal, 31(1), 35–60. 10.1378/chest.31.1.35 [DOI] [PubMed] [Google Scholar]
- Elconin, A. F. , Egeberg, R. O. , & Lubarsky, R. (1957). Growth pattern of Coccidioides immitis in the soil of an endemic area In Proceedings of the Symposium on Coccidioidomycosis (pp. 168–170). Washington, DC: Public Health Service. [Google Scholar]
- Eulálio, K. D. , de Macêdo, R. C. , Cavalcanti, M. A. , Martins, L. M. , Lazéra, M. S. , & Wanke, B. (2001). Coccidioides immitis isolated from armadillos (Dasypus novemcinctus) in the state of Piauí, northeast Brazil. Mycopathologia, 149(2), 57–61. 10.1023/A:1007273019647 [DOI] [PubMed] [Google Scholar]
- Fisher, F. S. , Bultman, M. W. , Johnson, S. M. , Pappagianis, D. , & Zaborsky, E. (2007). Coccidioides niches and habitat parameters in the southwestern United States: A matter of scale. Annals of the New York Academy of Sciences, 1111(1), 47–72. 10.1196/annals.1406.031 [DOI] [PubMed] [Google Scholar]
- Friedman, L. , Smith, C. E. , Pappagianis, D. , & Berman, R. J. (1956). Survival of Coccidioides immitis under controlled conditions of temperature and humidity. American Journal of Public Health and the Nations Health, 46(10), 1317–1324. 10.2105/AJPH.46.10.1317 [DOI] [PMC free article] [PubMed] [Google Scholar]
- Garfin, G. , Franco, G. , Blanco, H. , Comrie, A. , Gonzalez, P. , Piechota, T. , … Waskom, R. (2014). Ch. 20: Southwest In Melillo J. M, Richmond T. C, & Yohe G. W. (Eds.), Climate change impacts in the United States: The third national climate assessment (pp. J462–J486). Washington, DC: U.S. Global Change Research Program; 10.7930/J08G8HMN [DOI] [Google Scholar]
- Greene, D. R. , Koenig, G. , Fisher, M. C. , & Taylor, J. W. (2000). Soil isolation and molecular identification of Coccidioides immitis . Mycologia, 92(3), 406–410. 10.2307/3761498 [DOI] [Google Scholar]
- Griffin, D. W. (2007). Atmospheric movement of microorganisms in clouds of desert dust and implications for human health. Clinical Microbiology Reviews, 20(3), 459–477. 10.1128/CMR.00039-06 [DOI] [PMC free article] [PubMed] [Google Scholar]
- Harp, E. L. , & Jibson, R. W. (1996). Landslides triggered by the 1994 Northridge, California, earthquake. Bulletin of the Seismological Society of America, 86(1B), S319–S332. [Google Scholar]
- Hector, R. F. , Rutherford, G. W. , Tsang, C. A. , Erhart, L. M. , McCotter, O. , Anderson, S. M. , … Galgiani, J. N. (2011). The public health impact of coccidioidomycosis in Arizona and California. International Journal of Environmental Research and Public Health, 8(12), 1150–1173. 10.3390/ijerph8041150 [DOI] [PMC free article] [PubMed] [Google Scholar]
- Huete, A. , Didan, K. , Miura, T. , Rodriguez, E. P. , Gao, X. , & Ferreira, L. G. (2002). Overview of the radiometric and biophysical performance of the MODIS vegetation indices. Remote Sensing of Environment, 83(1‐2), 195–213. 10.1016/S0034-4257(02)00096-2 [DOI] [Google Scholar]
- Huete, A. , Didan, K. , van Leeuwen, W. , Miura, T. , & Glenn, E. (2010). MODIS vegetation indices In Ramachandran B, Justice C, & Abrams M. (Eds.), Land remote sensing and global environmental change (pp. 579–602). New York, NY: Springer; 10.1007/978-1-4419-6749-7_26 [DOI] [Google Scholar]
- Hugenholtz, P. (1957). Climate and coccidioidomycosis In Proceedings of the symposium on Coccidioidomycosis (Vol. 575, pp. 136–143). Washington, DC: U.S. Public Health Services. [Google Scholar]
- Huppert, M. , Levine, H. B. , Sun, S. H. , & Peterson, E. T. (1967). Resistance of vaccinated mice to typical and atypical strains of Coccidioides immitis . Journal of Bacteriology, 94(4), 924–927. [DOI] [PMC free article] [PubMed] [Google Scholar]
- Kerrick, S. S. , Lundergan, L. L. , & Galgiani, J. N. (1985). Coccidioidomycosis at a university health service. American Review of Respiratory Disease, 131(1), 100–102. 10.1164/arrd.1985.131.1.100 [DOI] [PubMed] [Google Scholar]
- Kolivras, K. N. , & Comrie, A. C. (2003). Modeling valley fever (coccidioidomycosis) incidence on the basis of climate conditions. International Journal of Biometeorology, 47(2), 87–101. 10.1007/s00484-002-0155-x [DOI] [PubMed] [Google Scholar]
- Komatsu, K. , Vaz, V. , McRill, C. , Colman, T. , Comrie, A. , Sigel, K. , … Park, B. (2003). Increase in coccidioidomycosis—Arizona, 1998–2001. MMWR Morbidity and Mortality Weekly Report, 289(12), 1500–1502. 10.1001/jama.289.12.1500 [DOI] [Google Scholar]
- Koski, L. , Sylvester, T. , Narang, J. , & Sunenshine, R. (2016). Estimating trends of coccidioidomycosis in an endemic area after laboratory reporting changes: Maricopa County, 2006–2014. Proceedings of the 60th annual Coccidioidomycosis Study Group meeting, Vol. 60, pp. 59.
- Kunkel, K. E. , Stevens, L. E. , Stevens, S. E. , Sun, L. , Janssen, E. , Wuebbles, D. , … Dobson, J. G. (2013). Regional climate trends and scenarios for the U.S. National Climate Assessment: Part 5 In Climate of the Southwest U.S. (Tech. rep. NESDIS 142–5, pp. 51–70). Washington, DC: National Oceanic and Atmospheric Administration. [Google Scholar]
- Lacy, G. H. , & Swatek, F. E. (1974). Soil ecology of Coccidioides immitis at Amerindian middens in California. Applied Microbiology, 27(2), 379–388. [DOI] [PMC free article] [PubMed] [Google Scholar]
- Lauer, A. , Baal, J. D. , Baal, J. C. , Verma, M. , & Chen, J. M. (2012). Detection of Coccidioides immitis in Kern County, California, by multiplex PCR. Mycologia, 104(1), 62–69. 10.3852/11-127 [DOI] [PubMed] [Google Scholar]
- Litvintseva, A. P. , Marsden‐Haug, N. , Hurst, S. , Hill, H. , Gade, L. , Driebe, E. M. , … Chiller, T. (2015). Valley fever: Finding new places for an old disease: Coccidioides immitis found in Washington State soil associated with recent human infection. Clinical Infectious Diseases, 60(1), e1–e3. 10.1093/cid/ciu681 [DOI] [PMC free article] [PubMed] [Google Scholar]
- Liu, L.‐Y. , Li, X.‐Y. , Shi, P.‐J. , Gao, S.‐Y. , Wang, J.‐H. , Ta, W.‐Q. , … Xiao, B.‐L. (2007). Wind erodibility of major soils in the farming–pastoral ecotone of China. Journal of Arid Environments, 68(4), 611–623. 10.1016/j.jaridenv.2006.08.011 [DOI] [Google Scholar]
- Louie, L. , Ng, S. , Hajjeh, R. , Johnson, R. , Vugia, D. , Werner, S. B. , … Klitz, W. (1999). Influence of host genetics on the severity of coccidioidomycosis. Emerging Infectious Diseases, 5(5), 672–680. 10.3201/eid0505.990508 [DOI] [PMC free article] [PubMed] [Google Scholar]
- Maddy, K. T. (1957). Ecological factors of the geographic distribution of Coccidioides immitis . Journal of the American Veterinary Medical Association, 130(11), 475–476. [PubMed] [Google Scholar]
- Maddy, K. T. (1958). The geographic distribution of Coccidioides immitis and possible ecological implications. Arizona Medicine, 15(3), 178–188. [PubMed] [Google Scholar]
- Maddy, K. T. (1965). Observations on Coccidioides immitis found growing naturally in soil. Arizona Medicine, 22(4), 281–288. [PubMed] [Google Scholar]
- Marsden‐Haug, N. , Goldoft, M. , Ralston, C. , Limaye, A. P. , Chua, J. , Hill, H. , … Chiller, T. (2013). Coccidioidomycosis acquired in Washington State. Clinical Infectious Diseases, 56(6), 847–850. 10.1093/cid/cis1028 [DOI] [PubMed] [Google Scholar]
- McConnell, J. R. , Aristarain, A. J. , Banta, J. R. , Edwards, P. R. , & Simoes, J. C. (2007). 20th‐Century doubling in dust archived in an Antarctic Peninsula ice core parallels climate change and desertifications in South America. Proceedings of the National Academy of Sciences, 104(14), 5743–5748. 10.1073/pnas.0607657104 [DOI] [PMC free article] [PubMed] [Google Scholar]
- Molod, A. , Takacs, L. , Suarez, M. , & Bacmeister, J. (2015). Development of the GEOS‐5 atmospheric general circulation model: Evolution from MERRA to MERRA2. Geoscientific Model Development, 8(5), 1339–1356. 10.5194/gmd-8-1339-2015 [DOI] [Google Scholar]
- Neff, J. C. , Ballantyne, A. P. , Farmer, G. L. , Mahowald, N. M. , Conroy, J. L. , Landry, C. C. , … Reynolds, R. L. (2008). Increasing eolian dust deposition in the western United States linked to human activity. Nature Geoscience, 1(3), 189–195. 10.1038/ngeo133 [DOI] [Google Scholar]
- Nguyen, C. , Barker, B. M. , Hoover, S. , Nix, D. E. , Ampel, N. M. , Frelinger, J. A. , … Galgiani, J. N. (2013). Recent advances in our understanding of the environmental, epidemiological, immunological, and clinical dimensions of coccidioidomycosis. Clinical Microbiology Reviews, 26(3), 505–525. 10.1128/CMR.00005-13 [DOI] [PMC free article] [PubMed] [Google Scholar]
- Odio, C. D. , Marciano, B. E. , Galgiani, J. N. , & Holland, S. M. (2017). Risk factors for disseminated coccidioidomycosis, United States. Emerging Infectious Diseases, 23(2), 308–311. 10.3201/eid2302.160505 [DOI] [PMC free article] [PubMed] [Google Scholar]
- Pappagianis, D. (1994). Marked increase in cases of coccidioidomycosis in California: 1991, 1992, and 1993. Clinical Infectious Diseases, 19(Supplement_1), S14–S18. 10.1093/clinids/19.Supplement_1.14 [DOI] [PubMed] [Google Scholar]
- Park, B. J. , Sigel, K. , Vaz, V. , Komatsu, K. , McRill, C. , Phelan, M. , … Hajjeh, R. A. (2005). An epidemic of coccidioidomycosis in Arizona associated with climatic changes, 1998–2001. Journal of Infectious Diseases, 191(11), 1981–1987. 10.1086/430092 [DOI] [PubMed] [Google Scholar]
- Perera, P. , Stone, S. , Talan, D. A. , Moran, G. J. , & Pinner, R. (2002). Coccidioidomycosis in workers at an archeologic site–Dinosaur National Monument, Utah, June–July 2001. Annals of Emergency Medicine, 39(5), 566–569. 10.1067/mem.2002.123550 [DOI] [PubMed] [Google Scholar]
- Petersen, L. R. , Marshall, S. L. , Barton‐Dickson, C. , Hajjeh, R. A. , Lindsley, M. D. , Warnock, D. W. , … Morgan, J. (2004). Coccidioidomycosis among workers at an archeological site, northeastern Utah. Emerging Infectious Diseases, 10(4), 637–642. 10.3201/eid1004.030446 [DOI] [PMC free article] [PubMed] [Google Scholar]
- Rienecker, M. M. , Suarez, M. J. , Gelaro, R. , Todling, R. , Bacmeister, J. , Liu, E. , … Woollen, J. (2011). MERRA: NASA's modern‐era retrospective analysis for research and applications. Journal of Climate, 24(14), 3624–3648. 10.1175/JCLI-D-11-00015.1 [DOI] [PMC free article] [PubMed] [Google Scholar]
- Rodell, M. , & Beaudoing, H. K. (2007). GLDAS Noah Land Surface Model L4 monthly 0.25 × 0.25 degree V2.1. Greenbelt, MD: Goddard Earth Sciences Data and Information Services Center (GES DISC). 10.5067/7NP2052IA62C [DOI]
- Rodell, M. , Houser, P. R. , Jambor, U. E. A. , Gottschalck, J. , Mitchell, K. , Meng, C. J. , … Entin, J. K. (2004). The global land data assimilation system. Bulletin of the American Meteorological Society, 85(3), 381 10.1175/BAMS-85-3-381 [DOI] [Google Scholar]
- Rosenstein, N. E. , Emery, K. W. , Werner, S. B. , Kao, A. , Johnson, R. , Rogers, D. , … Perkins, B. A. (2001). Risk factors for severe pulmonary and disseminated coccidioidomycosis: Kern County, California, 1995–1996. Clinical Infectious Diseases, 32(5), 708–715. 10.1580/10806032(2001)012[0216:AOCL]2.0.CO;2 [DOI] [PubMed] [Google Scholar]
- Shriber, J. , Conlon, K. C. , Benedict, K. , McCotter, O. , & Bell, J. E. (2017). Assessment of vulnerability to coccidioidomycosis in Arizona and California. International Journal of Environmental Research and Public Health, 14(7), 680 10.3390/ijerph14070680 [DOI] [PMC free article] [PubMed] [Google Scholar]
- Smith, C. E. , Beard, R. R. , Rosenberger, H. G. , & Whiting, E. G. (1946). Effect of season and dust control on coccidioidomycosis. Journal of the American Medical Association, 132(14), 833–838. 10.1001/jama.1946.02870490011003 [DOI] [PubMed] [Google Scholar]
- Smith, C. E. , Beard, R. R. , Whiting, E. G. , & Rosenberger, H. G. (1946). Varieties of coccidioidal infection in relation to the epidemiology and control of the diseases. American Journal of Public Health and the Nations Health, 36(12), 1394–1402. 10.2105/AJPH.36.12.1394 [DOI] [PMC free article] [PubMed] [Google Scholar]
- Sondermeyer, G. , Lee, L. , Gilliss, D. , Tabnak, F. , & Vugia, D. (2013). Coccidioidomycosis‐associated hospitalizations, California, USA, 2000–2011. Emerging Infectious Diseases, 19(10), 1590–1597. 10.3201/eid1910.130427 [DOI] [PMC free article] [PubMed] [Google Scholar]
- Sotomayor, C. , Madrid, G. S. , & Torres, E. A. (1960). Aislamiento de Coccidioides immitis del suelo de Hermosillo, Sonora México. Revista Latinoamericana de Microbiologia, 3(4), 237–238. [Google Scholar]
- Stacy, P. K. R. , Comrie, A. C. , & Yool, S. R. (2012). Modeling valley fever incidence in Arizona using a satellite‐derived soil moisture proxy. GIScience and Remote Sensing, 49(2), 299–316. 10.2747/1548-1603.49.2.299 [DOI] [Google Scholar]
- Swatek, F. E. (1975). The epidemiology of coccidioidomycosis In Al‐Doory Y. (Ed.), The epidemiology of human mycotic diseases, (pp. 75–102). Springfield, IL: Charles C. Thomas. [Google Scholar]
- Swatek, F. E. , & Omieczynski, D. T. (1970). Isolation and identification of Coccidioides immitis from natural sources. Mycopathologia, 41(1‐2), 155–166. 10.1007/BF02051491 [DOI] [PubMed] [Google Scholar]
- Swatek, F. E. , Omieczynski, D. T. , & Plunkett, O. A. (1967). Coccidioides immitis in California In Proceedings of the 2nd Coccidioidomycosis Symposium (pp. 255–264). Tucson, AZ: Univ. of Arizona Press. [Google Scholar]
- Talamantes, J. , Behseta, S. , & Zender, C. S. (2007). Fluctuations in climate and incidence of coccidioidomycosis in Kern County, California: A review. Annals of the New York Academy of Sciences, 1111(1), 73–82. 10.1196/annals.1406.028 [DOI] [PubMed] [Google Scholar]
- Tamerius, J. D. , & Comrie, A. C. (2011). Coccidioidomycosis incidence in Arizona predicted by seasonal precipitation. PLoS One, 6(6), e21009 10.1371/journal.pone.0021009 [DOI] [PMC free article] [PubMed] [Google Scholar]
- Thompson, G. R. (2011). Pulmonary coccidioidomycosis. Seminars in Respiratory and Critical Care Medicine, 32(6), 754–763. 10.1055/s-0031-1295723 [DOI] [PubMed] [Google Scholar]
- Tong, D. Q. , Wang, J. X. L. , Gill, T. E. , Lei, H. , & Wang, B. (2017). Intensified dust storm activity and Valley fever infection in the southwestern United States. Geophysical Research Letters, 44(9), 4304–4312. 10.1002/2017GL073524 [DOI] [PMC free article] [PubMed] [Google Scholar]
- Tsang, C. A. , Anderson, S. M. , Imholte, S. B. , Erhart, L. M. , Chen, S. , Park, B. J. , … Sunenshine, R. H. (2010). Enhanced surveillance of coccidioidomycosis, Arizona, USA, 2007–2008. Emerging Infectious Diseases, 16(11), 1738–1744. 10.3201/eid1611.100475 [DOI] [PMC free article] [PubMed] [Google Scholar]
- Turabelidze, G. , Aggu‐Sher, R. K. , Jahanpour, E. , & Hinkle, C. J. (2015). Coccidioidomycosis in a state where it is not known to be endemic—Missouri, 2004–2013. MMWR Morbidity and Mortality Weekly Report, 64, 636–639. Retrieved from https://www.cdc.gov/mmwr/preview/mmwrhtml/mm6423a3.htm [PMC free article] [PubMed] [Google Scholar]
- U.S. Census Bureau (2011a). Intercensal estimates of the resident population for counties: April 1, 2000 to July 1, 2010. Suitland, MD: U.S. Census Bureau. Retrieved from http://www.census.gov/data/tables/time-series/demo/popest/intercensal-2000-2010-counties.html
- U.S. Census Bureau (2011b). Population distribution and change: 2000 to 2010. Suitland, MD: U.S. Census Bureau. Retrieved from https://www.census.gov/prod/cen2010/briefs/c2010br-01.pdf
- U.S. Census Bureau (2015). Counties population totals tables: 2010–2015. Suitland, MD: U.S. Census Bureau. Retrieved from http://www.census.gov/data/tables/2015/demo/popest/counties-total.html
- U.S. Geological Survey (2017). California Water Science Center: California's Central Valley. Reston, VA: U.S. Geological Survey. Retrieved from https://ca.water.usgs.gov/projects/central-valley/about-central-valley.html
- Werner, S. B. , & Pappagianis, D. (1973). Coccidioidomycosis in northern California, An outbreak among archeology students near Red Bluff. California Medicine, 119(3), 16–20. [PMC free article] [PubMed] [Google Scholar]
- Wilken, J. A. , Marquez, P. , Terashita, D. , NcNary, J. , Windham, G. , & Materna, B. (2014). Coccidioidomycosis among cast and crew members at an outdoor television filming event—California, 2012. MMWR Morbidity and Mortality Weekly Report, 63(15), 331–324. Retrieved from https://www.cdc.gov/mmwr/pdf/wk/mm6315.pdf [PMC free article] [PubMed] [Google Scholar]
- Wilken, J. A. , Sondermeyer, G. , Shusterman, D. , McNary, J. , Vugia, D. J. , McDowell, A. , … Gold, D. (2015). Coccidioidomycosis among workers constructing solar power farms, California, USA, 2011–2014. Emerging Infectious Diseases, 21(11), 1997–2005. 10.3201/eid2111.150129 [DOI] [PMC free article] [PubMed] [Google Scholar]
- Williams, P. L. , Sable, D. L. , Mendez, P. , & Smyth, L. T. (1979). Symptomatic coccidioidomycosis following a severe natural dust storm. An outbreak at the Naval Air Station, Lemoore, California. Chest, 76(5), 566–570. 10.1378/chest.76.5.566 [DOI] [PubMed] [Google Scholar]
- Woods, C. W. , McRill, C. , Plikaytis, B. D. , Rosenstein, N. E. , Mosley, D. , Boyd, D. , … Hajjeh, R. A. (2000). Coccidioidomycosis in human immunodeficiency virus‐infected persons in Arizona, 1994–1997: Incidence, risk factors, and prevention. The Journal of Infectious Diseases, 181(4), 1428–1434. 10.1086/315401 [DOI] [PubMed] [Google Scholar]
- Zender, C. S. , & Talamantes, J. (2006). Climate controls on valley fever incidence in Kern County, California. International Journal of Biometeorology, 50(3), 174–182. 10.1007/s00484-005-0007-6 [DOI] [PubMed] [Google Scholar]