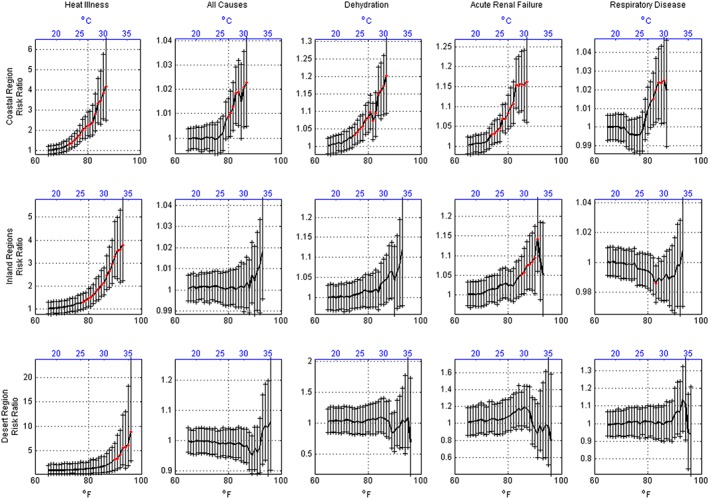
Figure 3.

Health impact observed for three regions of San Diego County associated with increasing daily maximum temperature threshold levels. The risk ratio was calculated as the average excess hospitalizations observed on days exceeding a given T max temperature threshold compared to the average observed over the all days, independent of any temperature threshold. Error bars give the 95% confidence interval for the estimate. Red markers indicate statistical significance at the 95% level using Monte Carlo resampling. A significant value means the estimate was found to be above the 95th percentile of the resampled distribution.
