

Abstract
Future climate change is expected to lengthen and intensify pollen seasons in the U.S., potentially increasing incidence of allergic asthma. We developed a proof‐of‐concept approach for estimating asthma emergency department (ED) visits in the U.S. associated with present‐day and climate‐induced changes in oak pollen. We estimated oak pollen season length for moderate (Representative Concentration Pathway (RCP) 4.5) and severe climate change scenarios (RCP8.5) through 2090 using five climate models and published relationships between temperature, precipitation, and oak pollen season length. We calculated asthma ED visit counts associated with 1994–2010 average oak pollen concentrations and simulated future oak pollen season length changes using the Environmental Benefits Mapping and Analysis Program, driven by epidemiologically derived concentration‐response relationships. Oak pollen was associated with 21,200 (95% confidence interval, 10,000–35,200) asthma ED visits in the Northeast, Southeast, and Midwest U.S. in 2010, with damages valued at $10.4 million. Nearly 70% of these occurred among children age <18 years. Severe climate change could increase oak pollen season length and associated asthma ED visits by 5% and 10% on average in 2050 and 2090, with a marginal net present value through 2090 of $10.4 million (additional to the baseline value of $346.2 million). Moderate versus severe climate change could avoid >50% of the additional oak pollen‐related asthma ED visits in 2090. Despite several key uncertainties and limitations, these results suggest that aeroallergens pose a substantial U.S. public health burden, that climate change could increase U.S. allergic disease incidence, and that mitigating climate change may have benefits from avoided pollen‐related health impacts.
Keywords: climate change, aeroallergens, asthma
Key Points
Aeroallergens pose a substantial U.S. public health burden
Climate change could increase U.S. allergic disease incidence
Mitigating climate change may have benefits from avoided pollen‐related health impacts
1. Introduction
Future climate change is expected to lengthen and intensify pollen seasons in parts of the United States [e.g., Zhang et al., 2015a; Fann et al., 2016], potentially leading to additional cases of allergic rhinitis (commonly known as “hay fever”) and allergic asthma episodes [Reid and Gamble, 2009; Sheffield et al., 2011]. Immunologic sensitization to allergens such as those contained in some types of pollen is a risk factor for the development of symptomatic allergic disease such as allergic asthma [Illi et al., 2006; Plaschke et al., 2000; Porsbjerg et al., 2006]. Among individuals with allergic asthma, exposure to the allergen(s) to which they are sensitized results in symptom exacerbation [Nielsen et al., 2002]. Asthma is widespread in the U.S., affecting ~7% of adults (2013) and 9% of children (2014) [U.S. Global Change Research Program (USGCRP), 2016], resulting in $56 billion in medical expenditures, missed work and school days, and early deaths in 2007 [Centers for Disease Control and Prevention (CDC), 2011]. Allergic asthma is the most common form of the disease [American Academy of Allergy, Asthma and Immunology (AAAAI), 2016].
The potential consequences of climate change on allergic disease in the U.S. are unknown and likely vary by allergen, as each would be affected in different ways. Climate‐induced temperature and precipitation changes may impact pollen season timing and length, the amount of pollen produced throughout the season, the allergen content of pollen grains, and the spatial distribution of species producing allergenic pollen [Fann et al., 2016; Albertine et al., 2014; Beggs, 2004; Bielory et al., 2012; Cecchi et al., 2010]. For tree pollen specifically, warmer temperatures both year‐round and in the months preceding the pollen season have been linked to increased season length [Ariano et al., 2010; Zhang et al., 2015a, 2015b]. Climate change may also increase pollen season intensity, typically indicated by the sum of daily pollen concentrations measured over an entire pollen season, for many species, including oak [Damialis et al., 2007; Frei, 1998; Frei and Leuschner, 2000; Jager et al., 2009; Levetin, 1998; Rasmussen, 2002; Spieksma et al., 1995, 2003; Teranishi et al., 2000; Ziello et al., 2012]. Pollen season intensification is driven by increases in both temperature [Frei, 1998; Hicks et al., 1994; Latorre, 1999; Teranishi et al., 2000] and precipitation [Dahl et al., 2013; Gonzalez Minero et al., 1998; McLauchlan et al., 2011] in the months prior to the pollen season.
Climate change and rising carbon dioxide levels may also alter the amount of allergen contained within pollen grains [Singer et al., 2005]. Consequently, future exposure to a defined quantity of pollen would lead to higher allergen exposure and potentially a greater likelihood of allergic disease development and exacerbation [Cecchi et al., 2010]. Increasing temperatures and changing precipitation patterns may also change the geographic range of plant species that produce allergenic pollen [Bellard et al., 2012]. Observed northward shifts in the U.S. distribution of tree species, including oaks [Woodall et al., 2009], could alter the type and quantity of allergenic pollen to which people in different geographic areas are exposed. Model projections indicate that climate change may increase the extent of habitats favorable to oaks in New England [Tang et al., 2012], though new colonization may be concentrated in the first 10–20 km from the current boundary within 100 years [Prasad et al., 2013].
Influences of climate change on future pollen seasons could substantially impact public health [Lake et al., 2016; Fann et al., 2016]. Here we develop a proof‐of‐concept approach for estimating how the burden of aeroallergens on U.S. public health may change under moderate and severe climate change scenarios, focusing on oak pollen impacts on asthma emergency department (ED) visits to demonstrate the approach. While other pollen types will likely be affected by climate change and result in changes in health impacts, oak pollen is the only pollen type at present for which previous studies have established relationships with both climate parameters [Zhang et al., 2014, 2015a] and health outcomes, particularly asthma emergency department (ED) visits [Darrow et al., 2012; Ito et al., 2015; Zhong et al., 2006].
This analysis was undertaken as part of the U.S. Environmental Protection Agency's (USEPA) Climate Change Impacts and Risk Analysis (CIRA) project [U.S. Environmental Protection Agency (USEPA), 2015a]. This multisector effort focuses on quantifying the degree to which global greenhouse gas mitigation and climate adaptation may reduce climate change‐related risks and damages in the United States compared to futures with little or no action. CIRA's use of an analytic framework based on consistent socioeconomic and climate projections across numerous analyses enables the comparison of economic impacts across space, time, and sectors. The aeroallergen analysis presented in this paper represents a new sectoral component in this broader framework. We use the USEPA Agency's Environmental Benefits Mapping and Analysis Program (BenMAP‐CE) [USEPA, 2016a] to estimate pollen‐related health impacts. BenMAP‐CE was originally developed for assessing health risks of criteria air pollutants, and an earlier version was also used to estimate temperature‐related mortality [Voorhees et al., 2011]. We adapt BenMAP‐CE for assessing the health impacts of aeroallergens, which will enable these types of analyses to be done in a consistent and transparent manner in the future.
2. Methods
We quantified the impacts of oak pollen on asthma ED visits in the U.S. Midwest, Northeast, and Southeast regions by combining demographic and epidemiologic information with oak pollen season length observed over recent years and simulated under moderate and severe scenarios of future climate change. Our approach was a three‐step process wherein (1) oak pollen season length and seasonal average pollen concentrations were collected from observations for recent years (1994–2010), (2) oak pollen season length was simulated for future years (2030, 2050, 2070, and 2090) using five global climate models driven by two scenarios of climate change (Representative Concentration Pathway (RCP) 4.5 and RCP8.5), and (3) epidemiologically derived health impact functions were combined with demographic data to estimate pollen‐associated asthma ED visits for all days in the observed recent and simulated future oak pollen season (see supporting information for conceptual diagrams). The models, scenarios, and years used for this analysis are consistent with guidance for analyses undertaken for the Fourth National Climate Assessment [USGCRP, 2015].
We focused on asthma ED visits because it has a well‐established relationship with daily pollen concentrations and because baseline asthma ED incidence data and valuation estimates per asthma ED visit are available across the U.S. We conducted a systematic literature search to identify studies examining the relationship between pollen and asthma ED visits in the U.S. and Canada (see supporting information). Only three studies—conducted in Atlanta [Darrow et al., 2012], New York City [Ito et al., 2015], and Cincinnati [Zhong et al., 2006]—reported associations with oak pollen at the genus level, and all three found that daily concentrations of oak (Quercus spp.) pollen were significantly associated with asthma ED visits (Table 1). An additional strength of these studies is that each evaluated daily concentrations of air pollutants (most commonly PM2.5 and ozone) as potential confounders of the relationship between pollen and asthma ED visits. Accordingly, we used concentration‐response relationships for oak pollen from these three studies.
Table 1.
Concentration‐Response Relationships for Oak Pollen and Asthma Emergency Department Visits in Atlanta, New York City, and Cincinnatia
| Study | Location | Exposure Definition | Outcome Definition | Functional Form | Rate Ratio per 100 grains/m3 Increase in Daily Pollen Concentration | Rate Ratio per 10% Increase in Daily Pollen Concentration |
|---|---|---|---|---|---|---|
| Darrow et al. [2012] | Atlanta, GA | Daily 3 day moving average concentration (full year) | Daily asthma ED visits | Log linear |
All ages: 1.009 (1.007, 1.012) |
NA |
|
Ages 0–4 years: 1.007 (1.003,1.01) | ||||||
|
Ages 5–17 years: 1.015 (1.01,1.02) | ||||||
| Ages 18+ years: 1.008 (1.005,1.01) | ||||||
| Ito et al. [2015] | New York, NY | Daily log‐transformed concentration (1 March to 10 June) | Asthma ED visits on the same day as the pollen concentration and up to 7 days afterward | Log‐log | NA |
All ages: 1.005 (1.003,1.006) |
| Ages 0–4 years: 1.003 (1.001,1.005) | ||||||
| Ages 5–17 years: 1.008 (1.006,1.01) | ||||||
| Ages 18–39 years: 1.004 (1.002,1.006) | ||||||
| Ages 40–64 years: 1.004 (1.002,1.006) | ||||||
| Ages 65+ years: 1.000 (0.997,1.002) | ||||||
| Zhong et al. [2006] | Cincinnati, OH | Daily concentration (April–October) | Daily asthma ED visits and outpatient clinic visits three days after the day of pollen measurement | Log linear | Ages 1–18 years: 1.27 (1.07, 1.51) | NA |
The number of significant digits reported varies across studies. NA: not available.
Using BenMAP‐CE, version 1.3.4, to systematize the process, we applied these concentration‐response relationships for each model/scenario/year combination using a health impact function consistent with the form of the epidemiological risk model. We conducted the analysis at a 0.5° × 0.5° spatial resolution, fine enough to account for geographical heterogeneity in population and asthma ED incidence rates, while also relatively coarse so as not to overstate spatial precision. This approach is generally analogous to that used for estimating the health impacts associated with tropospheric ozone and fine particulate matter air pollution in the U.S. [e.g., Fann et al., 2011, 2015]. For the studies conducted in Atlanta and Cincinnati [Darrow et al., 2012; Zhong et al., 2006], which specified a log linear function relating pollen concentrations to the logarithm of ED visit rates, the health impact function takes the following shape:
where AED is the gridded asthma ED visits attributable to the oak pollen concentration, Pop is the gridded population, Y 0 is the county‐level baseline daily rate of asthma ED visits in the population, β is the regional epidemiologically derived concentration‐response factor, and ΔP is the change in the gridded daily 24 h average oak pollen concentration.
For the Ito et al. [2015] study conducted in New York City, which specified a function relating log‐transformed pollen exposures to the logarithm of ED visit rates, the health impact function takes the following shape:
where Pop, Y 0, and β are as defined above and P b and P c are the gridded daily 24 h average oak pollen concentrations in the baseline and control scenarios, respectively.
This calculation was performed in each grid cell each day of the oak pollen season, where season length was drawn from the observed mean 1994–2010 oak pollen season for the present day and simulated for the future scenarios. We used BenMAP‐CE's built‐in pooling function to integrate the findings of the three oak pollen/asthma ED visit studies in Table 1 and produce pooled estimates of ED visit impacts for children ages 0–17 years and for adults ages 18–99 years. The child‐specific results are based on a two‐stage pooling procedure that first sums age relevant results from the New York City and Atlanta studies and then pools these results with the Cincinnati study using BenMAP's Pooled or Fixed Effects algorithm (see USEPA [2015b] for more details on BenMAP‐CE's pooling procedure). The adult‐specific results apply a similar two‐stage procedure to combine age‐relevant results from the New York City and Atlanta studies. We calculated pooled estimates of oak pollen‐related asthma ED visit for all grid cells in the three U.S. National Climate Assessment regions where these epidemiological studies were conducted: Midwest, Southeast, and Northeast.
We used information on oak pollen season length and concentrations as reported by Zhang et al. [2015a] as inputs to this analysis. Zhang et al. aggregated 1994–2010 average oak pollen season lengths and average season total concentrations at 58 pollen monitoring stations, including only stations that reported at least four full years of pollen data within that time frame (see Figure 1 and supporting information). The values reported by Zhang et al. [2015a] for each monitoring station are based on daily concentrations of pollen reported to the National Allergy Bureau (NAB), a network of monitoring stations primarily in the U.S. At NAB‐certified pollen stations, trained analysts measure and identify pollen to the genus level while adhering to a common set of sampling and reporting standards. In addition to these values, we obtained analogous oak pollen observations directly from the Dayton, OH, NAB station, to represent exposure levels in Cincinnati, as data for Cincinnati were not available in the data set aggregated by Zhang et al. [2015a]. Spatial interpolation techniques have been found to reliably estimate daily pollen concentrations in areas lacking monitors [DellaValle et al., 2012]; therefore, we interpolated seasonal average oak pollen concentrations and season length to grid cells between the monitors using the Voronoi Neighbor Averaging interpolation technique in BenMAP‐CE [USEPA, 2015b].
Figure 1.
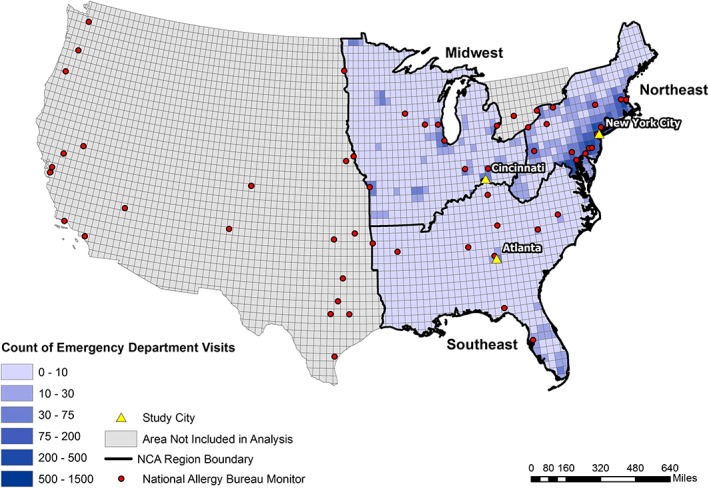
Asthma emergency department visits (all ages) in 2010 associated with 1994–2010 average oak pollen levels. Black outline indicates the Northeast, Southeast, and Midwest National Climate Assessment (NCA) regions used for this study.
We projected future oak pollen season length according to simulations of two climate change scenarios, Representative Concentration Pathway (RCP) 8.5 and RCP4.5 [van Vuuren et al., 2011], using output from five general circulation models (GCMs) for each, consistent with projections recommended for use in the forthcoming Fourth National Climate Assessment [USGCRP, 2015]. RCP8.5 represents a high greenhouse gas emission scenario, wherein radiative forcing rises to 8.5 W m−2 by 2100. RCP4.5 represents an intermediate scenario in which radiative forcing stabilizes to 4.5 W m−2 shortly after 2100. Comparing outcomes under RCP8.5 and RCP4.5 captures a range of uncertainties and plausible futures and provides information about potential benefits of climate change mitigation. The five GCMs differ in assumptions and parameterizations of atmospheric processes, giving a range of plausible outcomes based on each model's representation of the state of the science. As described further in the supporting information, the GCMs used were CCSM4 [Gent et al., 2011; Neale et al., 2013], GISS‐E2‐R [Schmidt et al., 2006], CanESM2 [von Salzen et al., 2013], HadGEM2‐ES [Collins et al., 2011; Davies et al., 2005], and MIROC5 [Watanabe et al., 2010].
To project future pollen exposure, we first conducted a literature search to identify studies describing the development of models to project future climate‐driven changes in pollen levels. To date, few studies have developed projection methods relating climate variables to pollen exposure changes across large U.S. geographic areas, for oak or any pollen type. Most of these associate climate variables with pollen season length, rather than exposure concentrations. We concluded that the current literature does not support projections of future daily pollen concentrations. For this proof‐of‐concept approach, therefore, we applied the same 1994–2010 average seasonal mean oak pollen concentration to future years and projected only changes in season length. While this approach holds constant the seasonal average pollen concentrations, future seasonal total pollen varies in proportion to season length. Our framework can incorporate projections of future seasonal average pollen concentrations in addition to changing season length as the literature evolves.
Future oak pollen season length was projected using the relationship between temperature, precipitation, and oak pollen season length across the continental U.S. developed by Zhang et al. [2015a] along with gridded temperature and precipitation simulations from five climate models. While other studies projecting future pollen season length cover only one or several pollen types, a small set of monitoring stations, and/or a limited geographical area, the model developed by Zhang et al. [2015a] covered the entire continental U.S. and was based on long‐term observations of pollen concentrations (covering 15 years). Zhang et al. [2015a] found that the two observation‐based models examined were able to simulate observations within 0–6 days for the majority of monitoring stations. For these reasons, we used the Zhang et al. [2015a] simplified observation‐based regression for oak pollen season length, characterized by the following equation:
where MSL is the modeled season length (days), T JFM is January through March mean temperature (°C), and P c is cumulative precipitation (mm) from September of the previous year to August of the forecast year. While a strength of this model is that it was developed with broad spatial coverage across the continental U.S., a limitation is that it assumes the same relationship applies in all locations. As the literature evolves, our approach can incorporate new relationships with greater spatial specificity.
This equation was used to generate scalars (defined as the ratio of modeled future season length to modeled 1994–2010 average season length) for each grid cell, GCM, RCP scenario, and year. Modeled temperature and precipitation (20 year averages around 2030, 2050, 2070, and 2090) were drawn from the Localized Constructed Analogs (LOCA) data set, which provides daily projections through 2100 at 1/16° resolution for daily maximum temperature (t max), daily minimum temperature (t min), and daily precipitation [Pierce et al., 2014, 2015; Bureau of Reclamation, 2016]. We take the average of the daily t max and t min to generate average daily temperature, used to calculate T JFM. Future oak pollen season length was then projected for each monitor, GCM, RCP scenario, and year by multiplying the 1994–2010 mean observed season length at each monitor by the appropriate grid cell‐level scalar.
For present and future population, we used Integrated Climate and Land‐Use Scenarios (ICLUS) version 2 data sets [USEPA, 2016b] with the age distribution from ICLUS v1 [USEPA, 2009]. We developed city‐level baseline incidence rates for Atlanta, New York City, and Cincinnati from the baseline data on ED visits reported by the epidemiology studies. For each study, we developed daily per‐person rates by dividing the reported ED visit counts by the corresponding 2010 census population for the specified age group in the study area and by the number of days associated with the reported count (e.g., 365 days per year for annual counts). For regional baseline incidence rates, we calculated a 3 year (2010–2012) average of total annual asthma ED visits for the Northeast, Midwest, and South regions for visits with primary diagnosis code ICD‐9 493 from the Agency for Healthcare Research and Quality's Healthcare Cost and Utilization Project (HCUP) National Emergency Department Sample (NEDS) [Agency for Healthcare Research and Quality, 2016]. For city‐specific estimates, we developed daily per‐person rates by dividing the reported ED visit counts in each region by either the corresponding 2010 census population (or study population if counts were reported for only the study cohort) for the specified age group and by the number of days associated with the reported count.
We assigned a monetary value to pollen‐related ED visits by applying the mean of two cost‐per‐visit estimates that are included in BenMAP‐CE's set of standard valuation functions [Smith et al., 1997; Stanford et al., 1999]. Both studies report cost‐of‐illness based estimates: the Smith et al. [1997] study is based on analysis of 1.2 million asthma‐related ED visits in 1987 at a cost of $186 million in 1987 dollars for an average cost of $155/visit, and the Stanford et al. [1999] study reported a cost of $335/visit based on 1996–1997 data. Adjusted for inflation, the Smith and Stanford studies report a per‐visit cost in 2015 dollars of $532 and $447, with a mean of $490/visit. We estimate undiscounted results for each future year and an overall net present value estimated by applying a 3% discounting rate per year, and linearly interpolating between analysis years. Beyond these health care costs, we excluded additional economic costs that could result from lost productivity (e.g., lost work days).
3. Results
3.1. Impacts of Observed Recent Oak Pollen
We estimated that 1994–2010 mean oak pollen concentrations were associated with 21,200 (95% confidence interval (CI), 1,800–56,200) asthma ED visits in the Northeast, Southeast, and Midwest regions, using 2010 population and baseline incidence rates (Table 2 and Figure 1). Nearly 70% (14,600) of those occurred among children aged 0–17 years (64–74% regionally). Approximately 42% of the three‐region total oak pollen‐related asthma ED visits occurred in the Southeast, 35% in the Northeast, and 23% in the Midwest. Since we used the same approach to pool the three city‐specific concentration‐response functions for all regions, differences in regional impacts are driven by the magnitude of pollen concentrations, exposed populations, and baseline asthma ED rates. Normalizing results by population, we find similar impacts per 100,000 people in the Southeast and Northeast (15 all‐age oak pollen‐related asthma ED visits per 100,000 people) and smaller impacts in the Midwest (11). Population‐normalized impacts for children aged 0–17 years are substantially higher than the total population (30–52 oak pollen‐related asthma ED visits per 100,000 people, depending on the region). The estimated economic value of these oak pollen‐related asthma ED visits in 2010 is $10.4 million (2015$).
Table 2.
Regional Oak Pollen‐Related Asthma Emergency Department Visits in 2010, Using Average 1994–2010 Oak Pollen Concentrations and Season Lengtha
| Region | Age Range | Oak Pollen‐Related Asthma ED Visits (× 100) | Population (× 100,000) | Oak Pollen‐Related Asthma ED Visits per 100,000 People | % of Age‐Specific Three‐Region Total |
|---|---|---|---|---|---|
| Total three regions | 0–17 | 146 (10–352) | 335 | 44 | ‐ |
| 18–99 | 66 (7–210) | 1,181 | 6 | ‐ | |
| Total | 212 (17–562) | 1,516 | 14 | ‐ | |
| Northeast | 0–17 | 49 (3–107) | 103 | 48 | 34% |
| 18–99 | 25 (3–79) | 376 | 7 | 38% | |
| Total | 74 (6–186) | 480 | 15 | 35% | |
| Southeast | 0–17 | 65 (6–154) | 125 | 52 | 44% |
| 18–99 | 23 (4–72) | 448 | 5 | 35% | |
| Total | 88 (9–225) | 574 | 15 | 42% | |
| Midwest | 0–17 | 32 (1–92) | 106 | 30 | 22% |
| 18–99 | 18 (1–59) | 357 | 5 | 27% | |
| Total | 50 (2–151) | 463 | 11 | 23% |
Confidence intervals (95%, in parentheses) represent uncertainty in concentration‐response function only.
As we have the highest confidence in results for the three cites from which concentration‐response functions were drawn, we calculated asthma ED visits associated with oak pollen exposure in New York City, Cincinnati, and Atlanta separately, using the city definitions from the underlying epidemiology studies (see supporting information). Age ranges differ from the regional results because here we applied the city‐specific concentration‐response functions, rather than pooling across all three. We estimated that 1994–2010 average oak pollen concentrations were associated with 3200 (1800–4900) asthma ED visits in New York City using 2010 population, 1000 (300–1600) in Cincinnati, and 100 (100–100) in Atlanta (Table S3).
3.2. Projections of Future Oak Pollen Season Length
To estimate future oak pollen‐related asthma ED visits, we first simulated changes in oak pollen season length under moderate and severe climate scenarios. We found that the oak pollen season generally lengthened under both climate scenarios (Figure 2). Under RCP4.5, oak pollen season length grew by an average of 4.7% (range from −2.2% to 17.7%) across all 59 monitor locations, using multimodel averages (average across all five GCMs). For RCP8.5, season length grew by an average of 7.4% (range from −3.5% to 27.6%). The oak pollen season lengthened from the 1994–2010 baseline for nearly 95% of RCP/monitor/year combinations. The greatest increases in future season length across all GCMs and years for both RCP4.5 and RCP8.5 were estimated for Fargo, ND (monitor ID 2), followed by Olean, NY (monitor ID 16). The oak pollen season shortened for 5.5% of RCP/monitor/year combinations (occurring at 11 monitoring stations, including Atlanta), due to increased future precipitation, which has an inverse relationship with season length and offsets the lengthening effect of increased temperature. Scalars relating projected to current modeled season length are generally larger in more northern latitudes (Figure 2) owing to longer present‐day season in the scalar denominator for southern locations and higher projected temperature increases in the north (see Figures S4–S8 in the supporting information) for most GCMs. In terms of the temporal trend of changes in oak pollen season length, each 20 year time step modeled increased the oak pollen season length by 0.5–2% for RCP4.5 and 1.4–2.9% for RCP8.5 (average across five GCMs and 59 monitoring stations). Results for individual climate models, which were used to estimate health impacts, can be found in the supporting information.
Figure 2.
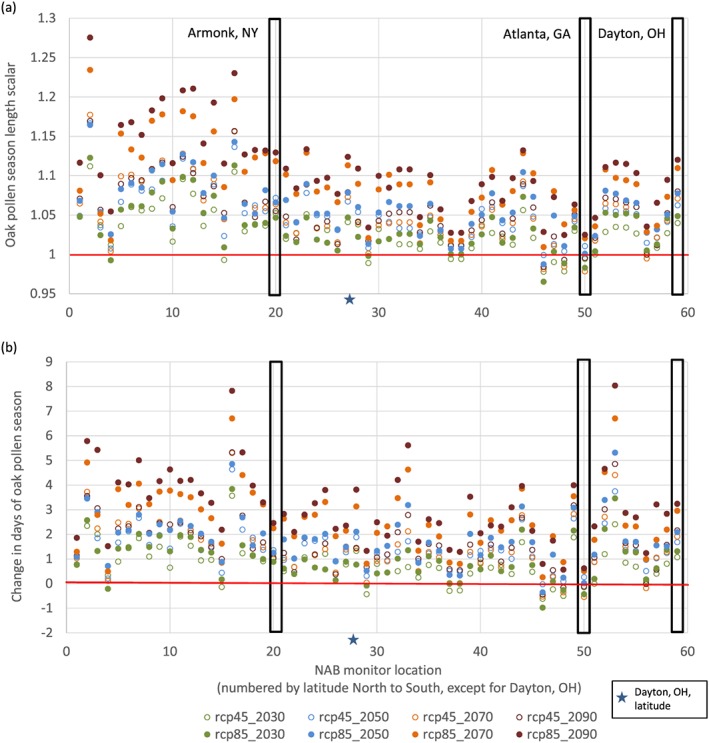
Multimodel mean (a) ratio of modeled oak pollen season length to modeled 1994–2010 average season length (days) and (b) change in number of days of the oak pollen season (calculated by multiplying the scalars in Figure 2a by the observed 1994–2010 average season length) for each National Allergy Bureau monitor location, climate scenario (RCP4.5 and RCP8.5), and year. Results above the red horizontal lines indicate oak pollen season lengthening from the 1994–2010 average. Black boxes highlight the three cities with epidemiology studies (Armonk, NY, used as surrogate for New York City; Dayton, OH, used as surrogate for Cincinnati). See supporting information for a table of monitor location names and ID numbers.
3.3. Impacts of Simulated Future Oak Pollen
For future health impacts associated with oak pollen, we estimated that holding oak pollen constant at 1994–2010 average levels, population growth alone would increase oak pollen‐related asthma ED visits by 29%, 24%, and 11% from 2010 to 2090 in the Southeast, Northeast, and Midwest, respectively (Table 3). Total baseline oak pollen‐related asthma ED visits reach 23,700 (95% CI, 2100–64,500) in 2050 and 26,000 (2400–71,200) in 2090. The associated economic value of these impacts rises to $12.7 million in 2090 for a total net present value of $346.2 million (2015$) assuming a 3% discount rate.
Table 3.
Annual Regional Oak Pollen‐Related Asthma ED Visits (All Ages) for Baseline (1994–2010 Oak Pollen Season With Future Population) and Change From Baseline for Each RCP Scenario, Averaged Across All Five General Circulation Modelsa
| Year | Scenario | Northeast | Southeast | Midwest | Total |
|---|---|---|---|---|---|
| 2030 | Baseline | 7,700 (700–19,700) | 9,300 (1,000–24,400) | 5,100 (200–16,000) | 22,100 (2,000–60,100) |
| RCP4.5 | 300 (4%) | 100 (1%) | 200 (3%) | 600 (3%) | |
| RCP8.5 | 0 (0%) | 100 (1%) | 200 (4%) | 300 (1%) | |
| 2050 | Baseline | 8,300 (700–21,300) | 10,100 (1,100–26,500) | 5,300 (300–16,000) | 23,700 (2,100–64,500) |
| RCP4.5 | 500 (6%) | 300 (3%) | 100 (2%) | 900 (4%) | |
| RCP8.5 | 500 (6%) | 400 (4%) | 400 (7%) | 1,200 (5%) | |
| 2070 | Baseline | 8,900 (800–22,800) | 10,900 (1,200–28,600) | 5,400 (300–17,300) | 25,200 (2,300–68,600) |
| RCP4.5 | 400 (5%) | 200 (2%) | 400 (7%) | 1,000 (4%) | |
| RCP8.5 | 900 (10%) | 500 (5%) | 600 (11%) | 2,000 (8%) | |
| 2090 | Baseline | 9,200 (900–23,600) | 11,300 (1300–29,900) | 5,500 (300–17,700) | 26,000 (2,400–71,200) |
| RCP4.5 | 500 (5%) | 200 (2%) | 400 (7%) | 1,100 (4%) | |
| RCP8.5 | 1,100 (12%) | 700 (6%) | 700 (13%) | 2,500 (10%) |
Confidence intervals (95%, in parentheses) reflect uncertainty in concentration‐response function only.
We isolate the influence of climate‐induced changes in season length from the influence of population growth by comparing results for the RCP scenarios in each year to the baseline in the same year. For both RCP scenarios, oak pollen‐related asthma ED visits increase over baseline 1994–2010 levels in all regions and years except for RCP8.5 in 2030 for the Northeast (Table 3). In 2050, changes in the oak pollen season length under RCP4.5 and RCP8.5 could increase oak pollen‐related asthma ED visits by 4% (900) and 5% (1200), respectively, compared to the 1994–2010 baseline. Largest percentage increases in 2050 over the baseline are seen in the Midwest (7% over the baseline for RCP8.5), followed by the Northeast (6%), and finally the Southeast (4%). By 2090, oak pollen‐related asthma ED visits increase by 4% (1100) and 10% (2500) over the baseline for RCP4.5 and RCP8.5, respectively, with the largest changes in the Midwest (13%), followed by the Northeast (12%) and Southeast (6%). The marginal net present value (additional to the baseline value of $346.2 million) of these impacts through 2090 is estimated to be $8.3 million and $10.4 million for RCP4.5 and RCP8.5, respectively, assuming a 3% discount rate. See the supporting information for results for Atlanta, Cincinnati, and New York City using city‐specific concentration‐response functions.
Comparing severe (RCP8.5) versus moderate climate change (RCP4.5), we estimate that severe climate change leads to more oak pollen‐related asthma ED visits than does moderate climate change for all years except 2030 (Table 3). In later years, RCP8.5 damages increasingly exceed those of RCP4.5. By 2090, RCP8.5 leads to 10% more oak pollen‐related asthma ED visits over the baseline, while 1400 (>50%) of these would be avoided under RCP4.5. This difference between pollen‐related health impacts under the two climate scenarios is driven most by the changes in the Northeast, followed by the Southeast.
3.4. Sensitivity to Changes in Oak Tree Growth
Though the results presented here assume a constant spatial distribution of oak trees, climate‐induced temperature and precipitation changes can lead to shifts in forest composition and health, which could affect future pollen production. We tested the sensitivity of results to changes in oak tree growth rates (in kilogram aboveground biomass per hectare per year, or kg/ha/yr) at three pollen monitor sites: Armonk, NY (near New York City); Atlanta, GA; and Dayton, OH (near the Cincinnati site). Effects of temperature and precipitation on oak tree growth and survival in these locations were taken from an analysis of 89 tree species measurements across the U.S. from 1984 to 2013, including only species with >2000 individual trees measured multiple times. These projection account only for the survival and growth of existing trees and do not account for total oak biomass. Using these relationships between temperature, precipitation, and tree growth rates, we calculated the ratio of future to present‐day oak tree growth rates for each location, RCP scenario, and year. These ratios can be applied as scalars of the core results. We found that these multimodel average scalars are all greater than 1, indicating that climatic conditions at these sites are likely to be favorable to oak tree growth (Figure 3). Oak tree growth increased from 1% to 5% and 2% to 8% for RCP4.5 and RCP8.5, respectively, and increased more in Atlanta than in Armonk and Dayton. These results suggest that oak pollen concentrations are likely to increase in the future in addition to lengthening of the oak pollen season. Results for oak pollen‐related asthma ED visits based only on season length may therefore underestimate future oak pollen health impacts.
Figure 3.
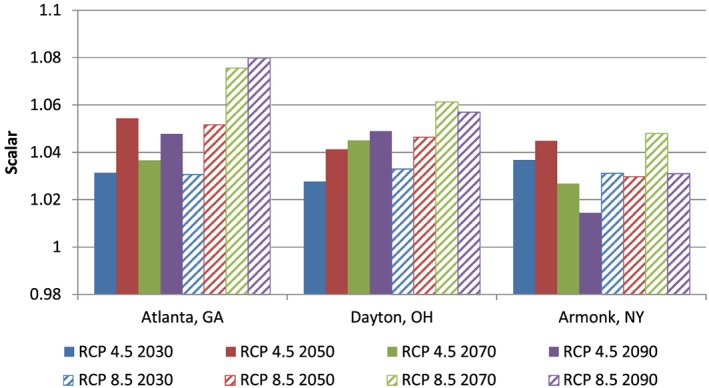
Multimodel mean oak tree growth scalars, defined as the ratio of modeled to present‐day oak tree growth rate, in kilogram aboveground biomass of oaks per hectare per year (kg/ha/yr). A scalar greater than 1 indicates an increase in oak tree growth rate.
4. Discussion
We estimated that oak pollen was associated with 21,200 (95% CI, 1800–56,200) oak pollen‐related asthma ED visits in the Northeast, Southeast, and Midwest U.S. in 2010 and could grow to 23,700 (2100–64,500) by 2050 and 26,000 (2400–71,200) by 2090 due to population growth alone. Most of these occurred among children age <18 years (64–74% regionally). Temperature and precipitation changes simulated under severe climate change (as modeled under RCP8.5) could increase oak pollen season length and associated asthma ED visits by as much as 5% and 10% on average in 2050 and 2090, respectively. A moderate climate change scenario (RCP4.5) could hold these increases to approximately 4% through 2090, avoiding 1400 (>50%) of the additional oak pollen‐related asthma ED visits estimated under severe climate change. Results for future impacts are highly uncertain; though we averaged results across a five‐member climate model ensemble and incorporated error in the underlying epidemiological studies into confidence intervals, methods to simulate future pollen exposure from meteorological variables are in an early stage of development. Our analysis therefore provides an exploratory approximation of future climate impacts on oak pollen season length and associated health impacts. This analysis can be updated as new studies advance our ability to parameterize the influence of precipitation, temperature, and potentially other meteorological variables on pollen exposure.
To our knowledge, this is the first study to estimate the impact of aeroallergen seasonality and concentration on allergic disease incidence in the U.S. for either the present‐day or future. Compared with nationwide impacts of ambient air pollution, estimated oak pollen asthma ED visits in the Northeast, Midwest, and Southeast are ~13% of estimated asthma ED visits associated with fine particulate matter (PM2.5) among children age <18 years (110,000) and ~110% of those associated with ozone among all ages in 2005 (19,000) [Fann et al., 2011]. Our estimate of 300 additional asthma ED visits in these three regions associated with oak pollen under RCP8.5 in 2030 is approximately 25% of the 1200 additional respiratory ED visits (inclusive of but not limited to asthma) nationwide estimated to be associated with increased ozone exposure for the same year and climate scenario [Fann et al., 2015]. Since our study included only one pollen type, these comparisons suggest that the burden of aeroallergens on asthma ED visits in the U.S. could be of a similar magnitude to that of ambient air pollution. However, oak pollen exposure‐response relationships may already capture some portion of health effects from other pollen types since some are temporally correlated [e.g., Ito et al., 2015].
Our study was limited in several important ways. We focused on three U.S. regions where it could reasonably be assumed that the three city‐specific oak pollen‐asthma ED visit concentration‐response relationships apply to broader populations. Though these regions contain the highest prevalence of oak trees and ~50% of the population in the U.S., additional health impacts from oak pollen exposure would be expected elsewhere. Climate change consequences could also be underestimated because some of the largest increases in oak pollen season length occurred in the west (Figure 2). We were unable to obtain baseline incidence rates for our region‐level analyses that matched the time windows of the New York and Cincinnati studies. Therefore, baseline incidence rates used for the Northeast and Midwest impact estimates are annual average rates, which are most likely lower than the average daily rates of ED visits over the pollen season. A comparison of the city‐specific seasonal rates and regional annual baseline rates suggests that seasonal rates could be up to 40–70% higher than annual rates, though not all of this difference may be due to the effect of the pollen season. We excluded climate impacts on seasonal average pollen concentrations [Damialis et al., 2007; Frei, 1998; Frei and Leuschner, 2000; Jager et al., 2009; Levetin, 1998; Rasmussen, 2002; Spieksma et al., 1995; Spieksma et al., 2003; Teranishi et al., 2000; Ziello et al., 2012], changes in pollen allergenicity [Ahlholm et al., 1998; Cecchi et al., 2010], and the geographic range of oak trees [Bellard et al., 2012; Woodall et al., 2009; Tang et al., 2012]. While we focused only on asthma ED visits, limited evidence from Canada and the Netherlands suggests that pollen (including oak) may also increase risk of cardiovascular disease [Brunekreef et al., 2000; Weichenthal et al., 2016]. We also did not evaluate potential impacts on other allergic outcomes such as allergen sensitization or allergic rhinitis, which have trended upward along with asthma prevalence in the U.S. [Meng et al., 2016]. For these reasons, our results are likely to be underestimates of the health burden of oak pollen changes. Finally, while our analysis projects future increases in the length of the pollen season due to warming temperatures, there may be an upper limit to this lengthening due to exceedance of a winter chilling threshold required to initiate flowering in some tree taxa [Miller‐Rushing and Primack, 2008].
There were several sources of uncertainty that we were unable to quantify. Though evidence suggests that our spatial interpolation technique is reliable for daily pollen concentrations [DellaValle et al., 2012], actual oak pollen concentrations between monitoring stations are unknown. Our 0.5° × 0.5° grid resolution was too coarse to capture intraurban heterogeneity of oak pollen exposures [Weinberger et al., 2015]. Our projections of future pollen season lengths depend on temperature and precipitation changes simulated by coarsely resolved global general circulation models, each with some inherent degree of uncertainty. Given the inverse relationship between precipitation and oak pollen season length, underestimating future precipitation would lead to an overestimate in results. We attempted to address this by leveraging an ensemble of five downscaled climate models to show a range of plausible outcomes under two scenarios of climate change. We extrapolated oak pollen‐asthma ED visit concentration‐response relationships from three cities to broader geographical regions where demographics and health status may differ. Though the underlying epidemiological studies controlled for air pollutants, we did not consider any synergistic or antagonistic effects of air pollution exposure on health responses [e.g., Bartra et al., 2007; Cakmak et al., 2012; Kinney et al., 2016]. We held the age structure and baseline asthma ED visits constant from the present‐day to 2090, as little information was available on which to project these values to the future, and used an annual ED visit rate that may not match the rate during the warm season. It is unknown whether these uncertainties contribute to overestimation or underestimation of the impacts of climate change on allergic episodes and allergic disease more broadly.
5. Conclusion
Although these results were limited to one pollen type (oak) and one health outcome (asthma emergency department visits), they suggest that (1) aeroallergens pose a substantial burden on U.S. public health, particularly in the Northeast and for children age <18 years; (2) future climate change is likely to increase allergic disease incidence in the U.S., and (3) mitigating climate change would have benefits in terms of avoided pollen‐related health impacts. However, wide confidence intervals and several key methodological limitations constrain the strength of these conclusions. As more studies quantify the relationship between pollen concentrations and health effects and explore the links between climate change and pollen exposure, this methodology can be applied to additional pollen types and health outcomes, and uncertainties and limitations may be narrowed.
Supporting information
Supporting Information S1
Acknowledgments
Opinions expressed in this article are those of the authors and do not necessarily represent those of their employers or affiliated institutions, including the U.S. EPA. Weinberger's contribution to this publication was as a paid consultant and was not part of her Brown University duties or responsibilities. The authors are grateful to Lyndsey Darrow and Kazuhiko Ito for providing pollen effect estimates, Chris Clark and Panos Georgopoulos for helpful discussions on future pollen projections, Kevin Horn and Quinn Thomas for providing a capability to project oak growth and survival associated with climate changes, Lewis Ziska for constructive comments, and Jim Anderton, Nicole Thompson, Charlotte Benishek, and Stefanie Penn for excellent research assistance. This research was funded by the U.S. Environmental Protection Agency under contract EP‐D‐14‐032. The authors declare that they have no competing financial interests. The data used are listed in the references and supporting information.
Anenberg, S. C. , Weinberger K. R., Roman H., Neumann J. E., Crimmins A., Fann N., Martinich J., and Kinney P. L. (2017), Impacts of oak pollen on allergic asthma in the United States and potential influence of future climate change, GeoHealth, 1, 80–92, doi: 10.1002/2017GH000055.
References
- Agency for Healthcare Research and Quality (2016), HCUP Nationwide Emergency Department Sample (NEDS), Healthcare Cost and Utilization Project (HCUP). 2011, 2012, 2013. Agency for Healthcare Research and Quality, Rockville, Md. [Available at http://hcupnet.ahrq.gov/HCUPnet.jsp.]
- Ahlholm, J. U. , Helander M. L., and Savolainen J. (1998), Genetic and environmental factors affecting the allergenicity of birch (Betula pubescens ssp. Czerepanovii [orl.] hamet‐ahti) pollen, Clin. Exp. Allergy, 28, 1384–1388. [DOI] [PubMed] [Google Scholar]
- Albertine, J. M. , Manning W. J., DaCosta M., Stinson K. A., Muilenberg M. L., and Rogers C. A. (2014), Projected carbon dioxide to increase grass pollen and allergen exposure despite higher ozone levels, PLoS One, 9, e111712. [DOI] [PMC free article] [PubMed] [Google Scholar]
- American Academy of Allergy, Asthma and Immunology (AAAAI) (2016), Allergic asthma. [Available at https://www.aaaai.org/conditions-and-treatments/conditions-dictionary/allergic-asthma, accessed July 6 2016.]
- Ariano, R. , Canonica G. W., and Passalacqua G. (2010), Possible role of climate changes in variations in pollen seasons and allergic sensitizations during 27 years, Ann. Allergy Asthma Immunol., 104, 215–222. [DOI] [PubMed] [Google Scholar]
- Bartra, J. , Mullol J., del Cuvillo A., Davila I., Ferrer M., Jauregui I., Montoro J., Sastre J., and Valero A. (2007), Air pollution and allergens, J. Investig. Allergol. Clin. Immunol., 17(Suppl 2), 3–8. [PubMed] [Google Scholar]
- Beggs, P. J. (2004), Impacts of climate change on aeroallergens: Past and future, Clin. Exp. Allergy, 34, 1507–1513. [DOI] [PubMed] [Google Scholar]
- Bellard, C. , Bertelsmeier C., Leadley P., Thuiller W., and Courchamp F. (2012), Impacts of climate change on the future of biodiversity, Ecol. Lett., 15, 365–377. [DOI] [PMC free article] [PubMed] [Google Scholar]
- Bielory, L. , Lyons K., and Goldberg R. (2012), Climate change and allergic disease, Curr. Allergy Asthma Rep., 12, 485–494. [DOI] [PubMed] [Google Scholar]
- Brunekreef, B. , Hoek G., Fischer P., and Spieksma F. T. M. (2000), Relation between airborne pollen concentrations and daily cardiovascular and respirator‐disease mortality, Lancet, 355(9214), 1517–1518. [DOI] [PubMed] [Google Scholar]
- Bureau of Reclamation (2016), Downscaled CMIP3 and CMIP5 climate projections—Addendum release of downscaled CMIP5 climate projections (LOCA) and comparison with preceding information, U.S. Department of the Interior, Bureau of Reclamation. [Available at http://gdo-dcp.ucllnl.org/downscaled_cmip_projections/techmemo/Downscaled_Climate_Projections_Addendum_Sept2016.pdf, Accessed November 10, 2016.]
- Cakmak, S. , Dales R. E., and Coates F. (2012), Does air pollution increase the effect of aeroallergens on hospitalization for asthma?, J. Allergy Clin. Immunol., 129, 228–231. [DOI] [PubMed] [Google Scholar]
- Cecchi, L. , et al. (2010), Projections of the effects of climate change on allergic asthma: The contribution of aerobiology, Allergy, 65, 1073–1081. [DOI] [PubMed] [Google Scholar]
- Centers for Disease Control and Prevention (CDC) (2011), Vital signs, May 2011. [Available at http://www.cdc.gov/vitalsigns/asthma/, accessed July 6 2016.]
- Collins, W. J. , et al. (2011), Development and evaluation of an Earth‐System model—HadGEM2, Geosci. Model Dev., 4, 1051–1075. [Google Scholar]
- Dahl, A. , et al. (2013), The onset, course and intensity of the pollen season, in Allergenic Pollen: A Review of the Production, Release, Distribution and Health Impacts, edited by Sofiev M. and Bergmann K. C., pp. 29–70, Springer, Dordrecht, Netherlands. [Google Scholar]
- Damialis, A. , Halley J. M., Gioulekas D., and Vokou D. (2007), Long‐term trends in atmospheric pollen levels in the city of Thessaloniki, Greece, Atmos. Environ., 41, 7011–7021. [Google Scholar]
- Darrow, L. A. , Hess J., Rogers C. A., Tobert P. E., Klein M., and Sarnat S. E. (2012), Ambient pollen concentrations and emergency department visits for asthma and wheeze, J. Allergy Clin. Immunol., 130, 630–638. [DOI] [PMC free article] [PubMed] [Google Scholar]
- Davies, T. , et al. (2005), A new dynamical core for the Met Office's global and regional modelling of the atmosphere, Q. J. R. Meteorol. Soc., 131, 1759–1782. [Google Scholar]
- DellaValle, C. T. , Triche E. W., and Bell M. L. (2012), Spatial and temporal modeling of daily pollen concentrations, Int. J. Biometeorol., 56, 183–194. [DOI] [PubMed] [Google Scholar]
- Fann, N. , Lamson A. D., Anenberg S. C., Wesson K., Risley D., and Hubbell B. J. (2011), Estimating the national public health burden associated with exposure to ambient PM2.5 and ozone, Risk Anal., 32(1), 81–95. [DOI] [PubMed] [Google Scholar]
- Fann, N. , Nolte C. G., Dolwick P., Spero T. L., Curry Brown A., Phillips S., and Anenberg S. (2015), The geographic distribution and economic value of climate change‐related ozone health impacts in the United States in 2030, J. Air Waste Manag. Assoc., 65(5), 570–580. [DOI] [PubMed] [Google Scholar]
- Fann, N. , Brennan T., Dolwick P., Gamble J. L., Ilacqua V., Kolb L., Nolte C. G., Spero T. L., and Ziska L. (2016), Ch. 3: Air Quality Impacts, in The Impacts of Climate Change on Human Health in the United States: A Scientific Assessment, pp. 69–98, U.S. Global Change Research Program, Washington, D. C, 10.7930/J0GQ6VP6. [DOI] [Google Scholar]
- Frei, T. (1998), The effects of climate change in Switzerland 1969–1996 on airborne pollen quantities from hazel, birch and grass, Grana, 37, 172–179. [Google Scholar]
- Frei, T. , and Leuschner R. M. (2000), A change from grass pollen induced allergy to tree pollen induced allergy: 30 years of pollen observation in Switzerland, Aerobiologia, 16, 407–416. [Google Scholar]
- Gent, P. R. , et al. (2011), The community climate system model version 4, J. Clim., 24, 4973–4991. [Google Scholar]
- Gonzalez Minero, F. J. , Candau P., Tomas C., and Morales J. (1998), Airborne grass (Poaceae) pollen in southern Spain. Results of a 10‐year study (1987–96), Allergy, 53, 266–274. [DOI] [PubMed] [Google Scholar]
- Hicks, S. , Helander M., and Heino S. (1994), Birch pollen production, transport and deposition for the period 1984–1993 at Kevo, northernmost Finland, Aerobiologia, 10, 183–191. [Google Scholar]
- Illi, S. , von Mutius E., Lau S., Niggemann B., Gruber C., and Wahn U. (2006), Perennial allergen sensitization early in life and chronic asthma in children: A birth cohort study, Lancet, 368, 763–770. [DOI] [PubMed] [Google Scholar]
- Ito, K. , Weinberger K. R., Robinson G. S., Sheffield P. E., Lall R., Mathes R., Ross Z., Kinney P. L., and Matte T. D. (2015), The associations between daily spring pollen counts, over‐the‐counter allergy medication sales, and asthma emergency department visits syndrome in New York City, 2002–2012, Environ. Health, 14, 71. [DOI] [PMC free article] [PubMed] [Google Scholar]
- Jager, S. , Nilsson S., Berggren B., Pessi A.‐M., Helander M., and Ramfjord H. (2009), Trends of some airborne tree pollen in the Nordic countries and Austria, 1980–1993: A comparison between Stockholm, Trondheim, Turku and Vienna, Grana, 35, 171–178. [Google Scholar]
- Kinney, P. , Weinberger K. R., and Miller R. L. (2016), Interactions among climate change, air pollutants, and aeroallergens, in Impacts of Climate Change on Allergens and Allergic Diseases, edited by Beggs P. J., pp. 113–136, Cambridge Univ. Press, Cambridge, U. K. [Google Scholar]
- Lake, I. R. , et al. (2016), Climate change and future pollen allergy in Europe, Environ. Health Perspect., 125, 385–391. [DOI] [PMC free article] [PubMed] [Google Scholar]
- Latorre, F. (1999), Differences between airborne pollen and flowering phenology of urban trees with reference to production, dispersal and interannual climate variability, Aerobiologia, 15, 131–141. [Google Scholar]
- Levetin, E. (1998), A long‐term study of winter and early spring tree pollen in the Tulsa, Oklahoma atmosphere, Aerobiologia, 14, 21–28. [Google Scholar]
- McLauchlan, K. K. , Barnes C. S., and Craine J. M. (2011), Interannual variability of pollen productivity and transport in mid‐North America from 1997 to 2009, Aerobiologia, 27, 181–189. [Google Scholar]
- Meng, Q. , Nagarajan S., Son Y., Koutsoupias P., and Bielory L. (2016), Asthma, oculonasal symptoms, and skin test sensitivity across National Health and Nutrition Examination Surveys, Ann. Allergy Asthma Immunol., 116, 118–125. [DOI] [PubMed] [Google Scholar]
- Miller‐Rushing, A. J. , and Primack R. B. (2008), Effects of winter temperatures on two birch (Betula) species, Tree Physiol., 28, 659–664. [DOI] [PubMed] [Google Scholar]
- Neale, R. B. , Richter J., Park S., Lauritzen P. H., Vavrus S. J., Rasch P., and Zhang M. (2013), The mean climate of the community Atmosphere Model (CAM4) in forced SST and fully coupled experiments, J. Clim., 26, 5150–5168. [Google Scholar]
- Nielsen, G. D. , Hansen J. S., Lund R. M., Bergqvist M., Larsen S. T., Clausen S. K., Thygesen P., and Poulsen O. M. (2002), IgE‐mediated asthma and rhinitis. I: A role of allergen exposure?, Pharmacol. Toxicol., 90, 231–242. [DOI] [PubMed] [Google Scholar]
- Pierce, D. W. , Cayan D. R., and Thrasher B. L. (2014), Statistical downscaling using localized constructed analogs (LOCA), J. Hydrometeorol., 15(6), 2558–2585. [Google Scholar]
- Pierce, D. W. , Cayan D. R., Maurer E. P., Abatzoglou J. T., and Hegewisch K. C. (2015), Improved bias correction techniques for hydrological simulations of climate change, J. Hydrometeorol., 16, 2421–2442. [Google Scholar]
- Plaschke, P. P. , Janson C., Norrman E., Bjornsson E., Ellbjar S., and Jarvholm B. (2000), Onset and remission of allergic rhinitis and asthma and the relationship with atopic sensitization and smoking, Am. J. Respir. Crit. Care Med., 162, 920–924. [DOI] [PubMed] [Google Scholar]
- Porsbjerg, C. , von Linstow M. L., Ulrik C. S., Nepper‐Christensen S., and Backer V. (2006), Risk factors for onset of asthma: A 12‐year prospective follow‐up study, Chest, 129, 309–316. [DOI] [PubMed] [Google Scholar]
- Prasad, A. M. , Gardiner J. D., Iverson L. R., Matthews S. N., and Peters M. (2013), Exploring tree species colonization potentials using spatially explicit simulation model: implications for four oaks under climate change, Global Change Biol., 19, 2196–2208. [DOI] [PubMed] [Google Scholar]
- Rasmussen, A. (2002), The effects of climate change on the birch pollen season in Denmark, Aerobiologia, 18, 253–265. [Google Scholar]
- Reid, C. E. , and Gamble J. L. (2009), Aeroallergens, allergic disease, and climate change: Impacts and adaptation, Ecohealth, 6, 458–470. [DOI] [PMC free article] [PubMed] [Google Scholar]
- Schmidt, G. A. , et al. (2006), Present‐day atmospheric simulations using GISS ModelE: Comparison to in situ, satellite, and reanalysis data, J. Climate, 19, 153–192. [Google Scholar]
- Sheffield, P. E. , Weinberger K. R., and Kinney P. L. (2011), Climate change, aeroallergens and pediatric allergic disease, Mt Sinai J. Med., 78, 78–84. [DOI] [PMC free article] [PubMed] [Google Scholar]
- Singer, B. D. , Ziska L. H., Frenz D. A., Gebhard D. E., and Straka J. G. (2005), Increasing Amb a 1 content in common ragweed (Ambrosia artemisiifolia) pollen as a function of rising atmospheric CO2 concentration, Funct. Plant Biol., 32, 667–670. [DOI] [PubMed] [Google Scholar]
- Smith, D. H. , Malone D. C., Lawson K. A., Okamoto L. J., Battista C., and Saunders W. B. (1997), A national estimate of the economic costs of asthma, Am. J. Respir. Crit. Care Med., 156(3), 787–793. [DOI] [PubMed] [Google Scholar]
- Spieksma, F. T. M. , Emberlin J. C., Hjelmroos M., Jager S., and Leuschner R. M. (1995), Atmospheric birch (Betula) pollen in Europe: Trends and fluctuations in annual quantities and the starting dates of the seasons, Grana, 34, 51–57. [Google Scholar]
- Spieksma, F. T. M. , et al. (2003), Quantitative trends in annual totals of five common airborne pollen types (Betula, Quercus, Poaceae, Urtica, and Artemisia) at five pollen‐monitoring stations in western Europe, Aerobiologia, 19, 171–184. [Google Scholar]
- Stanford, R. , McLaughlin T., and Okamoto L. J. (1999), The cost of asthma in the emergency department and hospital, Am. J. Respir. Crit. Care Med., 160(1), 211–215. [DOI] [PubMed] [Google Scholar]
- Tang, G. , Beckage B., and Smith B. (2012), The potential transient dynamics of forests in New England under historical and projected future climate change, Clim. Change, 114, 357–377. [Google Scholar]
- Teranishi, H. , Kenda Y., Katoh T., Kasuya M., Oura E., and Taira H. (2000), Possible role of climate change in the pollen scatter of Japanese cedar Cryptomeria japonica in Japan, Climate Res., 14, 65–70. [Google Scholar]
- U.S. Environmental Protection Agency (USEPA) (2009), Land‐use scenarios: Scenarios consistent with climate change storylines. [Available at https://cfpub.epa.gov/ncea/risk/recordisplay.cfm?deid=203458&CFID=66570454&CFTOKEN=42432877, Accessed October 10, 2016.]
- U.S. Environmental Protection Agency (USEPA) (2015a), Climate change in the United States: Benefits of global action, United States Environmental Protection Agency, Office of Atmospheric Programs, EPA 430‐R‐15‐001.
- U.S. Environmental Protection Agency (USEPA) (2015b), Environmental Benefits Mapping and Analysis Program–Community Edition (BenMAP‐CE): User manual appendices, Research Triangle Park, NC. [Available at https://www.epa.gov/sites/production/files/2015-04/documents/benmap-ce_user_manual_appendices_march_2015.pdf, Accessed October 27, 2016.]
- U.S. Environmental Protection Agency (USEPA) (2016a), Environmental Benefits Mapping and Analysis Program—Community Edition (BenMAP‐CE). Research Triangle Park, NC. [Available at http://www.epa.gov/air/benmap, Accessed October 27, 2016.]
- U.S. Environmental Protection Agency (USEPA) (2016b), Updates to the demographic and spatial allocation models to produce Integrated Climate and Land Use Scenarios (ICLUS) (version 2) (external review draft). [Available at https://cfpub.epa.gov/ncea/global/recordisplay.cfm?deid=306651, Accessed October 10, 2016.]
- U.S. Global Change Research Program (USGCRP) (2016), The impacts of climate change on human health in the United States: A scientific assessment. U.S. Global Change Research Program. [Available at http://www.globalchange.gov/health-assessment, Accessed August 1, 2016.]
- U.S. Global Change Research Program (USGCRP) (2015), Scenarios and interpretive science coordinating group, U.S. Global Change Research Program General Decisions Regarding Climate‐Related Scenarios for Framing the Fourth National Climate Assessment. [Available at https://scenarios.globalchange.gov/sites/default/files/External%20memo%20NCA4%20scenarios%20framing_20150506.pdf, Accessed August 31, 2016.]
- van Vuuren, D. P. , et al. (2011), The representative concentration pathways: An overview, Clim. Change, 109, 5. [Google Scholar]
- von Salzen, K. , et al. (2013), The Canadian fourth generation atmospheric global climate model (CanAM4). Part I: representation of physical processes, Atmos. Ocean, 51, 104–125. [Google Scholar]
- Voorhees, A. S. , Fann N., Fulcher C., Dolwick P., Hubbell B., Bierwagen B., and Morefield P. (2011), Climate change‐related temperature impacts on warm season heat mortality: A proof‐of‐concept methodology using BenMAP, Environ. Sci. Technol., 45, 1450–1457. [DOI] [PubMed] [Google Scholar]
- Watanabe, M. , et al. (2010), Improved climate simulation by MIROC5: Mean states, variability, and climate sensitivity, J. Climate, 23, 6312–6335. [Google Scholar]
- Weichenthal, S. , Lavigne E., Villenveuve P. J., and Reeves F. (2016), Airborne pollen concentrations and emergency room visits for myocardial infarction: A multicity case‐crossover study in Ontario, Canada, Am. J. Epidemiol., 183(7), 613–621. [DOI] [PubMed] [Google Scholar]
- Weinberger, K. R. , Kinney P. L., and Lovasi G. S. (2015), A review of spatial variation of allergenic tree pollen within cities, Arboricult. Urban For., 41(2), 57–68. [Google Scholar]
- Woodall, C. W. , Oswalt C. M., Westfall J. A., Perry C. H., Nelson M. D., and Finley A. O. (2009), An indicator of tree migration in forests of the eastern United States, For. Ecol. Manage., 256, 1434–1444. [Google Scholar]
- Zhang, Y. , Bielory L., and Georgopoulos P. (2014), Climate change effect on Betula (birch) and Quercus (oak) pollen seasons in US, Int. J. Biometeorol., 58(5), 909–919. [DOI] [PMC free article] [PubMed] [Google Scholar]
- Zhang, Y. , Bielory L., Cai T., Mi Z., and Georgopoulos P. (2015a), Predicting onset and duration of airborne allergenic pollen season in the United States, Atmos. Environ., 103, 297–306. [DOI] [PMC free article] [PubMed] [Google Scholar]
- Zhang, Y. , Bielory L., Mi Z., Cai T., Robock A., and Georgopoulos P. (2015b), Allergenic pollen season variations in the past two decades under changing climate in the United States, Global Change Biol., 21, 1581–1589. [DOI] [PMC free article] [PubMed] [Google Scholar]
- Zhong, W. , Levin L., Reponen T., Hershey G. K., Adhikari A., Shukla R., and LeMasters G. (2006), Analysis of short‐term influences of ambient aeroallergens on pediatric asthma hospital visits, Sci. Total Environ., 370, 330–336. [DOI] [PMC free article] [PubMed] [Google Scholar]
- Ziello, C. , et al. (2012), Changes to airborne pollen counts across Europe, PLoS One, 7, e34076. [DOI] [PMC free article] [PubMed] [Google Scholar]
Associated Data
This section collects any data citations, data availability statements, or supplementary materials included in this article.
Supplementary Materials
Supporting Information S1