

Abstract
With over 8 billion tons of plastic produced since 1950, polymers represent one of the most widely used—and most widely discarded—materials. Ambient-temperature photoreforming offers a simple and low-energy means for transforming plastic waste into fuel and bulk chemicals but has previously only been reported using precious-metal- or Cd-based photocatalysts. Here, an inexpensive and nontoxic carbon nitride/nickel phosphide (CNx|Ni2P) photocatalyst is utilized to successfully reform poly(ethylene terephthalate) (PET) and poly(lactic acid) (PLA) to clean H2 fuel and a variety of organic chemicals under alkaline aqueous conditions. Ni2P synthesized on cyanamide-functionalized carbon nitride is shown to promote efficient charge separation and catalysis, with a photostability of at least 5 days. The real-world applicability of photoreforming is further verified by generating H2 and organics from a selection of nonrecyclable waste—including microplastics (polyester microfibers) and food-contaminated plastic—and upscaling the system from 2 to 120 mL while maintaining its efficiency for plastic conversion.
1. Introduction
The majority (86%) of plastic packaging accumulates in landfills or escapes into the environment.1−4 Plastic pollution represents not only a global environmental crisis but also a loss of valuable resources. Most polymers are synthesized from fossil fuels, and it is predicted that 3.5 billion barrels of oil ($176 billion) could be saved each year if all global plastic waste were recycled.4 However, the implementation of widespread recycling is limited by suboptimal waste management, lack of awareness, and the diverse range of chemistries, complexities, and sizes of polymer products.1,2
Small polymer pieces known as microplastics (defined as ≤5 mm) are particularly problematic for recycling.5−7 Microplastics are present in a variety of products and are also formed when plastic degrades over time.6 Their small size and dilution make collection and reuse challenging, which contributes to their ubiquity in oceans,5−7 drinking water, and salt8−10 around the world. Even among plastics that can be reused, recycling has its limitations. Many polymers are downcycled into lower quality products. Only 7% of recycled poly(ethylene terephthalate) (PET) bottles, for example, are recast as bottles.1 Existing management structures are currently incapable of sustainably and economically processing the vast variety of plastic waste, and new technologies for transforming end-of-use polymers into valuable products are urgently required.
One such technology is photoreforming (PR), in which sunlight and a photocatalyst generate H2 from an organic substrate and water. The substrate acts as an electron donor and is oxidized by the excited photocatalyst to other organic molecules. The photogenerated electrons are then transferred from the photocatalyst to a cocatalyst and reduce water to H2 (Figure 1). H2 is a particularly valuable product given its high demand for agricultural, pharmaceutical, chemical, and renewable energy applications.11,12 Unlike existing H2 production technologies like steam reforming of fossil fuels13 or thermal-based approaches for converting plastic into oil,14 PR can be conducted at ambient temperature and pressure, uses sunlight as its only energy input, and produces fuel-cell-grade H2.15 While photocatalytic degradation of plastics (typically to microplastics and CO2) has been researched for several decades,16−18 PR offers a novel approach by not only mitigating plastic waste but also generating valuable chemical products. The thermodynamics of the overall PR process are also nearly energy neutral:19 PR of ethylene glycol at room temperature requires ΔG° = 9.2 kJ mol–1 (E°cell = −0.01 V, see the Supporting Information for details).
Figure 1.
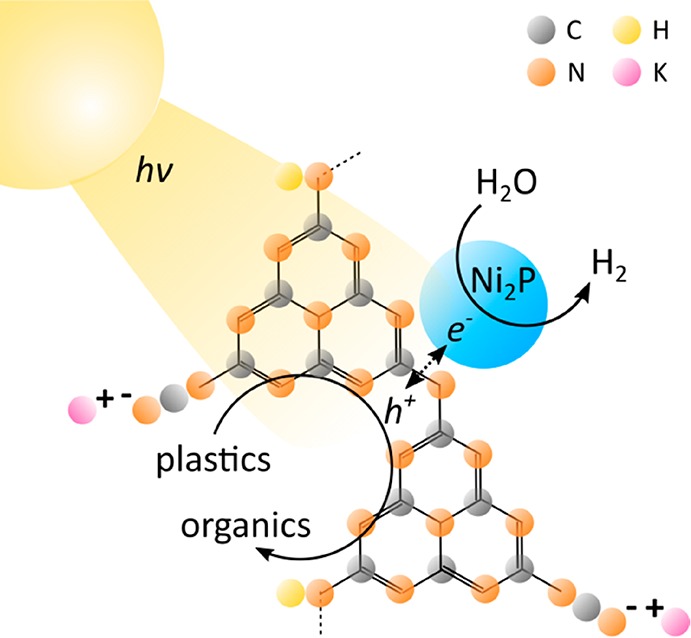
Schematic diagram of the polymer photoreforming process using a CNx|Ni2P photocatalyst.
Although PR of simple molecules and biomass has been researched extensively,19−21 plastic substrates have been largely overlooked. The same characteristics that make polymer recycling difficult—complex structures, low water solubility, and poor biodegradability—also make PR more challenging. As a result, there are only two previous studies on PR of plastics: one employed an expensive and UV-absorbing TiO2|Pt photocatalyst,22 whereas the other used toxic CdS/CdOx quantum dots.23
We propose cyanamide-functionalized carbon nitride (CNx) coupled with a nickel phosphide (Ni2P) H2 evolution cocatalyst as a noble-metal- and Cd-free alternative for PR of plastic waste (Figure 1). Carbon nitride is a nontoxic and inexpensive polymeric photocatalyst,24−26 and the introduction of cyanamide defects improves its photocatalytic efficiency.27 CNx features a band gap of 2.7 eV that allows for visible light absorption and band edges (conduction band −0.5 V vs NHE, valence band +2.2 V vs NHE at pH 6)28 suitable for the PR reactions. CNx has also been used for PR of biomass with various cocatalysts under a wide pH range.29 With key characteristics including visible-light absorption, alkaline stability, low cost, and nontoxicity, CNx is a competitive alternative to both CdS/CdOx and TiO2|Pt for polymer PR. Ni2P has previously been utilized with unfunctionalized carbon nitride (H2NCNx) and a soluble sacrificial electron donor (triethanolamine) for H2 evolution30−32 and has potential for plastic PR given its alkaline compatibility and relatively high H2 evolution activity.33
Here, we demonstrate that the CNx|Ni2P photocatalyst can be employed under alkaline conditions to produce H2 and organic chemicals from PET and poly(lactic acid) (PLA, a biodegradable but not typically recycled alternative to PET). We further apply this system to real-world, nonrecyclable waste, including polyester microfibers and oil-contaminated PET, and show that it can be upscaled from 2 to 120 mL without efficiency losses. This proof-of-concept demonstration of noble-metal-free, Cd-free, and visible-light-driven plastic PR with CNx|Ni2P offers a sustainable and scalable route toward simultaneous plastic waste elimination and renewable fuel and chemical synthesis.
2. Synthesis and Characterization of the Photocatalyst
CNx was prepared from melamine at 550 °C,34 followed by postsynthetic functionalization with potassium thiocyanate27 according to slightly modified literature procedures. CNx|Ni2P was produced by adapting a literature synthesis:30 CNx was stirred with NiCl2·6H2O and NaH2PO2·H2O in H2O, dried under vacuum, annealed at 200 °C for 1 h under Ar, washed, and dried prior to use (see the Experimental Methods section for details). Inductively coupled plasma optical emission spectrometry (ICP-OES) confirms that Ni is present in the sample at a concentration of 15.3 mgNi gCNx–1 (the ideal Ni loading of a CNx|Ni2P-2 wt % catalyst is 15.9 mgNi gCNx–1, Table S1). However, considerably more P is observed than expected for a Ni:P ratio of 2:1 (52.2 mgP gCNx–1 versus the ideal 4.2 mgP gCNx–1, Table S1). This same trend is evident in the X-ray photoelectron spectroscopy (XPS) quantification results (Table S2) and can be attributed primarily to residual POx from the cocatalyst synthesis that adheres to the surface of CNx (Figure S1 and Table S1) as well as to POx surface species on Ni2P (Figure S2 and Table S2).30,35
Diffuse-reflectance UV–vis spectroscopy shows that the CNx|Ni2P composite retains its visible light absorption (λ < 460 nm, Figure 2a). The increased baseline at λ > 460 nm can be attributed to scattering from Ni2P. The fluorescence emission of CNx is quenched upon Ni2P addition, which could suggest reduced charge recombination due to enhanced electron transfer to the cocatalyst (Figure 2b).30,32 This effect stems from the close contact between CNx and Ni2P in the annealed photocatalyst, as Ni2P powder mixed with CNx does not display quenching. Fourier transform infrared (FTIR) spectroscopy confirms that the bulk properties of CNx—characterized by vibrations at 804 cm–1 (heptazine core), 1221 and 1311 cm–1 (secondary amine −C–N bending), and 2177 cm–1 (C=N stretch)—are unaffected by Ni2P (Figure 2c).27 Similarly, powder X-ray diffraction (XRD) patterns show only a minor shift in the CNx lattice spacing from 3.25 to 3.30 Å upon Ni2P addition, which is likely caused by elemental doping of the CNx structure36,37 (Figure S3a). Although the cocatalyst peaks cannot be observed in XRD analysis due to the low loading (2 wt %), measurements of Ni2P alone confirm that hexagonal Ni2P has been successfully synthesized (Figure S3b).
Figure 2.

Characterization of the CNx|Ni2P (2 wt %) photocatalyst. Comparison of the (a) diffuse-reflectance UV–vis, (b) emission (λex = 360 nm, λem = 450 nm), and (c) FTIR spectra of CNx and CNx|Ni2P. (d) TEM image of the CNx|Ni2P catalyst, with inset showing the lattice spacing of Ni2P. XPS spectra of the (e) C1s edge for CNx and CNx|Ni2P and (f) Ni2p edge for Ni2P and CNx|Ni2P.
Transmission electron microscopy (TEM, Figure 2d), scanning electron microscopy (SEM, Figure S4), and energy-dispersive X-ray spectroscopy (EDX, Figure S4) show that Ni2P is uniformly distributed across CNx. As determined from TEM, the Ni2P nanoparticles are 9.4 ± 0.6 nm in diameter (Figure 2d and Figure S5), which is slightly smaller than Ni2P synthesized alone (12.8 ± 1.1 nm, Figure S6). The nanoparticles also exhibit a lattice spacing of 0.22 nm, which corresponds to the (111) plane of hexagonal Ni2P.30
XPS further verifies the binding of Ni2P to CNx (Figure 2e,f, Figure S2, and Table S2). The high-resolution C1s (Figure 2e) and N1s (Figure S2a) spectra of CNx and CNx|Ni2P are nearly identical, confirming that the surface properties of CNx are largely unaffected by cocatalyst addition. Although the Ni2p (Figure 2f) and P2p (Figure S2b) edges of CNx|Ni2P are low in intensity due to the small quantity of cocatalyst (2 wt %), they still reveal similar spectra to those of bulk Ni2P. The Ni 2p3/2 edge of both Ni2P and CNx|Ni2P can be deconvoluted into two peaks: Ni–P and NiOx (from surface oxidation).30 Ni–P in particular shifts to a lower binding energy (from 853.08 to 852.18 eV) on CNx. The same trend is observed in the P2p spectra. These results, combined with the slight shift in the C=N peak to higher binding energies (from 288.18 to 288.28 eV in C1s and from 398.58 to 398.78 eV in N1s), suggest a metal–support interaction in which electron density shifts from CNx to Ni2P.27,38 This interaction should improve electron extraction and thereby enhance PR efficiency.
3. Photocatalysis
Having established the synthesis protocol and characterization of CNx|Ni2P, we subsequently studied its photocatalytic performance. When compared to literature reports for H2NCNx|Ni2P under the same conditions, CNx|Ni2P offers comparable H2 yields with triethanolamine as a sacrificial electron donor (Table S3). We therefore applied CNx|Ni2P to polymer PR. All conditions—including Ni2P loading, photocatalyst concentration, pH, and substrate treatment—were optimized for maximal total H2 production (Figure 3a,b and Table S4).
Figure 3.
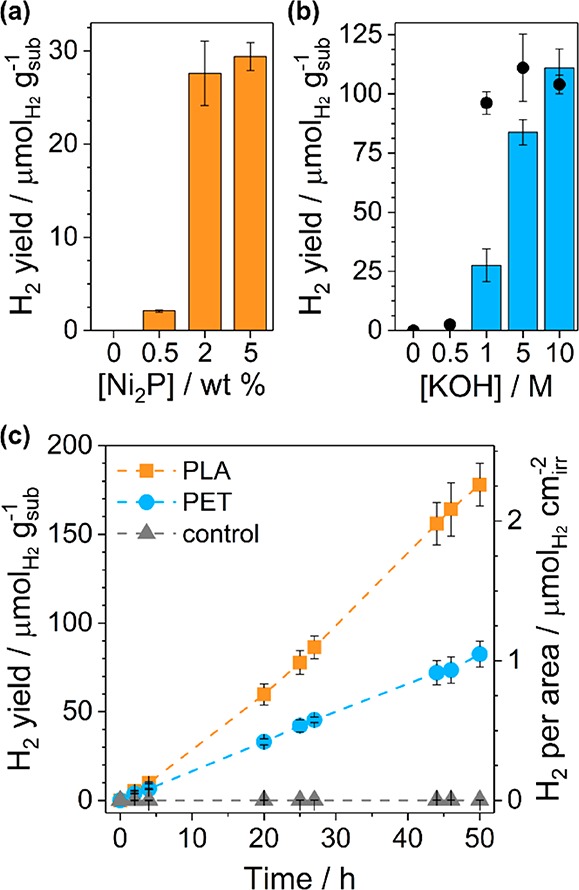
Photoreforming of PET and PLA with CNx|Ni2P. Optimization of (a) Ni2P loading and (b) KOH concentration for photoreforming of PET (after 20 h irradiation). Black circles in (b) mark H2 evolution per gram of substrate over CNx|Pt (2 wt %) under the same conditions. (c) Long-term photoreforming of PET and PLA. Conditions unless stated otherwise in figure: CNx|Ni2P 2 wt % (1.6 mg mL–1), pretreated PET (25 mg mL–1), aqueous KOH (1 M, 2 mL), and simulated solar light (AM 1.5 G, 100 mW cm–2, 25 °C).
In a typical optimized experiment, the substrate was pretreated (24 h at 40 °C with stirring in the dark) in aqueous KOH to initiate polymer breakdown and improve PR performance (Table S5).23 Quantitative 1H nuclear magnetic resonance (NMR) spectroscopy of the polymers shows that 72% of PLA is solubilized to lactate during pretreatment, whereas 62% of the ethylene glycol in PET is released (Table S6 and Figure S7). Terephthalate and lactate can be detected by liquid chromatography–mass spectrometry (LC-MS analysis up to 1000 m/z) of the pretreated solutions of PET and PLA, respectively (Figure S8). Only a few longer chain molecules are observed, suggesting that the polymers hydrolyze primarily to their monomers.
CNx|Ni2P was then ultrasonicated in H2O for 10 min following a reported procedure.29 This ultrasonication process is known to increase the surface area and activity of the photocatalyst (Table S7).29 The photocatalyst and pretreated substrate mixture were added to a photoreactor and exposed to simulated solar light (AM 1.5G, 100 mW cm–2) at 25 °C under a N2 atmosphere. All H2 evolution values are background-corrected by yield without substrates, which accounts for ∼6% of total H2 yield and may be at least partially due to residual P precursor from the cocatalyst synthesis (Table S8). No H2 is detected without the photocatalyst, light absorber, cocatalyst, or light (Table S8). Mass spectrometry of the headspace gas confirms that no CO2 is released (Figure S9a), and CO32– is only produced from certain substrates (PLA) during PR, as determined by 13C NMR spectroscopy (Figure S10). Isotopic labeling experiments with D2O verify that H2 originates from water rather than the substrate (Figure S9b).
A Ni2P loading of 2 wt % was optimal (Figure 3a and Table S4) as too little cocatalyst is available for electron extraction at lower loadings, whereas parasitic light absorption prevents further improvement at higher loadings.30−32 A variety of other noble-metal-free and alkaline-compatible cocatalysts—including Ni, Fe, and Co salts, Ni(OH)2, Ni, Fe, and Cu oxides, and FexP—were also tested with CNx for polymer PR (Table S9). All showed inferior performance, with the second-best cocatalyst (Ni(OH)2) offering a H2 yield half that of Ni2P.
Harsh conditions (e.g., high pH) are often required to solubilize plastic, and polymer PR with CNx|Ni2P improves significantly with increasing pH values, from 27.6 μmolH2 gsub–1 at 1 M KOH to 111 μmolH2 gsub–1 at 10 M KOH (Figure 3b and Table S4). However, this enhanced H2 yield is likely not exclusively due to improved substrate solubility, as CNx|Pt with PET performs equally well at different molarities (black circles in Figure 3b). Instead, previous studies suggest that Ni2P forms a thin Ni(OH)2 layer under alkaline conditions, which is thought to improve H2 evolution activity via enhanced water dissociation.30,39−41 To reduce the cost and corrosiveness of the system, all following experiments were conducted in 1 M KOH.
A variety of common polymers—polyethylene, PET, PLA, polypropylene, polystyrene, polyurethane, and polystyrene-block-polybutadiene (rubber)—were photoreformed under these optimized conditions (Table S10). While all polymers produced small quantities of H2, PET and PLA offered the highest yields and were selected for further study. Both PET and PLA are polar polymers and contain esters, which facilitates hydrolysis in alkaline aqueous media and could account for their superior performance.
After 50 h of irradiation, 82.5 ± 7.3 and 178 ± 12 μmolH2 gsub–1 were produced from PET and PLA, respectively (Figure 3c and Table S11). The values correspond to turnover numbers of 7.8 ± 0.7 and 16.8 ± 1.1 molH2 molNi–1 for the respective polymers as well as external quantum yields at λ = 430 nm of 0.035 ± 0.005% for PET and 0.101 ± 0.018% for PLA (Table S12). H2 conversions—defined as the moles of H2 detected divided by the theoretical H2 yield—of 4.4 ± 0.6% and 1.6 ± 0.2% were achieved after 8 days of PR with PET and PLA, respectively (Table S13). Note that these calculations assume that only the aliphatic portion of PET is oxidized during PR, as is consistent with previous reports.23 The system was still active after 8 days, suggesting that higher H2 conversions could be achieved at longer time scales (for example, H2 conversions of 50% are observed after 18 days of ethylene glycol PR, Figure S11). At higher pH (10 M KOH), H2 conversions increase to 24.5 ± 3.3% for PET and 6.7 ± 0.8% for PLA (Table S13). Values reported for CdS/CdOx under the same conditions were 16.6 ± 1.0% for PET and 38.8 ± 4.0% for PLA.23 CNx|Ni2P also maintains 17% of its efficiency under visible-light-only irradiation (λ > 420 nm, Table S8), showcasing its improved absorption range over both TiO2 (0% retention) and H2NCNx (2–9% retention, Figure S12 and Table S14).
The H2 yield from PET over CNx|Ni2P is 4 times lower than that with CdS/CdOx (Table 1 and Table S15). CNx|Ni2P requires an electron transfer process from the light absorber to cocatalyst, which likely limits its photocatalytic efficiency in comparison to CdS/CdOx. For further comparison, CNx|Pt, H2NCNx|Ni2P, and TiO2|Ni2P were prepared and studied under identical conditions (Table 1 and Table S14). As expected, the benchmark Pt catalyst improves H2 yield by 3 times. After 20 h of PR, H2NCNx|Ni2P offers H2 yields similar to (or in some cases higher than) CNx|Ni2P. This indicates the applicability of Ni2P to a range of carbon nitrides. However, the activity of H2NCNx|Ni2P decreases over time, whereas that of CNx|Ni2P remains constant (Figure S13 and Table S14). Future investigations will determine the reasons behind this variation, but CNx was selected for the current work due to its apparent high long-term stability and superior utilization of visible light. Finally, TiO2|Ni2P has lower yields at 1 M KOH and only absorbs ultraviolet light (no H2 observed at λ > 420 nm, Table S14). PR of lactic acid (the monomer of PLA) is also faster on CNx|Ni2P (1.55 ± 0.19 μmolH2 gsub–1 h–1, Table S16) than a reported H2NCNx|WS2 system in H2O (0.50 μmolH2 gsub–1 h–1).42 CNx|Ni2P is thus characterized by unique benefits including low expense, visible light absorption, and long-term stability, all of which are critical parameters for scalable PR of plastics.
Table 1. Comparison of Photocatalysts for Photoreforming of PET and PLAa.
| yield
(μmolH2 gsub–1) |
|||||||
|---|---|---|---|---|---|---|---|
| substrate | [base] (M) | CNx|Ni2P | CNx|Pt | H2NCNx|Ni2P | TiO2|Ni2P | CdS/CdOx | TiO2|Pt |
| PET | 1 | 33.1 ± 1.7 | 96.2 ± 4.8 | 34.3 ± 3.1 | 13.8 ± 2.4 | 132 ± 6 | n.a. |
| 10 | 111 ± 8 | 104 ± 4 | 141 ± 16 | 119 ± 8 | 460 ± 58 | 1220 ± 110 | |
| PLA | 1 | 59.7 ± 6.0 | 180 ± 17 | 81.2 ± 6.1 | 54.1 ± 9.4 | 56.6 ± 8.9 | n.a. |
| 10 | 211 ± 10 | 314 ± 16 | 427 ± 21 | 220 ± 28 | 2910 ± 140 | 358 ± 53 | |
| ref | this work | this work | this work | this work | (23) | (23) | |
Conditions: 25 mg mL–1 pretreated PET or PLA with all catalysts except CdS/CdOx (which used 50 mg mL–1 PLA); 2 mL of aqueous KOH or NaOH solution; 1.6 mg mL–1 CNx|Ni2P, CNx|Pt, H2NCNx|Ni2P, and TiO2|Ni2P; 1 nmol of CdS/CdOx; 5 mg mL–1 TiO2|Pt; measurements taken after 20 h of simulated solar light (AM 1.5G, 100 mW cm–2, 25 °C).
4. Postcatalysis Characterization
Characterization of the CNx|Ni2P catalyst after PR of PLA by TEM (Figure S14), SEM/EDX (Figure S4), and XPS (Figure S15 and Table S2) confirms that Ni remains on the CNx surface. ICP-OES shows a loading of 15.1 mgNi gCNx–1 and that leaching into the PR solution is minimal (0.9% of the original Ni content). The P content decreases significantly to 8.8 mgP gCNx–1 presumably due to the loss of surface POx species (as observed in XPS, Figure S15). The absorption of the photocatalyst increases in the visible range after use (Figure S14), potentially due to agglomeration (Figure S4), but emission remains constant before and after PR (Figure S14). FTIR spectroscopy shows that the NCN functionality of CNx remains intact (Figure S14), and XPS confirms that the surface properties of CNx are unchanged after catalysis (no shifts in the C1s and N1s edges detected, Figure S15). XPS also shows that the Ni–P and NiOx species in the Ni2p spectrum are replaced by Ni(OH)2 at 855.98 eV (Figure S15), which is consistent with the literature30,39,40 and results mentioned in the previous section. Because of its insolubility, the catalyst can be easily separated from solution by centrifugation and reused while maintaining half of its original photocatalytic activity (Table S17). This loss of activity can likely be attributed to agglomeration during the isolation/drying process or minor chemical changes in the CNx structure, rather than to an intrinsic photocatalytic instability. When CNx|Ni2P is left in solution, it remains active over 18 days of ethylene glycol PR until all substrate is consumed (Figure S11).
5. Substrate Oxidation
Ideally, PR would generate useful products not only during the reduction half-reaction (H2) but also through polymer oxidation. Although CO2 is the expected final oxidation product, gaseous CO2 was not detected and CO32– was only evident after PR of PLA (Figures S9 and S10). We therefore used 1H NMR spectroscopy to analyze the reaction mixtures and identify organic oxidation products. All peak assignments were verified by adding authentic samples (Figure S16), and maleic acid was used as a standard.
The 1H NMR spectra show that both PET and PLA form a variety of oxidation products after 5 days of PR (Figure 4, Figure S10, and Table 2). During pretreatment under alkaline conditions, PET hydrolyzes to its monomers—terephthalate (TPA, b) and ethylene glycol (EG, c, also see Figures S7 and S8)—or soluble oligomer fragments. TPA is not oxidized during PR (no H2 produced, Table S16, and no oxidation products observed, Figure S17), as aromatic moieties are challenging to photoreform.23 Because of its insolubility under most aqueous conditions, TPA could potentially be isolated and reused for PET synthesis. Isophthalate (a), an isomer of TPA, is present in small quantities in the original polymer and is not an oxidation product.
Figure 4.

1H NMR spectra of (a) PET and (b) PLA after photoreforming. Insets show zoomed-out views of the spectra. (c) Chemical structures and peak assignments. Peaks labeled with an asterisk (∗) are seen in a control sample with no substrate. Photoreforming conditions: CNx|Ni2P 2 wt % (1.6 mg mL–1), pretreated polymer (25 mg mL–1), NaOD (1 M) in D2O (2 mL), simulated solar light (5 days, AM 1.5G, 100 mW cm–2, 25 °C).
Table 2. Quantification of the Organic Oxidation Products Formed from PET and PLA after 5 days of Photoreforminga.
| organic compound | quantity (nmol) | |
|---|---|---|
| photoreforming of PET | acetate | 190 |
| formate | 190 | |
| glycolate | n.a. | |
| glyoxal | 9300 | |
| photoreforming of PLA | acetate | 100 |
| formate | 95 |
Maleic acid was used as a reference standard. Glycolate was not quantifiable as its peak overlaps with that of ethylene glycol (n.a. indicates not available).
The EG portion of PET is oxidized by CNx|Ni2P to formate (i), glyoxal (ii), glycolate (iii), acetate (iv), and other intermediates (unlabeled). Glyoxylate and glycoaldehyde cannot be unambiguously detected in the 1H NMR spectrum due to their overlap with the D2O and EG peaks, respectively, but become visible in the 13C NMR spectrum (Figure S10a, labeled as v and vi). Signals marked with an asterisk (∗) are already present in a control spectrum of CNx|Ni2P irradiated without a polymer substrate and can be attributed to residual solvents from the photocatalyst synthesis or other impurities. PR of EG alone offers high H2 evolution activities (46 ± 6 μmolH2 gcat–1 h–1, Table S16) and generates the same array of oxidation products (Figure S17).
With the exception of acetate, all of these oxidation products can be formed according to the proposed mechanism in Figure S18a. In brief, ethylene glycol is expected to oxidize to glycoaldehyde, followed by glyoxal and glycolate, glyoxylate, oxalate, formate, and finally CO32–. PR of the oxidation products followed by 1H NMR analysis at various time intervals (Figure S17, Tables S16 and S18) also supports the proposed series of reactions. However, the use of highly alkaline conditions during PR initiates a variety of other reactions, such as aldol condensation. These processes add further complexity and likely explain the appearance of acetate and other unidentified products corresponding to the unlabeled peaks in the 1H and 13C NMR spectra. None of the more oxidized intermediates—formate, acetate, and CO32–—seem to accumulate over extended PR time scales (Figure S11). This leads to a mass imbalance between the quantity of measurable oxidation products and H2, which can likely be attributed to the additional unidentified chemicals observed in 13C NMR spectroscopy (Figure S10a).
PLA offers a much simpler system. It hydrolyzes to lactate (d, e, also see Figures S7 and S8) during pretreatment, which is then oxidized primarily to CO32– and small quantities of formate (i), acetate (iv), and other unidentified products (Figure 4b, Figures S10b and S18b). All of the above results are similar to those reported for PR of PET with CdS/CdOx23 as well as for the oxidation of EG43−45 and lactate46,47 under a variety of conditions. The acidic products also slightly reduce the pH of the PR system, from 14.0 to 13.2 after 5 days.
Although the accumulation of organic products causes incomplete conversion of the plastic precursors to H2, it also prevents the release of greenhouse gases like CO2 and potentially allows for the extraction of additional chemicals. In the future, this system could be improved by tailoring the selectivity of the oxidation half-reaction toward a single high-value product. For example, acetate had a global market of 13 million tons in 2015 and is widely used as a platform chemical.48 The development of selective oxidation cocatalysts remains a key challenge for polymer PR.
PR is often believed to proceed via hydroxyl (OH•) radicals.19,49 To investigate this possibility, we performed PR with the OH• scavenger TPA. TPA reacts with OH• to form 2-hydroxyterephthalic acid (TPA-OH), which fluoresces at λ = 430 nm when excited at λ = 315 nm. After 20 h of PR, no TPA-OH emission was detected (Figure S19). This, combined with a previous proposal that holes photogenerated on CNx are not oxidizing enough to produce OH•,29,50 suggests that OH• plays a minimal role in PR. Instead, PR likely proceeds via direct hole transfer between CNx and the substrate.
6. Application to Real-World Waste and Microplastics
Finally, we evaluated the real-world efficacy of the CNx|Ni2P system through long-term PR of polyester microfibers and food-contaminated PET (Figure 5a). Polyester microfibers are known to shed from synthetic clothing and enter the environment and drinking water.8,51 Despite their prevalence, their dilution and aquatic state make microplastics challenging to reuse. Another common recycling issue is food contamination, which congests equipment and reduces the quality of recovered plastic.52 PR could therefore be an ideal vehicle for transforming these nonrecyclable plastic items into valuable products.
Figure 5.

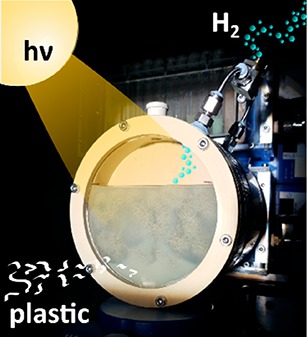
Photoreforming of nonrecyclable plastic waste. (a) Long-term photoreforming of polyester microfibers, a PET bottle, and an oil-coated PET bottle. (b) Upscaled photoreforming of polyester microfibers; sample was purged every 24 h. Conditions: CNx|Ni2P (1.6 mg mL–1), 1 M KOH (2 mL for part a and 120 mL for part b), pretreated microfibers (5 mg mL–1) or PET bottle (25 mg mL–1) without or with soybean oil (5 mg mL–1), simulated solar light (AM 1.5G, 100 mW cm–2). (c) Photograph of the batch reactor in use.
The lowest possible microfiber loading was utilized (5 mg mL–1; no H2 was detected at lower loadings after 20 h, Table S19) to approach real-world conditions. Note that this concentration is still much higher than that seen in European tap water: 3.8 fibers L–1.8 In addition, a commercial PET bottle was ground into pieces ≤0.5 cm2 and coated with soybean oil (25 mg mL–1 bottle, 5 mg mL–1 oil). All other parameters—including catalyst concentration, pH, and pretreatment—were kept consistent with PR of pure polymers.
After 5 days of illumination, yields of 104 ± 10, 22.0 ± 1.3, and 11.4 ± 1.2 μmolH2 gsub–1 were achieved from microfibers, a PET bottle, and oil-contaminated PET, respectively (Figure 5a and Table S20). The PR rate with microfibers increases over time as more surface area is exposed for hydrolysis; SEM shows that the sample develops cracks and pits after PR (Figure S20). Note that the H2 yield of microfibers is higher than that of the PET bottle because of the quantity of substrate utilized; the activities of the microfibers and PET bottle are equivalent (2.67 ± 0.25 and 2.87 ± 0.16 μmolH2 gcat–1 h–1, respectively). Oil limits access to the PET bottle, accounting for its lower performance in comparison to the bottle alone. These samples offer PR rates one-tenth that of pure PET, likely due to additional fillers and lower solubility (only 25% of the ethylene glycol in the microfibers was released after pretreatment in comparison to 62% from pure PET; Figure S7 and Table S6). 1H NMR spectroscopy of the PR solutions after catalysis shows that the polyester microfibers oxidize primarily to glyoxal (2440 nmol after 24 h) and acetate (2100 nmol, Figure S21). The PET bottle, meanwhile, yields a wide range of oxidation products similar to those observed in pure PET (Figure S21). This provides an initial demonstration of the transformation of real-world plastic waste into both H2 and organics.
7. Upscaling of Photoreforming
Compatibility with upscaling is essential for any technology aimed at eliminating global plastic waste. Having demonstrated small-scale PR of nonrecyclable plastic waste, we therefore upscaled our setup from 2 to 120 mL (Figure 5b,c and Table S20). With an irradiation area of 60 cm2 and depth of 2 cm, the reactor was semioptimized for maximal light absorption. All concentrations (catalyst, substrate, and KOH) were kept constant. With this new setup, 53.5 μmolH2 gsub–1 was generated from PR of microfibers over the course of 5 days. In contrast to small-scale PR of microfibers, the upscaled H2 production rate decreases gradually over time. This is likely due to inefficient stirring in the reactor rather than catalyst degradation (as we have shown that CNx|Ni2P is stable under PR conditions). When adjusted for area of irradiation, the upscaled H2 production (0.53 μmolH2 cm–2) is greater than that achieved at small scales (0.26 ± 0.03 μmolH2 cm–2), which is a promising support for the scalability of PR. However, it should be noted that the quantity of H2 generated is equivalent to 17.9 μW (0.00215 Wh), meaning that a 15 m2 reactor would be required to charge a typical smartphone (5 Wh)53 with the modest quantum yield currently offered by CNx|Ni2P.
As these numbers suggest, polymer PR cannot currently compete with either established H2 production technologies (steam reforming of fossil fuels, ∼80–90% conversion)13 or gasification of plastic to H2 (∼65–95% conversion and plastic consumption rates in the order of kg h–1, depending on the specific technology).54 To enhance the real-world applicability of plastic PR, future work must focus on key bottlenecks including catalyst efficacy, conversion rates and selectivity, substrate solubilization, reduction or reuse of KOH, and reactor design.
8. Conclusion
In this work, we have established a noble-metal- and Cd-free photocatalyst for visible-light-driven reforming of plastic waste. CNx|Ni2P functions due to the strong binding of the Ni2P cocatalyst to CNx, which promotes charge separation, catalytic efficiency, and stability. The CNx|Ni2P photoreforming system successfully generates H2 by using PET and PLA as abundant and freely available waste feedstocks. The oxidation half-reaction is suggested to proceed via direct hole transfer from the photocatalyst to the substrate and yields valuable organic chemicals (e.g., acetate and formate) rather than CO2, thereby improving the sustainability and overall process value of the system. CNx|Ni2P can also reform real-world polymer samples, including polyester microfibers and oil-contaminated PET, at both small (2 mL) and larger (120 mL) scales. These results showcase a unique benefit of photoreforming: its applicability to waste materials that cannot otherwise be recycled or reused. Plastic is a valuable resource that contains stored energy and chemical feedstocks, yet much of its potential is lost to landfills and environmental pollution. Polymer photoreforming with CNx|Ni2P takes advantage of this underutilized resource to simultaneously reduce plastic pollution and generate H2 and organics in an inexpensive, sustainable, and sunlight-driven process.
9. Experimental Methods
Reagents
Chloroplatinic acid (8 wt %), ethylene glycol, l-(+)-lactic acid, melamine, polypropylene, polystyrene (pellets, Mw 35000), and polystyrene-block-polybutadiene were purchased from Sigma-Aldrich. Low-density polyethylene (powder, 300 μm), poly(ethylene terepththalate) (powder, 300 μm), poly(lactic acid) (pellets, 3 mm), and polyurethane (foam, 10 × 100 × 100 mm3, density 0.08 g cm–3) were obtained from Goodfellow Cambridge Ltd. Polypropylene, polystyrene, polystyrene-block-polybutadiene, poly(lactic acid), and polyurethane were frozen with liquid N2 and then ground in a coffee grinder to powders prior to use. NaOD (40 wt % in D2O), KOH (semiconductor grade), KSCN, maleic acid, nickel(II) chloride hexahydrate, sodium hypophosphite monohydrate, soybean oil, and terephthalic acid were purchased from Fischer Scientific. D2O (99.96 atom % D) was obtained from Euriso-Top, and TiO2 nanoparticles (P25, 10–30 nm) were purchased from SkySpring Nanomaterials, Inc. A plastic water bottle (still Scottish mountain water) was purchased from Marks and Spencer Simply Food, dried, and ground by using a coffee grinder into pieces ≤0.5 cm2. Polyester microfibers (Homescapes Super Microfibre) were used as received.
Synthesis of Carbon Nitride
Unfunctionalized carbon nitride (H2NCNx) was prepared by heating melamine to 550 °C for 3 h under air according to a modified literature procedure.34 The obtained powder was ground with a pestle and mortar. Cyanamide-functionalized carbon nitride (CNx) was prepared by combining H2NCNx and KSCN (weight ratio 1:2) and heating first to 400 °C for 1 h followed by 500 °C for 30 min (ramp rate 30 °C min–1) under Ar.27 After cooling naturally, the powder was washed with H2O and dried under vacuum at 60 °C.
Synthesis of Ni2P
NiCl2·6H2O and NaH2PO2·H2O (ratio of 1:5) in a minimum amount of water were first stirred for 1 h and then sonicated for 1 h. The mixture was dried under vacuum at 60 °C. The dry solid was then heated for 1 h at 200 °C under Ar (ramp rate 5 °C min–1). After cooling to room temperature, the black powder was washed with water (2×) and ethanol (1×) and dried under vacuum at 60 °C.
Synthesis of Ni2P with Light Absorber
Analogous to a previously reported procedure,30 CNx, H2NCNx, or TiO2 nanoparticles (300 mg) and NiCl2·6H2O (20 mg for 2 wt %) were combined in a minimum of water (1 mL), stirred first for 1 h, and then sonicated for 1 h. NaH2PO2·H2O (100 mg for 2 wt %) was subsequently added to the Ni mixture and again stirred and sonicated for 1 h each. The mixture was dried under vacuum at 60 °C. The dry solid was heated for 1 h at 200 °C under Ar (ramp rate 5 °C min–1). After cooling to room temperature, the powder was washed with water (3×) and ethanol (3×) and dried under vacuum at 60 °C.
Physical Characterization
Emission spectra (λex = 360 nm, λem = 450 nm) were recorded on an Edinburgh Instruments FS5 spectrofluorometer equipped with a Xe lamp and integrating sphere. All samples were prepared at a concentration of 1.6 mg mL–1 in 1 M aqueous KOH in a quartz glass cuvette (1 cm path length). UV–vis spectra were recorded on a Varian Cary 50 UV–vis spectrophotometer using a diffuse reflectance accessory. Fourier transform infrared spectroscopy (FTIR) spectra were collected on a Thermo Scientific Nicolet iS50 FTIR spectrometer (ATR mode). Powder X-ray diffraction (XRD) was conducted on a PANalytical Empyrean Series 2 instrument using Cu Kα irradiation. Scanning electron microscopy (SEM) and energy dispersive X-ray spectroscopy (EDX) were conducted on a TESCAN MIRA3 FEG-SEM. Samples were sputter-coated with a 10 nm layer of either Pt or Cr prior to microscopy. Transmission electron microscopy (TEM) was conducted on a Thermo Scientific (FEI) Talos F200X G2 TEM. All samples were dispersed in ethanol at low concentrations (∼4 μg mL–1) and drop-cast on carbon-coated Cu grids.
Samples for X-ray photoelectron spectroscopy (XPS) were dispersed in ethanol (concentration of 5 mg mL–1) and drop-cast (50 μL, 7×) onto clean FTO glass slides and dried. XPS was performed on a Thermo Fisher Scientific K-alpha+ spectrometer. Samples were analyzed using a microfocused monochromatic Al X-ray source (72 W) over an area of ∼400 μm. Data were recorded at pass energies of 150 eV for survey scans and 40 eV for high-resolution scans with 1 and 0.1 eV step sizes, respectively. Charge neutralization of the sample was achieved through a combination of both low-energy electrons and argon ions. Three well-separated areas were selected on each sample for analysis to examine any surface heterogeneity. Data analysis was performed in CasaXPS using a Shirley type background and Scofield cross sections, with an energy dependence of −0.6.
Inductively coupled plasma optical emission spectrometry (ICP-OES) measurements were completed by the Microanalysis Service at the University of Cambridge (Department of Chemistry) on a Thermo Scientific iCAP 700 spectrometer. For quantification of the bulk Ni and P content of the catalyst before and after PR, the catalyst was digested in 2:1 H2O2:H2SO4 overnight before measurement.
Nuclear Magnetic Resonance (NMR) Spectroscopy
1H NMR and 13C NMR spectra were collected on either a 400 or 500 MHz Bruker spectrometer. All samples, including polymers before and after PR and pure oxidation intermediates and products, were prepared in 1 M NaOD in D2O with sample concentrations of 25 mg mL–1.
Quantitative 1H NMR Spectroscopy
Samples (typically 150 μL) were spiked with a known quantity (typically 20–40 μL) of a standard solution (50 mg mL–1 maleic acid in D2O) after pretreatment or PR, depending on the experiment. The quantity of analyte (manalyte) in the sample was calculated via eq 1:
| 1 |
where Ianalyte is the integral of the analyte peak, Nanalyte the number of protons corresponding to the analyte peak, Manalyte the molar mass of the analyte, and mstandard the known mass of the standard in the sample.
pH Measurements
pH was measured on a Mettler Toledo pH meter and probe. Samples in 1 M KOH were diluted to 0.1 M KOH prior to measuring to avoid damaging the probe, and the pH was back-calculated by using the assumption that a[OH–] ≈ c[KOH].
Substrate Pretreatment
Following a slightly modified reported procedure,23 polymers (50 mg mL–1) were soaked in 2 M aqueous semiconductor-grade KOH in a sealed vial for 24 h at 40 °C with stirring at 300 rpm. The solution—including the undissolved pieces of polymer—was then used for PR as below.
Light Chromatography–Mass Spectrometry (LC-MS)
Ten microliters of pretreated solution was added to 1 mL of methanol and submitted for analysis to the mass spectrometry team at the University of Cambridge (Department of Chemistry) on a ThermoFinnigan Orbitrap setup combined with a Dionex Ultimate 3000 HPLC.
Photocatalytic Generation of H2
A dispersion of the catalyst (CNx|Ni2P, H2NCNx|Ni2P, or TiO2|Ni2P) in H2O (5 mg mL–1) was ultrasonicated as described previously (10 min, pulses of 30 s at 100% amplitude followed by 5 s pauses).29 The resulting mixture (0.65 mL), 1 mL of pretreated polymer in 2 M aqueous semiconductor-grade KOH, and 0.35 mL of H2O were used per sample. Final conditions were 2 mL of 1 M aqueous KOH, 1.6 mg mL–1 catalyst, 25 mg mL–1 polymer, or PET bottle (5 mg mL–1 used for polyester microfibers). CNx|Pt was made by ultrasonicating CNx and then adding H2PtCl6 as a precursor (Pt forms via in situ photodeposition). The prepared samples were added to Pyrex glass photoreactor vials (internal volume 7.91 mL) and capped with rubber septa. After briefly vortexing, the samples were purged with N2 (containing 2% CH4 for gas chromatographic analysis; no CH4 was observed in the samples postillumination without the addition of this internal standard) at ambient pressure for 10 min. The samples were then irradiated by a solar light simulator (Newport Oriel, 100 mW cm–2) equipped with an air mass 1.5 global (AM 1.5G) filter and a water filter to remove infrared radiation. Visible-light-only experiments were conducted by adding a λ > 420 nm cutoff filter. All samples were stirred at 600 rpm and kept at a constant temperature of 25 °C during irradiation. H2 generation was monitored by periodically analyzing samples of the reactor head space gas (50 μL) by gas chromatography (see below). Overpressure within the vial is minimal (an increase of 0.03 atm per 10 μmol of H2 produced).
Gas Analysis
The accumulation of H2 was measured via gas chromatography on an Agilent 7890A gas chromatograph equipped with a thermal conductivity detector and HP-5 molecular sieve column using N2 as the carrier gas. Methane (2% CH4 in N2) was used as an internal standard after calibration with different mixtures of known amounts of H2/N2/CH4. CO2 detection was performed with mass spectrometry on a Hiden Analytical HPR-20 benchtop gas analysis system fitted with a custom-designed 8-way microflow capillary inlet to a HAL 101 RC electron impact quadrupolar mass spectrometer with a Faraday detector.
Upscaled Photocatalytic Generation of H2
CNx|Ni2P (170 mg) in H2O (15 mL) was ultrasonicated as described above and added to a photoreactor. The utilized photoreactor (internal volume 190 mL) is constructed from PEEK and stainless steel and features a quartz window (11 cm diameter). 60 mL of pretreated polyester microfibers (600 mg) in 2 M aqueous KOH and 45 mL of H2O were also added to the photoreactor. The final experimental conditions were the following: 120 mL of 1 M aqueous KOH, 1.42 mg mL–1 CNx|Ni2P, and 5 mg mL–1 microfibers. The reactor was capped with a rubber septum and purged with N2 (containing 2% CH4 for gas chromatographic analysis) for 30 min. The sample was then irradiated at room temperature by a solar light simulator (LOT-Quantum Design, 100 mW cm–2) equipped with an air mass 1.5 global filter (AM 1.5G).
Treatment of Data
All analytical measurements were performed in triplicate, unless otherwise stated, and are given as the unweighted mean ± standard deviation (σ). All measurements are listed as H2 yield per weight of substrate (μmolH2 gsub–1) and activity per weight of catalyst (μmolH2 gcat–1 h–1). σ was calculated via eq 2:
| 2 |
where n is the number of repeated measurements, x the value of a single measurement, and x̅ the unweighted mean of the measurements. σ was increased to 5% of x̅ in the event that the calculated σ was below this threshold.
External Quantum Yield (EQY) Determination
Ultrasonicated CNx|Ni2P 2 wt % (3.2 mg), pretreated polymer (50 mg), and 1 M aqueous KOH (2 mL) were added to a quartz cuvette (path length 1 cm), which was then sealed with a rubber septum. The sample was purged with N2 containing 2% CH4 for 10 min. The sample was next activated via 4 h of illumination in a solar light simulator (Newport Oriel, 100 mW cm–2) equipped with an air mass 1.5 global filter (AM 1.5G) and a water filter to remove infrared radiation. After a second round of N2 purging, the sample was irradiated by a Xe lamp (LOT LSH302) fitted with a monochromator (LOT MSH300) focused at a single wavelength of λ = 430 nm (accurate to a full width at half-maximum of 5 nm). The light intensity was adjusted to ∼1000 μW cm–2, as measured with a power meter (ILT 1400, International Light Technologies). The cuvette was irradiated across an area of 0.28 cm2. The evolved headspace gas was analyzed by gas chromatography and the EQY (%) calculated via eq 3:
| 3 |
where nH2 is the amount of H2 generated (mol), NA Avogadro’s constant (mol–1), h Planck’s constant (J s), c the speed of light (m s–1), tirr the irradiation time (s), λ the wavelength (m), I the light intensity (W m–2), and A the irradiated area (m2).
Stoichiometric H2 Conversion Calculations
Samples with 5 mg substrate in 1 M aqueous KOH (2 mL) were prepared for photocatalysis and irradiated as described above. Conversion (%) was calculated as described in eq 4:
| 4 |
where nH2,exp is the H2 (mol) measured in experiment, nsubstrate,exp the substrate (mol) used in experiment, and nH2,idealnsubstrate,ideal–1 the ideal ratio of moles H2 to substrate, as determined from eqs S2 and S4 in the Supporting Information.
Power Calculations
Equation 5 was used to calculate the power output from the H2 produced.
| 5 |
where VH2 is the molar volume of H2 at 25 °C (24.47 L mol–1), nH2 the moles of H2 produced, ρH2 the density of H2 at 25 °C (8.235 × 10⁻⁵ kg L–1), uH2 the lower heating value of H2 (120 × 106 J kg–1), and tirr the irradiation time (s).
Acknowledgments
This work was supported by the Christian Doppler Research Association, Austrian Federal Ministry for Digital and Economic Affairs, National Foundation for Research, Technology and Development, OMV Group, and EPSRC (NanoDTC, EP/L015978/1 and EP/S022953/1). XPS data collection was performed at the EPSRC National Facility for XPS (HarwellXPS), operated by Cardiff University and UCL, under Contract PR 16195. We thank Dr. Heather Greer for assistance with electron microscopy, Dr. Annika Eisenschmidt for assistance with NMR, and Dr. Demetra Achilleos, Mr. Mark Bajada, Dr. Moritz Kuehnel, Dr. Nikolay Kornienko, Dr. Souvik Roy, Mr. Arjun Vijeta, and Miss Demelza Wright for useful discussions.
Supporting Information Available
The Supporting Information is available free of charge on the ACS Publications website at DOI: 10.1021/jacs.9b06872.
Chemical equations and thermodynamic calculations for the photoreforming reactions; tables containing all photocatalytic experiment data; additional X-ray photoelectron spectroscopy, powder X-ray diffraction, scanning electron microscopy, transmission electron microscopy, mass spectrometry, and nuclear magnetic resonance characterization; proposed oxidation mechanism (PDF)
Data related to this publication are available at the University of Cambridge data repository: https://doi.org/10.17863/CAM.43324.
The authors declare the following competing financial interest(s): A patent application covering carbon-based photocatalysts for photoreforming has been filed by Cambridge Enterprise (GB1808905.2).
Supplementary Material
References
- Ellen MacArthur Foundation . The New Plastics Economy: Rethinking the Future of Plastics & Catalysing Action; 2017.
- MacArthur E. Beyond Plastic Waste. Science 2017, 358, 843. 10.1126/science.aao6749. [DOI] [PubMed] [Google Scholar]
- Geyer R.; Jambeck J. R.; Law K. L. Production, Use, and Fate of All Plastics Ever Made. Sci. Adv. 2017, 3, e1700782 10.1126/sciadv.1700782. [DOI] [PMC free article] [PubMed] [Google Scholar]
- Garcia J. M.; Robertson M. L. The Future of Plastics Recycling. Science 2017, 358, 870–872. 10.1126/science.aaq0324. [DOI] [PubMed] [Google Scholar]
- Andrady A. L.Persistence of Plastic Litter in the Oceans. In Marine Anthropogenic Litter; Springer International Publishing: Cham, 2015; pp 57–72. [Google Scholar]
- Law K. L.; Thompson R. C. Microplastics in the Seas. Science 2014, 345, 144–145. 10.1126/science.1254065. [DOI] [PubMed] [Google Scholar]
- Cózar A.; Echevarría F.; González-Gordillo J. I.; Irigoien X.; Úbeda B.; Hernández-León S.; Palma Á. T.; Navarro S.; García-de-Lomas J.; Ruiz A.; Fernández-de-Puelles M. L.; Duarte C. M. Plastic Debris in the Open Ocean. Proc. Natl. Acad. Sci. U. S. A. 2014, 111, 10239–10244. 10.1073/pnas.1314705111. [DOI] [PMC free article] [PubMed] [Google Scholar]
- Kosuth M.; Mason S. A.; Wattenberg E. V. Anthropogenic Contamination of Tap Water, Beer, and Sea Salt. PLoS One 2018, 13, e0194970 10.1371/journal.pone.0194970. [DOI] [PMC free article] [PubMed] [Google Scholar]
- Pivokonsky M.; Cermakova L.; Novotna K.; Peer P.; Cajthaml T.; Janda V. Occurrence of Microplastics in Raw and Treated Drinking Water. Sci. Total Environ. 2018, 643, 1644–1651. 10.1016/j.scitotenv.2018.08.102. [DOI] [PubMed] [Google Scholar]
- Mason S. A.; Welch V. G.; Neratko J. Synthetic Polymer Contamination in Bottled Water. Front. Chem. 2018, 6, 407. 10.3389/fchem.2018.00407. [DOI] [PMC free article] [PubMed] [Google Scholar]
- U.S. Department of Energy . Report of the Hydrogen Production Expert Panel: A Subcommittee of the Hydrogen & Fuel Cell Technical Advisory Committee; Washington, DC, 2013.
- International Energy Agency . Tracking Clean Energy Progress 2015: Energy Technology Perspectives 2015 Excerpt IEA Input to the Clean Energy Ministerial; Paris, 2015.
- Spath P. L.; Mann M. K. Life Cycle Assessment of Hydrogen Production via Natural Gas Steam Reforming; Golden, 2001.
- Chen W.-T.; Jin K.; Linda Wang N.-H. Use of Supercritical Water for the Liquefaction of Polypropylene into Oil. ACS Sustainable Chem. Eng. 2019, 7, 3749–3758. 10.1021/acssuschemeng.8b03841. [DOI] [Google Scholar]
- Wakerley D. W.; Kuehnel M. F.; Orchard K. L.; Ly K. H.; Rosser T. E.; Reisner E. Solar-Driven Reforming of Lignocellulose to H2 with a CdS/CdOx Photocatalyst. Nat. Energy 2017, 2, 17021. 10.1038/nenergy.2017.21. [DOI] [Google Scholar]
- Horikoshi S.; Serpone N.; Hisamatsu Y.; Hidaka H. Photocatalyzed Degradation of Polymers in Aqueous Semiconductor Suspensions. 3. Photooxidation of a Solid Polymer: TiO2-Blended Poly(Vinyl Chloride) Film. Environ. Sci. Technol. 1998, 32, 4010–4016. 10.1021/es9710464. [DOI] [Google Scholar]
- Ohtani B.; Adzuma S.; Nishimoto S.; Kagiya T. Photocatalytic Degradation of Polyethylene Film by Incorporated Extra-Fine Particles of Titanium Dioxide. Polym. Degrad. Stab. 1992, 35, 53–60. 10.1016/0141-3910(92)90135-R. [DOI] [Google Scholar]
- Tofa T. S.; Kunjali K. L.; Paul S.; Dutta J. Visible Light Photocatalytic Degradation of Microplastic Residues with Zinc Oxide Nanorods. Environ. Chem. Lett. 2019, 17, 1341–1346. 10.1007/s10311-019-00859-z. [DOI] [Google Scholar]
- Kuehnel M. F.; Reisner E. Solar Hydrogen Generation from Lignocellulose. Angew. Chem., Int. Ed. 2018, 57, 3290–3296. 10.1002/anie.201710133. [DOI] [PMC free article] [PubMed] [Google Scholar]
- Puga A. V. Photocatalytic Production of Hydrogen from Biomass-Derived Feedstocks. Coord. Chem. Rev. 2016, 315, 1–66. 10.1016/j.ccr.2015.12.009. [DOI] [Google Scholar]
- Pellegrin Y.; Odobel F. Sacrificial Electron Donor Reagents for Solar Fuel Production. C. R. Chim. 2017, 20, 283–295. 10.1016/j.crci.2015.11.026. [DOI] [Google Scholar]
- Kawai T.; Sakata T. Photocatalytic Hydrogen Production from Water by the Decomposition of Poly-Vinylchloride, Protein, Algae, Dead Insects, and Excrement. Chem. Lett. 1981, 10, 81–84. 10.1246/cl.1981.81. [DOI] [Google Scholar]
- Uekert T.; Kuehnel M. F.; Wakerley D. W.; Reisner E. Plastic Waste as a Feedstock for Solar-Driven H2 Generation. Energy Environ. Sci. 2018, 11, 2853–2857. 10.1039/C8EE01408F. [DOI] [Google Scholar]
- Lin L.; Yu Z.; Wang X. Crystalline Carbon Nitride Semiconductors for Photocatalytic Water Splitting. Angew. Chem., Int. Ed. 2019, 58, 6164–6175. 10.1002/anie.201809897. [DOI] [PubMed] [Google Scholar]
- Wang X.; Maeda K.; Thomas A.; Takanabe K.; Xin G.; Carlsson J. M.; Domen K.; Antonietti M. A Metal-Free Polymeric Photocatalyst for Hydrogen Production from Water under Visible Light. Nat. Mater. 2009, 8, 76–80. 10.1038/nmat2317. [DOI] [PubMed] [Google Scholar]
- Thomas A.; Fischer A.; Goettmann F.; Antonietti M.; Müller J.-O.; Schlögl R.; Carlsson J. M. Graphitic Carbon Nitride Materials: Variation of Structure and Morphology and Their Use as Metal-Free Catalysts. J. Mater. Chem. 2008, 18, 4893–4908. 10.1039/b800274f. [DOI] [Google Scholar]
- Lau V. W.; Moudrakovski I.; Botari T.; Weinberger S.; Mesch M. B.; Duppel V.; Senker J.; Blum V.; Lotsch B. V. Rational Design of Carbon Nitride Photocatalysts by Identification of Cyanamide Defects as Catalytically Relevant Sites. Nat. Commun. 2016, 7, 12165. 10.1038/ncomms12165. [DOI] [PMC free article] [PubMed] [Google Scholar]
- Meyer A. U.; Lau V. W.; König B.; Lotsch B. V. Photocatalytic Oxidation of Sulfinates to Vinyl Sulfones with Cyanamide-Functionalised Carbon Nitride. Eur. J. Org. Chem. 2017, 2017, 2179–2185. 10.1002/ejoc.201601637. [DOI] [Google Scholar]
- Kasap H.; Achilleos D. S.; Huang A.; Reisner E. Photoreforming of Lignocellulose into H2 Using Nanoengineered Carbon Nitride under Benign Conditions. J. Am. Chem. Soc. 2018, 140, 11604–11607. 10.1021/jacs.8b07853. [DOI] [PubMed] [Google Scholar]
- Indra A.; Acharjya A.; Menezes P. W.; Merschjann C.; Hollmann D.; Schwarze M.; Aktas M.; Friedrich A.; Lochbrunner S.; Thomas A.; Driess M. Boosting Visible-Light-Driven Photocatalytic Hydrogen Evolution with an Integrated Nickel Phosphide-Carbon Nitride System. Angew. Chem., Int. Ed. 2017, 56, 1653–1657. 10.1002/anie.201611605. [DOI] [PubMed] [Google Scholar]
- Ye P.; Liu X.; Iocozzia J.; Yuan Y.; Gu L.; Xu G.; Lin Z. A Highly Stable Non-Noble Metal Ni2P Co-Catalyst for Increased H2 Generation by g-C3N4 under Visible Light Irradiation. J. Mater. Chem. A 2017, 5, 8493–8498. 10.1039/C7TA01031A. [DOI] [Google Scholar]
- Wen J.; Xie J.; Shen R.; Li X.; Luo X.; Zhang H.; Zhang A.; Bi G. Markedly Enhanced Visible-Light Photocatalytic H2 Generation over g-C3N4 Nanosheets Decorated by Robust Nickel Phosphide (Ni12P5) Cocatalysts. Dalt. Trans. 2017, 46, 1794–1802. 10.1039/C6DT04575H. [DOI] [PubMed] [Google Scholar]
- Cao S.; Wang C.-J.; Fu W.-F.; Chen Y. Metal Phosphides as Co-Catalysts for Photocatalytic and Photoelectrocatalytic Water Splitting. ChemSusChem 2017, 10, 4306–4323. 10.1002/cssc.201701450. [DOI] [PubMed] [Google Scholar]
- Liu J.; Liu Y.; Liu N.; Han Y.; Zhang X.; Huang H.; Lifshitz Y.; Lee S.-T.; Zhong J.; Kang Z. Metal-Free Efficient Photocatalyst for Stable Visible Water Splitting via a Two-Electron Pathway. Science 2015, 347, 970–974. 10.1126/science.aaa3145. [DOI] [PubMed] [Google Scholar]
- Zeng D.; Xu W.; Ong W.-J.; Xu J.; Ren H.; Chen Y.; Zheng H.; Peng D.-L. Toward Noble-Metal-Free Visible-Light-Driven Photocatalytic Hydrogen Evolution: Monodisperse Sub-15 nm Ni2P Nanoparticles Anchored on Porous g-C3N4 Nanosheets to Engineer 0D-2D Heterojunction Interfaces. Appl. Catal., B 2018, 221, 47–55. 10.1016/j.apcatb.2017.08.041. [DOI] [Google Scholar]
- Fang X.-X.; Ma L.-B.; Liang K.; Zhao S.-J.; Jiang Y.-F.; Ling C.; Zhao T.; Cheang T.-Y.; Xu A.-W. The Doping of Phosphorus Atoms into Graphitic Carbon Nitride for Highly Enhanced Photocatalytic Hydrogen Evolution. J. Mater. Chem. A 2019, 7, 11506–11512. 10.1039/C9TA01646E. [DOI] [Google Scholar]
- Hu S.; Li F.; Fan Z.; Wang F.; Zhao Y.; Lv Z. Band Gap-Tunable Potassium Doped Graphitic Carbon Nitride with Enhanced Mineralization Ability. Dalton Trans. 2015, 44, 1084–1092. 10.1039/C4DT02658F. [DOI] [PubMed] [Google Scholar]
- Lu Z.; Li C.; Han J.; Wang L.; Wang S.; Ni L.; Wang Y. Construction 0D/2D Heterojunction by Highly Dispersed Ni2P QDs Loaded on the Ultrathin g-C3N4 Surface towards Superhigh Photocatalytic and Photoelectric Performance. Appl. Catal., B 2018, 237, 919–926. 10.1016/j.apcatb.2018.06.062. [DOI] [Google Scholar]
- Zhou Z.; Wei L.; Wang Y.; Karahan H. E.; Chen Z.; Lei Y.; Chen X.; Zhai S.; Liao X.; Chen Y. Hydrogen Evolution Reaction Activity of Nickel Phosphide Is Highly Sensitive to Electrolyte pH. J. Mater. Chem. A 2017, 5, 20390–20397. 10.1039/C7TA06000A. [DOI] [Google Scholar]
- Danilovic N.; Subbaraman R.; Strmcnik D.; Chang K.-C.; Paulikas A. P.; Stamenkovic V. R.; Markovic N. M. Enhancing the Alkaline Hydrogen Evolution Reaction Activity through the Bifunctionality of Ni(OH)2/Metal Catalysts. Angew. Chem., Int. Ed. 2012, 51, 12495–12498. 10.1002/anie.201204842. [DOI] [PubMed] [Google Scholar]
- You B.; Zhang Y.; Jiao Y.; Davey K.; Qiao S. Z. Negative Charging of Transition-Metal Phosphides via Strong Electronic Coupling for Destabilization of Alkaline Water. Angew. Chem., Int. Ed. 2019, 58, 11796–11800. 10.1002/anie.201906683. [DOI] [PubMed] [Google Scholar]
- Hou Y.; Zhu Y.; Xu Y.; Wang X. Photocatalytic Hydrogen Production over Carbon Nitride Loaded with WS2 as Cocatalyst under Visible Light. Appl. Catal., B 2014, 156–157, 122–127. 10.1016/j.apcatb.2014.03.002. [DOI] [Google Scholar]
- Yue H.; Zhao Y.; Ma X.; Gong J. Ethylene Glycol: Properties, Synthesis, and Applications. Chem. Soc. Rev. 2012, 41, 4218–4244. 10.1039/c2cs15359a. [DOI] [PubMed] [Google Scholar]
- Chauhan N. L.; Dameera V.; Chowdhury A.; Juvekar V. A.; Sarkar A. Electrochemical Oxidation of Ethylene Glycol in a Channel Flow Reactor. Catal. Today 2018, 309, 126–132. 10.1016/j.cattod.2017.08.053. [DOI] [Google Scholar]
- Rossiter W. J.; Brown P. W.; Godette M. The Determination of Acidic Degradation Products in Aqueous Ethylene Glycol and Propylene Glycol Solutions Using Ion Chromatography. Sol. Energy Mater. 1983, 9, 267–279. 10.1016/0165-1633(83)90049-7. [DOI] [Google Scholar]
- Harada H.; Sakata T.; Ueda T. Effect of Semiconductor on Photocatalytic Decomposition of Lactic Acid. J. Am. Chem. Soc. 1985, 107, 1773–1774. 10.1021/ja00292a060. [DOI] [Google Scholar]
- Lomate S.; Katryniok B.; Dumeignil F.; Paul S. High Yield Lactic Acid Selective Oxidation into Acetic Acid over a Mo-V-Nb Mixed Oxide Catalyst. Sustainable Chem. Processes 2015, 3, 5. 10.1186/s40508-015-0032-7. [DOI] [Google Scholar]
- Vidra A.; Németh Á. Bio-Produced Acetic Acid: A Review. Period. Polytech., Chem. Eng. 2018, 62, 245–256. 10.3311/PPch.11004. [DOI] [Google Scholar]
- Speltini A.; Sturini M.; Dondi D.; Annovazzi E.; Maraschi F.; Caratto V.; Profumo A.; Buttafava A. Sunlight-Promoted Photocatalytic Hydrogen Gas Evolution from Water-Suspended Cellulose: A Systematic Study. Photochem. Photobiol. Sci. 2014, 13, 1410–1419. 10.1039/C4PP00128A. [DOI] [PubMed] [Google Scholar]
- Kasap H.; Caputo C. A.; Martindale B. C. M.; Godin R.; Lau V. W.; Lotsch B. V.; Durrant J. R.; Reisner E. Solar-Driven Reduction of Aqueous Protons Coupled to Selective Alcohol Oxidation with a Carbon Nitride–Molecular Ni Catalyst System. J. Am. Chem. Soc. 2016, 138, 9183–9192. 10.1021/jacs.6b04325. [DOI] [PMC free article] [PubMed] [Google Scholar]
- Hartline N. L.; Bruce N. J.; Karba S. N.; Ruff E. O.; Sonar S. U.; Holden P. A. Microfiber Masses Recovered from Conventional Machine Washing of New or Aged Garments. Environ. Sci. Technol. 2016, 50, 11532–11538. 10.1021/acs.est.6b03045. [DOI] [PubMed] [Google Scholar]
- Waste & Resources Action Programme . UK Plastics Waste-A Review of Supplies for Recycling, Global Market Demand, Future Trends and Associated Risks, 2006.
- Helman C.How Much Electricity Do Your Gadgets Really Use? https://www.forbes.com/sites/christopherhelman/2013/09/07/how-much-energy-does-your-iphone-and-other-devices-use-and-what-to-do-about-it/#79d350b42f70 (accessed June 22, 2019).
- Lopez G.; Artetxe M.; Amutio M.; Alvarez J.; Bilbao J.; Olazar M. Recent Advances in the Gasification of Waste Plastics. A Critical Overview. Renewable Sustainable Energy Rev. 2018, 82, 576–596. 10.1016/j.rser.2017.09.032. [DOI] [Google Scholar]
Associated Data
This section collects any data citations, data availability statements, or supplementary materials included in this article.