

Abstract
Absorption of glucose, via intestinal Na+/glucose cotransporter 1 (SGLT1), activates salt and water absorption and is an effective route for treating Escherichia coli (E. coli)-induced diarrhea. Activity and expression of SGLT1 is regulated by sensing of sugars and artificial/natural sweeteners by the intestinal sweet receptor T1R2-T1R3 expressed in enteroendocrine cells. Diarrhea, caused by the bacterial pathogen E. coli, is the most common post-weaning clinical feature in rabbits, leading to mortality. We demonstrate here that, in rabbits with experimentally E. coli-induced diarrhea, inclusion of a supplement containing stevia leaf extract (SL) in the feed decreases cumulative morbidity, improving clinical signs of disease (p < 0.01). We show that the rabbit intestine expresses T1R2-T1R3. Furthermore, intake of SL enhances activity and expression of SGLT1 and the intestinal capacity to absorb glucose (1.8-fold increase, p < 0.05). Thus, a natural plant extract sweetener can act as an effective feed additive for lessening the negative impact of enteric diseases in animals.
Keywords: colibacillosis, oral rehydration, rabbit, SGLT1, intestinal T1R2-T1R3
Introduction
Na+/glucose cotransporter 1, SGLT1, is the major route for absorption of glucose across the intestinal brush border membrane. Absorption of glucose via SGLT1 activates electrolyte and water absorption. In humans, this strategy has been used in oral rehydration therapy, which is the safest and most effective remedy for treating life-threatening diarrhea induced by agents such as Vibrio cholerae and Escherichia coli.1,2 The condition is caused by toxic peptides produced by bacteria stimulating the conversion of guanosine 5′-triphosphate (GTP) to cyclic guanosine 5′-monophosphate (cGMP) by the enzyme guanylate cyclase. Increased intracellular cGMP inhibits intestinal fluid uptake, resulting in net fluid secretion and thus diarrhea.
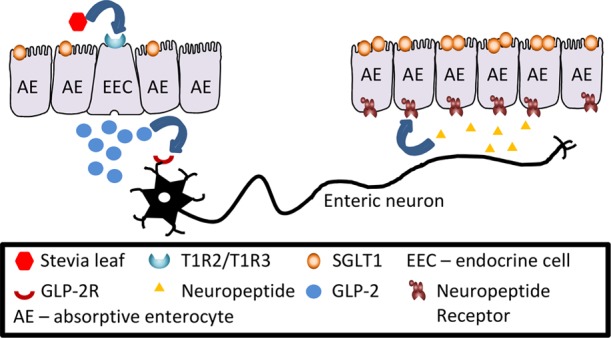
The gut epithelium can sense sugars and artificial sweeteners via the sweet receptor comprising Taste family 1 Receptor 2 (T1R2) and 3 (T1R3) expressed on the luminal membrane of enteroendocrine cells (EEC).3,4 This results in secretion of gut hormones, glucagon-like peptide 1 (GLP-1), glucagon-like peptide 2 (GLP-2), and glucose-dependent insulinotropic peptide (GIP) from EEC.5,6 GLP-2 upregulates SGLT1 activity and expression7,8 in neighboring absorptive enterocytes via a neuro-paracrine pathway.6,9 GLP-2 also increases the villus height and intestinal barrier function,10,11 thereby promoting gut health. These effects have also been reported in piglets12 and calves and ruminants.13
The sweet taste receptor is similarly activated by natural, high-intensity sweeteners, such as stevia,14 leading to increased expression and activity of SGLT1, providing the capacity for enhanced glucose (electrolyte and water) absorption.
Rabbits are raised for a variety of commercial reasons. Their meat, wool, and fur are valuable commodities, as is their nitrogen-rich manure and high protein milk. They are also very popular as household pets. Diarrhea is the most common post-weaning clinical feature in rabbits, leading to significant rates of mortality. With current trends aimed at decreasing the use of antibiotics, feed additives that can improve rabbit health and performance in the face of disease is highly desirable. This is especially relevant in Europe, where antibiotic use in animal feed is already banned, and the use of natural alternatives, for disease prevention, is encouraged. Furthermore, in Europe, the use of artificial sweeteners, used routinely in farm animal nutrition,12,13 is prohibited as supplements in rabbit feed. It is not known if a natural high-intensity sweetener such as stevia leaf extract (SL), which can be used in rabbit feed, will elicit similar effects as seen with artificial sweeteners in farm animals, assisting to prevent and ameliorate enteric diseases in rabbits.
Here, we show that when rabbits are challenged with colibacillosis, inclusion of a supplement containing SL in rabbit feed leads to a significant reduction in diarrhea and bloat, improving the health status. Furthermore, we demonstrate that the rabbit intestine expresses the intestinal sweet receptor T1R2-T1R3 and that inclusion of SL in the feed results in upregulation of SGLT1 activity and protein and mRNA abundance in the small intestine. Thus, a better understanding of the molecular mechanism underlying intestinal nutrient absorption provides a rational strategy for using a natural feed additive for alleviating enteric disorders and promoting the health and well-being of animals.
Materials and Methods
Chemicals
SL supplement (containing 17.75% stevia leaf extract and 2% capsicum oleoresin (for concentration see below); Sucram TakTik) was from Pancosma, Rolle, Switzerland. Zymo Total RNA isolation kit with on-column DNase 1 digestion was from Cambridge Bioscience, Cambridge, UK. dT20 primers and superscript III reverse transcriptase was from Life Technologies, Paisley, UK, and QIAquick PCR purification kit was from Qiagen, Crawley, West Sussex, UK. Consensus primers for mammalian T1R2 and T1R3 were purchased from Eurogentec, Seraing, Belgium. Q5 Hot Start High-Fidelity DNA Polymerase was purchased from New England Biolabs, Hitchin, Herts, UK, and pGEM-T Easy vector was from Promega, Southampton, UK. SYBR green JumpStart Taq ReadyMix, dithiothreitol, benzamidine, phenylmethylsulfonyl fluoride, Bio-Max Light Chemiluminescence Film, β-actin antibody (clone AC-15), D.P.X. neutral mounting medium, donkey serum, 10% neutral buffered formalin, and Mayer’s Hemalum (3.3 mM Mayer’s Hemalum-hematoxylin, 1 mM sodium iodate, and 0.42 mM potassium alum) were purchased from Sigma-Aldrich, Poole, Dorset, UK. Bio-Rad protein assay solution and polyvinylidene difluoride (PVDF) membrane were from Bio-Rad Laboratories Ltd., Hemel Hempstead, UK. The antibody to SGLT1 was raised in rabbits (custom synthesis) to a recombinant peptide corresponding to amino acids 554–640 of rabbit SGLT1 protein. Horseradish peroxidase-linked secondary antibodies were purchased from DAKO Ltd., Cambridge, UK. Immobilon Western Chemiluminescent HRP Substrate and cellulose acetate/nitrate filter were purchased from Millipore, Hertfordshire, UK, and [U-14C]-d-glucose (10.6 GBq/mmol) was from Perkin Elmer, Seer Green, Bucks, UK. Scintillation fluid (Optiphase HiSafe 3) was purchased from Fisher Scientific, UK, and Eosin Y solution (1% (w/v) eosin aqueous) was from HD Supplies, Buckingham, Bucks, UK. Chromogranin A antibody (ab8204) was from Abcam, Cambridge, UK. Antibodies to T1R2 (sc-50306) and T1R3 (sc-22458) were from Santa Cruz Biotechnology, Inc., Heidelberg, Germany, and IgG Cy3- FITC-conjugated secondary antibodies were from Stratech Scientific, Newmarket, UK. 4′,6-Diaminido-2-phenylindole (DAPI) was purchased from Vector Laboratories, Peterborough, UK.
Phase 1
Animals, Treatments, and Experimental Conditions
The animal experiment was conducted at the Talhouet Research Center (Saint Nolff, France). All animal procedures were approved by the Ethical Committee for Animal Experimentation of NEOVIA and by the Ministry of Higher Education of Research and Innovation, France (experimental reference #03835.03). Animal numbers were determined based on power calculations conducted using data from previous experiments performed in the same facility wherein colibacillosis challenge was used. Thirty-six day-old Souche Hyplus PS59 rabbits (http://www.hypharm.fr; n = 300) were weaned, blocked by sex, litter origin, and body weight and assigned to one of four dietary treatments (n = 75/trt): unsupplemented diet or a diet supplemented with 50, 75, or 100 ppm SL containing maximum of 3.3, 4.9, and 6.5 μM capsaicin. Animals were housed in cages (five rabbits per cage) with ad libitum access to feed and water. Rabbit feed was formulated for a typical fattening ration containing 15.5% crude protein and a metabolizable energy (ME) of 22.9 kcal/100 g feed. All feed was free of antibiotics and medications, including coccidiostats. The room was maintained at 19 °C and illuminated between 0700 and 1700 each day. All animals were monitored daily.
On day 44 of age (day 0 of infection), all rabbits were orally inoculated with 5 × 10⁶ CFU/mL E. coli O103 LY265 inoculum (INRA, Nouzilly, France; dose determined in preliminary experiments and validated in several separate experiments).
Measurements
Feed intake was measured daily per cage by weighing of refusals. Live weights of individual rabbits were measured on days −2, 5, 12, 19, and 26 post infection (corresponding to 42, 49, 56, 63, and 70 days of age), and average daily gain (ADG) was calculated from individual body weights. Feed efficiency (G:F; gain/feed) was calculated per cage. Morbidities [visual signs of diarrhea and discoloration of feces, bloat (swollen stomach), sunken eyes, dull fur, and low energy and mobility] were assessed daily by two technicians trained by a veterinarian. Morbidities were not quantified but were simply noted as present or absent based on subjective visual observation by both technicians. The same technicians performed the scoring throughout the study to avoid variation due to the observer. Mortalities were also recorded daily; dead animals were removed from cages upon detection, and visible clinical signs were noted. At the peak of mortality during clinical disease, a random selection of rabbits (n = 10) was necropsied to verify colibacillosis as the cause of death (via E. coli serotyping of intestinal content).
The experiment ended on day 26 post infection (when animals were 70 days of age), and all remaining animals were euthanized by a trained technician. The average body weight at 70 days of age was multiplied by the number of animals alive to estimate production weight per treatment.
Statistical Analysis
Data were analyzed by ANOVA using the SAS Mixed Procedure with a Dunnett’s adjustment for multiple comparisons and orthogonal contrasts to test for linearity. Treatment and time were fixed effects, whereas sex and cage were treated as random effects. Statistical significance was set at p < 0.05.
Phase 2
The experiments in phase 2 were undertaken to understand the molecular mechanisms underlying the intestinal response of rabbits to SL.
Animals, Dietary Trial, and Gut Tissue Sampling
The animal experiment was conducted at the Talhouet Research Center (Saint Nolff, France). All animal procedures were approved by the Ethical Committee for Animal Experimentation of NEOVIA and the Ministry of Higher Education of Research and Innovation, France (experimental reference #03835.03). Animal numbers were determined using gut responses and variation associated with supplementation with artificial sweeteners reported in published articles.6,12,13 Forty-two 60 day-old Souche Hyplus PS59 rabbits (http://www.hypharm.fr) were blocked by sex and body weight and assigned to one of two dietary treatments starting on day 61 of age (n = 21 rabbits/treatment): unsupplemented diet or a diet supplemented with 75 ppm SL (dose chosen based on responses observed in phase 1). Animals were housed in cages (five rabbits per cage) with ad libitum access to feed and water. Rabbit feed was formulated for a typical fattening ration containing 15.5% crude protein and an ME of 22.9 kcal/100 g feed. All feed was free of antibiotics and medications, including coccidiostats. The room was maintained at 19 °C and illuminated between 0700 and 1700 each day. After the 9 day treatment period (the period of 9 days was selected to cover the gut epithelial cell turnover that takes 4–5 days in the majority of species and was extended to 9 days due to travel delays for the researcher from the UK traveling to France for harvesting intestinal tissues) at 70 days of age (same slaughter age as phase 1), all rabbits were weighed and euthanized by intracardiac injection of Euthasol after sedation starting at 9 am. Intestinal tissues were removed: duodenal, 10 cm distal to the pyloric ceca; ileal, 10 cm proximal from the ileocecal valve; and jejunal, at the midpoint between the pyloric ceca and ileocecal valve. Tissue samples were collected from 10 rabbits/treatment (blocked by sex and body weight at slaughter), rinsed in ice-cold saline, and either placed into cryovials or wrapped in aluminum foil and frozen immediately in liquid nitrogen or pinned to dental plastic and fixed in 10% neutral buffered formalin at 4 °C. Fixed tissues were transferred to 20% sucrose in phosphate-buffered saline (PBS) after 24 h and stored at 4 °C. Frozen tissues were stored at −80 °C before shipping to the UK on dry ice, whilst fixed samples were shipped to the UK on wet ice for subsequent analysis.
Cloning of Rabbit T1R2 and T1R3
Total RNA was isolated from rabbit intestinal tissues using the Zymo Total RNA isolation kit with on-column DNase 1 digestion. RNA was quantified by UV spectrophotometry (assuming an OD260 value of 1 = 40 μg/mL) and integrity determined by agarose gel electrophoresis. Complementary DNA (cDNA) was prepared using oligo dT20 primers and superscript III reverse transcriptase, purified using the QIAquick PCR purification kit, and quantified by UV spectrophotometry (assuming an OD260 value of 1 = 33 μg/mL). Consensus primers for mammalian T1R2 and T1R3 are listed in Table 1. Each PCR reaction mix contained 0.5 μM of each forward and reverse primer, 0.5 U of Q5 Hot Start High-Fidelity DNA Polymerase, and 25 ng of template cDNA in a final volume of 25 μL. Polymerase chain reaction (PCR) cycling was carried out as follows: initial denaturation at 98 °C for 1 min, 25 cycles of denaturation at 98 °C for 10 s, annealing for 10 s, and extension at 72 °C for 30 s followed by a final extension step at 72 °C for 2 min. PCR amplicons were gel purified using 1% agarose gels, cloned into the pGEM-T Easy vector, and custom sequenced (Eurofins-MWG, Ebersberg, Germany). Sequence alignments and amino acid translations were performed using commercial software (Vector NTI, Life Technologies).
Table 1. Primers Used for PCR and qPCR.
| primer name | accession no. | sequence | Tm (°C) |
|---|---|---|---|
| RbACTB S | NM_001101683 | 5′-CCTTCTACAACGAGCTGCGAG-3′ | 51.4 |
| RbACTB AS | NM_001101683 | 5′-GCCCTCGTAGATGGGTACTG-3′ | 49.9 |
| RbPOLR2A S | XM_017348893.1 | 5′-ACGCTGCTCTTCAACATCCA-3′ | 60 |
| RbPOLR2A AS | XM_017348893.1 | 5′-CCAGCGTAGTGGAAGGTGTT-3′ | 60 |
| RbB2M S | XM_008269078.2 | CTAGTCTTGTTCCCCTGCCT | 58.9 |
| RbB2M AS | XM_008269078.2 | ATCAATCTGGGGCGGATGAAA | 60 |
| RbT1R2 S | XM_017346518 | 5′-TCTGGAACGTCAGCTTCACC-3′ | 52.5 |
| RbT1R2 AS | XM_017346518 | 5′-GTGCTTCAGCATGGGGTAGT-3′ | 51.6 |
| RbT1R3 S | 5′-GCAAGTTCTTCAGCTTCTTCCT-3′ | 51.5 | |
| RbT1R3 AS | 5′-TACATGTTCTCCAGGAGCTGC-3′ | 51.9 | |
| RbSGLT1 S | NM_001101692 | 5′-TGTCAAGGCTGGCTGTATCC-3′ | 51.4 |
| RbSGLT1 AS | NM_001101692 | 5′-CTCCTCTGGTTCCACGCAA-3′ | 51.3 |
The radial phylogram shown in Figure 7, depicting the phylogenetic relationship of rabbit T1R3 to various mammalian homologs, was constructed by neighbor-joining analysis15 of distance matrices generated using the PROTDIST program (Jones–Taylor–Thornton similarity model)16 as part of the phylogenetic inference package, PHYLIP.17
Figure 7.

Radial phylogram, derived from amino acid sequences, depicting the phylogenetic relationship of rabbit T1R3 to various mammalian homologs. The scale bar represents the number of substitutions per amino acid position.
Quantitative PCR
Relative mRNA expression in the intestine was determined by quantitative real-time PCR (qPCR). cDNA was prepared from total RNA as described above and diluted to 5 ng/μL. Primers to rabbit SGLT1, β-actin (ACTB), RNA polymerase II (POLR2A), and β-2-microglobulin (B2M) were designed using Primer-BLAST18 and purchased from Eurogentec (see Table 1). Each qPCR reaction consisted of 25 ng of cDNA template, 1X SYBR green JumpStart Taq ReadyMix, and 900 nM of each primer in a total volume of 25 μL. The PCR cycling consisted of initial denaturation at 95 °C for 2 min followed by 45 cycles of 95 °C for 15 s and 60 °C for 1 min. Assays were performed in triplicate using a RotorGene 3000 (Qiagen) with relative abundance calculated using RG-3000 comparative quantification software (Qiagen). Abundance of SGLT1 mRNA was normalized to the genomic mean of ACTB, POLR2A, and B2M housekeeping genes, the expression of which did not change throughout the study. qPCR assays without the RT step were routinely employed as negative controls and showed no amplification. Melt curve analysis showed no primer dimer formation in the assays. PCR amplicons were cloned into pGEM-T easy vectors and sequenced to confirm veracity.
Preparation of Brush Border Membrane Vesicles
Brush border membrane vesicles (BBMV) were isolated from different regions of rabbit small intestinal tissues based on the procedure described by Shirazi-Beechey et al.,19 with modifications outlined by Rowell-Schäfer et al.20 and Dyer et al.21 All steps were carried out at 4 °C. Tissues were thawed in a buffer solution (100 mM mannitol, 2 mM HEPES/Tris pH 7.1 with protease inhibitors, 0.5 mM dithiothreitol, 0.2 mM benzamidine, and 0.2 mM phenylmethylsulfonyl fluoride), cut into small pieces, and vibrated for 1.5 min at speed 5 using a FUNDAMIX vibro-mixer (DrM, Dr. Mueller AG, Maennedorf, Switzerland) in order to free intestinal epithelial cells. The filtrate was then homogenized using a Polytron (Ystral, Reading, Berkshire, UK) for 20 s. Next, MgCl2 was added to a final concentration of 10 mM and the solution stirred on ice for 20 min. The suspension was then centrifuged for 10 min at 3000g (SS34 rotor, Sorvall, UK), and the resulting supernatant was spun for 30 min at 30,000g. The pellet was suspended in buffer (100 mM mannitol, 0.1 mM MgSO4, and 20 mM HEPES/Tris pH 7.1) and homogenized with 10 strokes of a Potter Elvehjem Teflon hand-held homogenizer before centrifuging for 30 min at 30,000g. The final pellet was resuspended in an isotonic buffer solution (300 mM mannitol, 0.1 mM MgSO4, and 20 mM HEPES/Tris pH 7.4) and homogenized by passing through a 27-gauge needle several times. The protein concentration in the BBMV was estimated by its ability to bind Coomassie blue according to the Bio-Rad assay technique. Porcine γ-globulin was used as the standard. Inclusion of protease inhibitors in the buffers is essential for avoiding SGLT1 protein degradation.
In preparation for western blot analysis, aliquots of freshly prepared BBMV were diluted with the sample buffer (62.5 mM Tris/HCl pH 6.8, 10% (v/v) glycerol, 2% (w/v) SDS, 0.05% (v/v) β-mercaptoethanol, and 0.05% (w/v) bromophenol blue) and stored at −20 °C until use. The remaining BBMV were divided into aliquots and stored in liquid nitrogen or used immediately for glucose uptake studies.
Western Blotting
The abundance of SGLT1 and β-actin proteins in the BBMV isolated from rabbit small intestine was determined by western blotting as described previously.12,21 Protein components of BBMV (20 μg) were separated by sodium dodecyl sulfate (SDS)-polyacrylamide gel electrophoresis on 8% (w/v) polyacrylamide mini gels, containing 0.1% (w/v) SDS, and electrotransferred to polyvinylidene difluoride (PVDF) membranes. The PVDF membranes were blocked for 1 h at room temperature (RT) in PBS containing 0.5% (w/v) nonfat dried milk and 0.05% (v/v) Tween-20 (PBS-TM). Incubation for 1 h with the SGLT1 antibody diluted 1:1000 in PBS-TM then followed.
Immunoreactive bands were detected by incubation for 1 h with affinity purified horseradish peroxidase-linked anti-rabbit secondary antibody diluted 1:2000 in PBS-TM and visualized using the Immobilon Western Chemiluminescent HRP Substrate and Bio-Max Light Chemiluminescence Film. The intensity of the immunoreactive bands was quantified using scanning densitometry (Total Lab, Newcastle-upon-Tyne, UK).
The PVDF membranes were stripped by 3 × 10 min washes in 137 mM NaCl and 20 mM glycine/HCl (pH 2.5) and then reprobed with a monoclonal antibody to β-actin used as a loading control. Blocking solution consisted of 0.1% (v/v) Triton X-100 and 0.1 mM EDTA in PBS (PBS-TE) and 5% (w/v) skimmed milk powder. PBS-TE was used for the incubation and washing buffers. Horseradish peroxidase-linked anti-mouse secondary antibody diluted 1:2000 in PBS-TE was used and visualized as above.
Measurement of Na+-Dependent Glucose Uptake
Na+-dependent glucose uptake into rabbit intestinal BBMV was measured as described.12,19 The uptake of d-glucose was initiated by the addition of 100 μL of incubation medium (100 mM NaSCN (or KSCN), 100 mM mannitol, 20 mM HEPES/Tris (pH 7.4), 0.1 mM MgSO4, 0.02% (w/v) NaN3, and 0.1 mM [U-14C]-d-glucose (10.6 GBq/mmol)) to BBMV (100 μg of protein) at 37 °C. The reaction was stopped after 3 s by the addition of 1 mL of ice-cold stop buffer (150 mM KCl, 20 mM HEPES/Tris (pH 7.4), 0.1 mM MgSO4, 0.02% (w/v) NaN3, and 0.1 mM phlorizin). Aliquots (0.9 mL) of the reaction mixture were removed and filtered under vacuum through a 0.22 μm pore cellulose acetate/nitrate filter. The filter was washed with 5 × 1 mL of ice-cold stop buffer and placed in a vial containing 4 mL of scintillation fluid, and the radioactivity retained on the filter measured using a Tri-Carb 2910TR Liquid Scintillation Analyzer (PerkinElmer, Bucks, UK). All uptakes were measured in duplicate.
Morphometry
Rabbit small intestinal tissues were fixed and cryo-protected before being embedded in OCT (Fisher Scientific, UK), frozen at −20 °C, and then kept at −80 °C until use. Tissue blocks were sectioned (10 μm) on a cryostat (Leica, CM 1900UV-1-1, Milton Keynes, Buckinghamshire, UK) and thaw-mounted onto polylysine-coated slides. Morphometric analysis was performed as described previously.12 The sections were exposed to tap water for 1 min, transferred to Mayer’s Hemalum for 1 min, and washed gently with running tap water for 5 min. They were stained with eosin Y solution for 30 s and subsequently dehydrated by stepwise washing in 70% ethanol (v/v) for 2 × 1 min, absolute ethanol for 2 × 1 min, and xylene for 3 × 1 min before mounting with the D.P.X. neutral mounting medium.
Digital images were captured with an Eclipse E400 microscope and DXM 1200 digital camera (Nikon, Kingston upon Thames, Surrey, UK), analyzed using ImageJ software (Wayne Rasband, US National Institutes of Health, Bethesda, MD), and calibrated using a 100 μm gradient slide. The crypt depth and the villus height were measured as the average distance from the crypt base to crypt-villus junction and villus base to villus tip, respectively. The villus height and the crypt depth measurements were taken from an average of 16 well-oriented crypt-villus units. A minimum of three images were captured per section with a minimum of eight sections prepared per animal, with each section being five sections apart within the block. All images were captured under the same conditions with care taken to ensure that the same villus was not counted twice.
Immunohistochemistry
Immunohistochemistry was performed as previously described.22 Tissue sections (10 μm thick, on polylysine coated slides) were washed five times for 5 min each in PBS. Slides were then incubated for 1 h in a blocking solution (10% (v/v) donkey serum in PBS) at room temperature in a humidified chamber. Subsequently, sections were incubated overnight at 4 °C with primary polyclonal antibodies. The antibodies to chromogranin A (1:100), T1R2 (1:200), and T1R3 (1:200) were used. The T1R2 antibody was raised against a peptide corresponding to residues 426–570 of mouse T1R2 that shares 66% homology with rabbit T1R2 and T1R3 to a peptide corresponding to the C-terminus of human T1R3. Cloned rabbit T1R3 shares 69% homology to human T1R3. After incubation of sections with primary antibodies, slides were washed five times for 5 min each in PBS and subsequently stained for 1 h at room temperature using a 1:500 dilution of Cyanine 3 (Cy3)- or fluorescein isothiocyanate (FITC)-conjugated anti-goat, anti-rabbit, and anti-mouse IgG secondary antibodies. The composition of the buffer containing antibodies (primary or secondary) was 2.5% (v/v) donkey serum, 0.25% (w/v) NaN3, and 0.2% (v/v) Triton X-100 in PBS. Finally, slides were washed five times for 5 min each in PBS and then mounted with the Vectashield Hard Set Mounting Medium with (DAPI). Immunofluorescent labeling of chromogranin A, T1R2, and T1R3 proteins was visualized using an epifluorescence microscope (Nikon, Kingston-Upon-Thames, UK), and images were captured with a digital camera (model C4742-96-12G04, Hamamatsu Photonics, Welwyn Garden City, UK). Omission of primary antibodies was routinely used as the control.
Statistical Analysis
All parameters were tested for normality by the Shapiro–Wilk test. For comparison of SGLT1 expression in intestinal tissues and measurements of crypt-depth/villus height in intestinal tissues a Student’s two-tailed t-test was used to determine the statistical significance (GraphPad Prism 5, GraphPad Software Inc., La Jolla, CA). The level of statistical significance was set at p < 0.05.
Results
Phase 1 Studies
Assessment of Rabbit Performance
Rabbit daily weight gain, feed intake, and gain to feed ratios are presented in Figure 1. E. coli inoculation markedly decreased daily weight gain (p < 0.001; Figure 1A) across all dietary treatments until surviving animals had recovered by day 19 post infection (63 days of age). There was no effect of dietary supplementation on daily weight gain (p > 0.70; Figure 1A). Feed intake was not affected by inoculation (Figure 1B). There was a trend for an effect of dietary treatment (p < 0.10) such that the animals supplemented with 75 ppm SL consumed more feed in the middle of the clinical phase of disease (day 12 post infection; 56 days of age; Figure 1B). Inoculation markedly decreased efficiency of growth (p < 0.001; Figure 1C), and this was not influenced by dietary treatment (p > 0.50). None of the groups recovered to pre-inoculation feed efficiency for the duration of the study.
Figure 1.
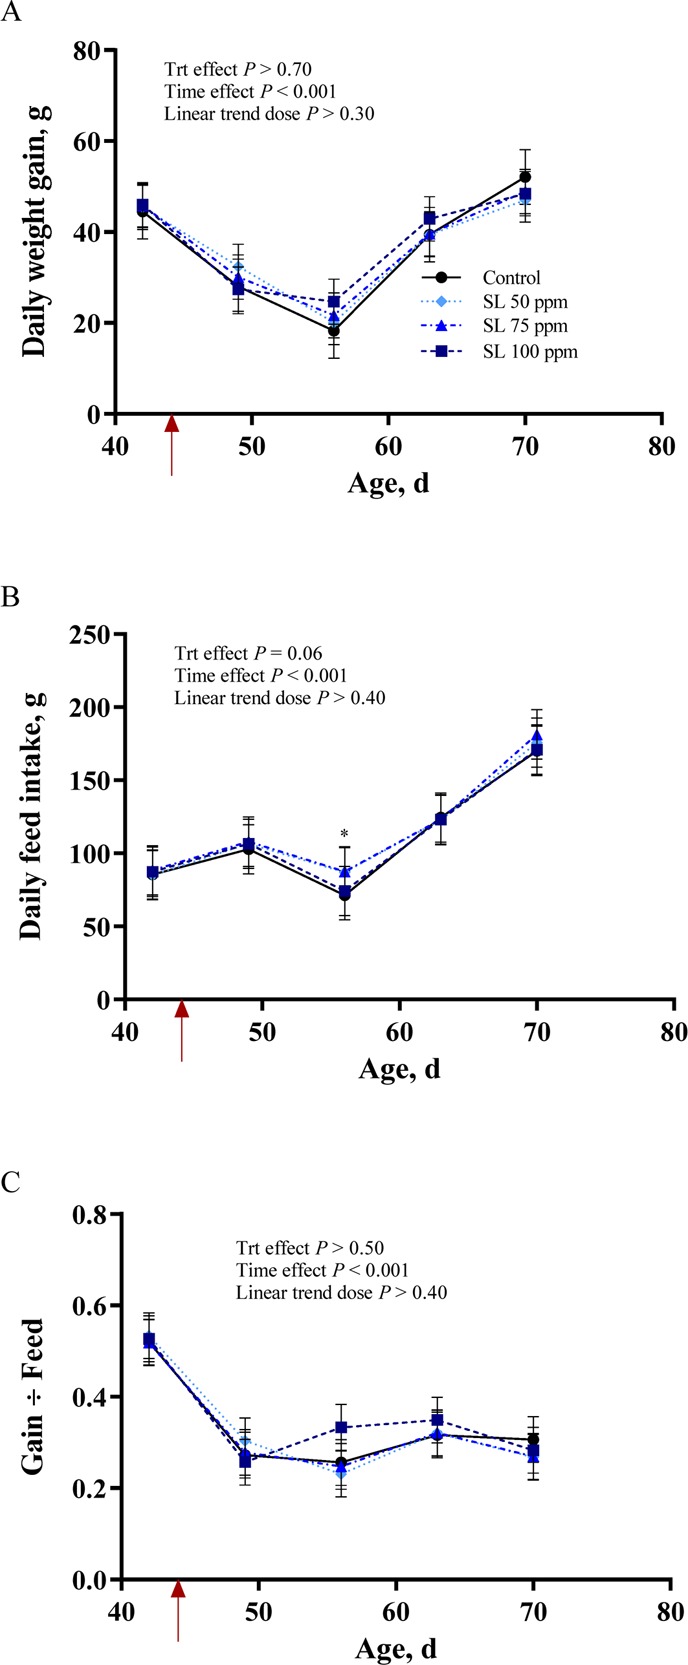
Growth performance of rabbits supplemented with 0, 50, 75, or 100 ppm of an additive containing natural high-intensity sweetener (SL) and inoculated with Escherichia coli on day 44 of age (red arrow). Data presented are (least-squares) (LS) Means, with pooled SEM per group indicated by error bars. (A) Daily weight gain. (B) Daily feed intake. (C) Gain:feed.
Mortality and Morbidities
Rabbit rates of mortality are presented in Figure 2. The colibacillosis challenge had a strong effect and elicited a marked increase in mortality rate with peak levels reached on day 19 post infection (63 days of age). There was no effect of dietary treatment on the percent rate of mortality (p > 0.30), and cumulative death was increased by inoculation (p < 0.001; Figure 2). The average body weight on day 26 post infection (70 day of age) was multiplied by the number of animals alive on that day to give production weights of 112.5, 119.2, 121.2, and 111.9 g for animals supplemented with 0, 50, 75, and 100 ppm SL, respectively.
Figure 2.
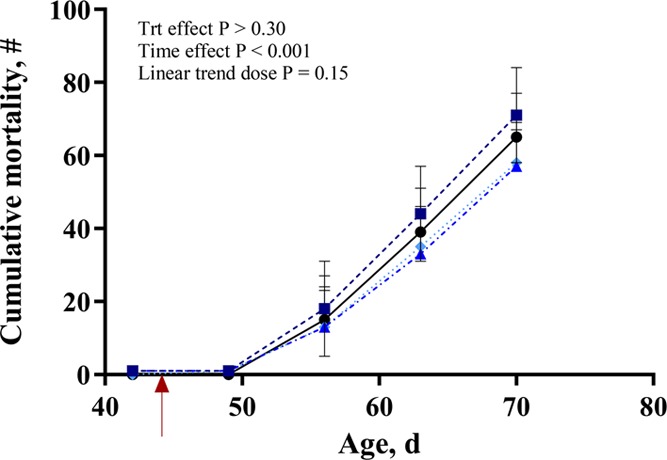
Mortality of rabbits supplemented with 0, 50, 75, or 100 ppm of an additive containing natural high-intensity sweetener (SL) and inoculated with Escherichia coli on day 44 of age (red arrow). Data presented are LS Means, with pooled SEM per group indicated by error bars. Results show the total number of dead animals over time. Mortality was calculated by dividing the number of new deaths recorded at each time point by the number of animals alive at the previous time point and then multiplying by 100.
Morbidities (diarrhea and bloat) are presented in Figure 3. The majority of morbidities observed were diarrhea, and this was increased with inoculation (p < 0.001; Figure 3A). All animals reached pre-inoculation levels by day 26 post infection (70 d of age), and there was no effect of dietary treatment on percent morbidities (p > 0.40; Figure 3A). The cumulative number of morbidities also increased with inoculation (p < 0.001; Figure 3B), and there was a significant treatment effect characterized by fewer morbid animals in the 50 and 75 ppm SL groups compared to control animals (p < 0.01; Figure 3B).
Figure 3.
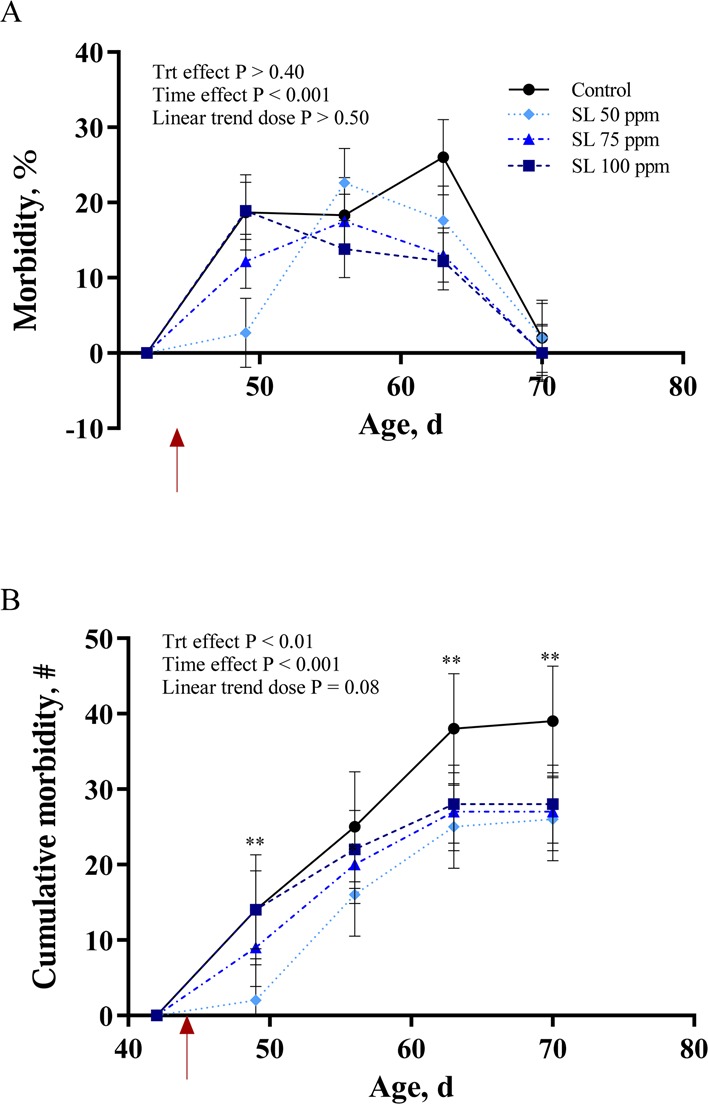
Morbidity (diarrhea, abnormal feces, and/or bloat) of rabbits supplemented with 0, 50, 75, or 100 ppm of an additive containing natural high-intensity sweetener (SL) and inoculated with Escherichia coli on day 44 of age (red arrow). Data presented are LS Means, with pooled SEM per group indicated by error bars. (A) Percent morbidity over time. (B) Cumulative morbidity over time. * = p < 0.05; ** = p < 0.01
Phase 2 Studies
Rabbit SGLT1 Expression and Activity Are Enhanced by Feed Supplementation with the Natural High-Intensity Sweetener, Stevia Leaf
SGLT1 expression and activity were determined along the length of the small intestine in rabbits fed a diet supplemented with SL and the same diet without SL (control diet). Irrespective of diets, levels of SGLT1 mRNA, protein, and function were highest in the duodenum (duodenum > jejunum > ileum). There was a 1.4-fold (p < 0.05) and 1.3-fold (p < 0.001) increase in SGLT1 mRNA abundance in the duodenum and jejunum of rabbits fed a diet supplemented with SL compared to control diet (Figure 4A). SGLT1 protein abundance measured in BBMV increased by 1.6-fold (p < 0.001) and 1.6-fold (p < 0.001) in the duodenum and jejunum of rabbits fed a diet supplemented with SL compared to control (Figure 4B). This was matched by a 1.8-fold (p < 0.050) and 1.7-fold (p < 0.050) increase in the initial rates of d-glucose transport into BBMV in the duodenum and jejunum of rabbits fed the diet supplemented with SL (Figure 4C). No increases in either SGLT1 mRNA, protein abundance, or the initial rate of d-glucose transport into BBMV were observed in the ileum of rabbits fed the diet supplemented with SL compared to control diet (Figure 4). There was a 1.4-fold (p < 0.0010) and 1.3-fold (p < 0.0010) increase in villus height in the duodenum and jejunum of SL fed rabbits compared to controls (Figure 5). There was no difference in the average villus heights of control and SL fed rabbits in the ileum.
Figure 4.

Expression and activity of SGLT1 in the intestine of control rabbits and in rabbits maintained on the same diet supplemented with SL. Brush border membrane vesicles (BBMV) and RNA were isolated from small intestinal tissues of rabbits fed either a control diet (C) or a diet supplemented with an additive containing natural high-intensity sweetener (SL). (A) Level of SGLT1 mRNA abundance normalized to β-actin, RNA polymerase II, and β-2-microglobulin mRNA. (B) Expression of SGLT1 and β-actin proteins in BBMV isolated from the small intestine assessed by western blotting (left panel). Densitometric analysis of SGLT1 protein abundance normalized to β-actin (right panel). (C) Initial rates of Na+-dependent [U14C]-d-glucose uptake into BBMV. Data were generated in triplicate. Results are shown as mean ± SEM; n = 7 animals. Statistically significant results determined using a Student’s two-tailed t-test where * = p < 0.050; ** = p < 0.010; *** = p < 0.001.
Figure 5.

Morphometric analysis of the rabbit intestine. (A) Representative light micrographs of small intestinal tissues of control and natural high-intensity sweetener (SL) fed rabbits. Images were obtained at 4× magnification. (B) Morphometric analyses of villus height and crypt depths are shown as histograms, in (μm) ± SEM. Control (box), SL-fed (solid box); n = 5 animals. Statistically significant results were determined using Student’s two-tailed t-test where ** = p < 0.010.
Expression of T1R2 and T1R3 in the Rabbit Intestine
For rabbit T1R2, PCR primers were designed against the predicted mRNA sequence available on the National Center for Biotechnology Information (NCBI) nonredundant nucleotide database. PCR amplicons using rabbit jejunal cDNA and the designed T1R2 primers resulted in a 152 bp amplicon, which was found to be a 100% match to the predicted NCBI sequence, revealing that the rabbit intestine expresses T1R2 (Figure 6). An alignment of the full-length rabbit T1R2 mRNA sequence showed 55.3% homology with cow, pig, human, mouse, and rat T1R2.
Figure 6.
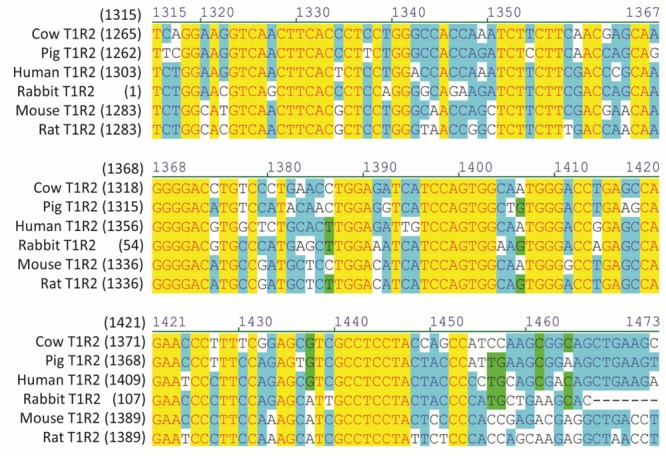
Alignment of rabbit T1R2 mRNA sequence with the corresponding region of cow, pig, human, mouse, and rat T1R2 (numbers in parentheses relate to initiating nucleotide).
As no sequence information on rabbit T1R3 was available from the current release of the rabbit genome (NCBI OryCun2.0 Annotation Release 102), it was necessary to clone rabbit T1R3 to obtain mRNA sequence data and verify its expression in the rabbit intestine. PCR amplification using rabbit jejunal cDNA and consensus mammalian T1R3 primers resulted in a 1221 bp fragment that was screened against the National Center for Biotechnology Information (NCBI) nonredundant nucleotide database via BlastN,23 identifying the amplified sequence as being homologous to T1R3 in many other mammalian species. The mRNA fragment was subsequently translated to produce a sequence of 407 amino acids (corresponding to residues 116–515 of human T1R3). Phylogenetic analysis was performed to construct a radial phylogram depicting the relationship of rabbit T1R3 to homologs in various other mammalian species for which sequence information was available (Figure 7). The NCBI accession number for the mRNA sequence of rabbit T1R3 is MK182098.
Immunofluorescence detection for the sweet receptor subunits, T1R2 and T1R3, and the classical marker for enteroendocrine cells, chromogranin A, was performed on frozen tissue sections of rabbit duodenum and jejunum. As shown in Figure 8, T1R2 and T1R3 were co-expressed in the same cell (Figure 8A). Furthermore, both T1R2 and T1R3 were co-expressed with chromogranin A, confirming receptor subunits expression in the enteroendocrine cell (Figure 8B).
Figure 8.
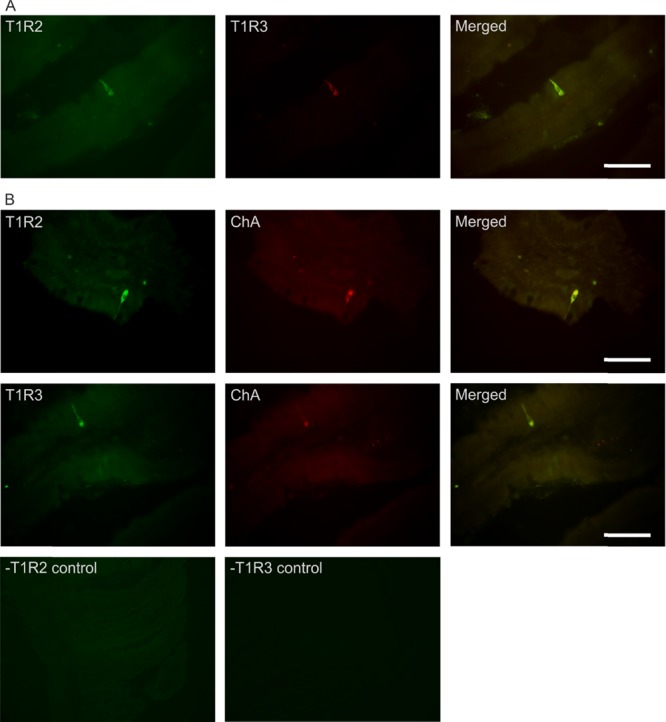
Co-expression of T1R2 and T1R3 in rabbit small intestine. (A) Representative image showing expression of T1R2 (green), T1R3 (red), and merged image (yellow) in serial sections of rabbit small intestine as determined by double immunohistochemistry. (B) Typical image showing expression of T1R2 or T1R3 (green), the enteroendocrine marker, chromogranin A (ChA, red), and merged image (yellow). Specificity of primary antibodies for T1R2 and T1R3 has been validated in mice.6 Omission of primary antibodies for T1R2 or T1R3 showed no nonspecific immunoreactivity with secondary antibodies (-T1R2 control and -T1R3 control). All images were taken under 400× magnification; scale bars represent 20 μm.
Discussion
Feeding of low-level antibiotics has been a routine procedure for controlling enteric pathogens, preventing disease and improving health and growth, in particular in post-weaning animals.24 However, increasing antibiotic resistance and rising consumer concern over prophylactic antibiotic use in animal production has led to a concerted search for effective alternatives. In humans, oral rehydration therapy, which relies on absorption of glucose via SGLT1, activating electrolyte and water absorption, is a safe and effective method for the treatment of E. coli- and Vibrio cholerae-induced diarrhea.1 The discovery that sensing of sugars and sweeteners by the gut-expressed sweet receptor T1R2-T1R3 enhances the expression and activity of SGLT14 has allowed the design of novel strategies for animal nutrition that use artificial sweeteners to combat diarrheal and enteric diseases.25
E. coli-induced diarrhea is endemic in rabbits and results in high rates of morbidity and mortality. In the EU, artificial sweeteners are not permitted to be used in rabbit feed.
We hypothesized that the rabbit intestine expresses the intestinal sweet receptor T1R2-T1R3 and that a natural high intensity sweetener (stevia) activates the receptor leading to SGLT1 upregulation, improving E. coli-induced enteric disorders. The supplement used in this study contained a small amount (2%) of capsicum oleoresin (4.9 μM capsaicin) shown to influence immunity. However, using heterologous expression of rabbit T1R2-T1R3, we have determined that capsaicin does not activate rabbit T1R2-T1R3. In contrast, stevia leaf extract (SL) activates the receptor in a dose-dependent manner (unpublished data).
Works in the laboratory of Tavakkolizadeh and colleagues26,27 have questioned the role of vagal afferent fibers in SGLT1 regulation by vagotomy and deafferentation with 1 mg of capsaicin applied per animal. They have concluded that vagal deafferentation abolishes SGLT1 upregulation in response to increased luminal glucose. They have further proposed that the specific involvement of vagal afferent fibers and the enteric nervous system in glucose-sensing initiated regulatory pathway controlling SGLT1 expression remains unclear.27
Bates et al.28 have shown that guinea pigs treated with vehicle and thus having intact vagal afferent fibers were able to increase the ability to enhance intestinal glucose transport when switched from a low- to a high-carbohydrate containing diet. In contrast, animals that orally received a 32.8 mM solution of capsaicin demonstrated no adaptation to alterations in dietary composition.28 Interestingly, Nassar et al.29 have shown that capsaicin (160 and 800 μM) reduces intestinal alanine absorption when perfused either intraluminally or applied topically to the vagus nerve, concluding the involvement of vagal capsaicin sensitive primary afferent fibers in this inhibitory mechanism.29 Thus, it appears that capsaicin may have a generalized effect on inhibiting a range of intestinal nutrient absorptive processes.
The results of studies carried out by Stearns et al.26,27 and Bates et al.28 are in contrast to this study. In our study, rabbits fed diets that included stevia and capsaicin (maximum capsaicin concentration, 4.9 μM) were able to upregulate glucose transporter expression/activity compared to those fed the same diet without stevia and capsaicin.
We have shown recently that electric field stimulation of an isolated segment of the intestine results in a 2- to 3-fold increase in SGLT1 upregulation.6 This increase is abolished in the presence of the nerve blocking agent tetrodotoxin, indicating the involvement of the enteric nervous system in the regulatory pathway. We used this strategy because sensing of glucose or artificial sweeteners via T1R2-T1R3, expressed in enteroendocrine cells, stimulates GLP-2 release, and GLP-2 via binding to its receptor (GLP-2R) present in enteric neurons induces an action potential.30 We showed that electric field stimulation of enteric neurons induces a neural response leading to secretion of specific neuropeptides that upregulate SGLT1 expression in the neighboring absorptive enterocyte by enhancing the half-life of SGLT1 mRNA and thus increased SGLT1 protein abundance.6 Our studies strongly support the involvement of enteric neurons in a glucose-sensing initiated pathway regulating SGLT1 expression.6 Additional studies are required to address if there is a specific involvement of the vagus nerve in the SGLT1 regulatory pathway.
In this study, we determined the effect of supplementation of feed with an additive containing SL on rabbit intestinal SGLT1 expression as sweeteners are known to enhance Na+-dependent glucose absorption in other mammalian species.4,12,13 Since the regulatory pathway controlling SGLT1 expression/function is initiated by activation of the gut-expressed sweet receptor T1R2-T1R3, we aimed to identify if these receptor subunits were expressed in the rabbit intestine. The gene for rabbit T1R2 has previously been identified from the rabbit genome sequence located on chromosome 13 (NCBI OryCun2.0 Annotation Release 102); however, no information was available for rabbit T1R3. To determine the expression of T1R2 and T1R3 in the rabbit intestine, a PCR-based strategy was used to demonstrate that the rabbit intestine does indeed express both receptor subunits T1R2 and T1R3 at the mRNA level. Moreover, by immunohistochemistry, we showed that T1R2 and T1R3 proteins are co-expressed in the same intestinal enteroendocrine cell. Furthermore, SGLT1 mRNA, protein abundance, and glucose transport function were increased ∼2-fold by dietary inclusion of SL, providing a higher capacity for the rabbit intestine to absorb glucose, electrolyte, and water. There was also a 1.4-fold increase in villus height in rabbits consuming SL likely due to GLP-2 action.13 In these dietary studies, we maintained rabbits on diet with and without SL for 9 days. We have shown SGLT1 upregulation, with a similar increase in magnitude after 1 or 5 days in response to increased dietary carbohydrates or sweeteners,4,6 indicating that an increase in SGLT1 expression occurs in existing absorptive enterocytes.6,7 However, since this was the first time that we were assessing potential SGLT1 upregulation in response to inclusion of a natural sweetener in the feed of rabbits, we selected a 5 day dietary trial in order to cover intestinal epithelial cell turnover that takes 4–5 days in the majority of species. This period was extended to 9 days because of the researcher travel delays from the UK to France for harvesting rabbit intestinal tissues.
We also assessed the effect of supplementation of rabbit feed with SL on relieving E. coli-induced enteric disorders and observed that inclusion of SL in the feed decreases morbidity associated with disease. Although we did not observe a linear dose response, there was a clear trend for improved morbidities at the two lower doses. Such hormetic responses to plant-based supplements are common; very low doses are beneficial, whereas higher doses are nonspecific and detrimental.31 To our knowledge, this is the first report evaluating the effect of a natural sweetener on rabbit health and performance and the associated molecular mechanisms.
The E. coli challenge elicited a marked impact on performance characterized by blunted feed intake, decreased daily gain, and efficiency of growth. These are classical signs of infection that not only lead to stressed animals but also have a devastating economic impact in rabbit production. The use of artificial sweeteners to prevent decreased performance during stress has been explored previously. For example, Sterk et al.32 reported that supplementation of weanling piglets with artificial sweeteners prevented the decrease in feed intake around weaning. Similar observations have been made for receiving feedlot cattle with respect to both feed intake33 and daily weight gain.34 Whilst, in this study, the inclusion of SL in the feed had some impact on feed intake, the major effect was at the gut level where activation of gut-expressed T1R2-T1R3 by sweeteners results in the secretion of GLP-2, a gut hormone that can alter appetite,35 and also an increase the intestinal uptake of glucose leading to improved efficiency of growth.6 It has indeed been shown that artificial sweeteners directly introduced into the lumen of the intestine, bypassing the oral cavity, lead to an increase in expression of SGLT1 and higher rates of intestinal glucose absorption.27
It was noteworthy that the E. coli challenge in this study was quite severe, with the mortality rate peaking at nearly 60% during the clinical trials in some groups. Despite the severity of the disease challenge, the supplement, at lower doses, showed a trend for a positive effect on cumulative morbidities. This observation was consistent with those we made during our preliminary experiments to establish the optimal timing and dose of inoculation (data not shown). A previous work using an artificial high-intensity sweetener has revealed similar effects during enteric disease challenge,36 but this is the first report on the impact of a natural high-intensity sweetener for prevention of clinical signs of enteritis in rabbits. The positive impact of the supplement on morbidities, combined with the molecular responses we observed, are consistent with an increase in GLP-2 secretion, which is known to be essential for gut repair after injury,25 and also an enhancement in nutrient absorption.6 In this scenario, the increased glucose, electrolyte, and water absorption at the intestinal level likely decreased the clinical signs of disease associated with diarrhea, and the enteric lesions caused by the pathogen were likely reduced or repaired in supplemented animals due to the GLP-2 effect.
Author Present Address
# AVT Natural Products Limited, Kerala, India.
Author Present Address
⊥ Land O′ Lakes, Minneapolis, Minnesota.
Author Contributions
∇ A.W.M. and M.A.A-R. contributed equally to this work. S.P.S.-B. is responsible for conception of studies described in phase 2, with A.W.M. designing and carrying out experiments on isolating rabbit intestinal BBMV, western blotting, glucose transport function, and morphometric analyses and determining intestinal expression of T1R2. M.A.A.-R. performed immunohistochemistry. K.D. cloned and sequenced rabbit T1R3. S.P.S.-B., A.W.M., and K.D. analyzed and interpreted the data. E.G. carried out feed trial studies described in phases 1 and 2 of the study. C.I. assisted in the experimental design, and D.M.B. conceptualized the project and the potential application of the supplement in rabbits. E.H.W. designed, directed, discussed phases 1 and 2 of animal studies, and commented on the paper. S.P.S.-B. wrote the paper.
The authors declare no competing financial interest.
References
- Hirschhorn N.; Greenough W. B. Progress in oral rehydration therapy. Sci. Am. 1991, 264, 50–56. 10.1038/scientificamerican0591-50. [DOI] [PubMed] [Google Scholar]
- Hamilton K. L. Robert K. Crane-Na+-glucose cotransporter to cure?. Front. Physiol. 2013, 4, 53. 10.3389/fphys.2013.00053. [DOI] [PMC free article] [PubMed] [Google Scholar]
- Dyer J.; Salmon K. S. H.; Zibrik L.; Shirazi-Beechey S. P. Expression of sweet taste receptors of the T1R family in the intestinal tract and enteroendocrine cells. Biochem. Soc. Trans. 2005, 33, 302–305. 10.1042/BST0330302. [DOI] [PubMed] [Google Scholar]
- Margolskee R. F.; Dyer J.; Kokrashvili Z.; Salmon K. S. H.; Ilegems E.; Daly K.; Maillet E. L.; Ninomiya Y.; Mosinger B.; Shirazi-Beechey S. P. T1R3 and gustducin in gut sense sugars to regulate expression of Na+-glucose cotransporter 1. Proc. Natl. Acad. Sci. U. S. A. 2007, 104, 15075–15080. 10.1073/pnas.0706678104. [DOI] [PMC free article] [PubMed] [Google Scholar]
- Jang H. J.; Kokrashvili Z.; Theodorakis M. J.; Carlson O. D.; Kim B. J.; Zhou J.; Kim H. H.; Xu X.; Chan S. L.; Juhaszova M.; Bernier M.; Mosinger B.; Margolskee R. F.; Egan J. M. Gut-expressed gustducin and taste receptors regulate secretion of glucagon-like peptide-1. Proc. Natl. Acad. Sci. U. S. A. 2007, 104, 15069–15074. 10.1073/pnas.0706890104. [DOI] [PMC free article] [PubMed] [Google Scholar]
- Moran A. W.; Al-Rammahi M. A.; Batchelor D. J.; Bravo D. M.; Shirazi-Beechey S. P. Glucagon-Like Peptide-2 and the Enteric Nervous System Are Components of Cell-Cell Communication Pathway Regulating Intestinal Na+/Glucose Co-transport. Front. Nutr. 2018, 5, 101. 10.3389/fnut.2018.00101. [DOI] [PMC free article] [PubMed] [Google Scholar]
- Cheeseman C. I. Upregulation of SGLT-1 transport activity in rat jejunum induced by GLP-2 infusion in vivo. Am. J. Physiol. Regul. Integr. Comp. Physiol. 1997, 273, R1965–R1971. 10.1152/ajpregu.1997.273.6.R1965. [DOI] [PubMed] [Google Scholar]
- Burrin D.; Guan X.; Stoll B.; Petersen Y. M.; Sangild P. T. Glucagon-Like Peptide 2: A Key Link between Nutrition and Intestinal Adaptation in Neonates?. J. Nutr. 2003, 133, 3712–3716. 10.1093/jn/133.11.3712. [DOI] [PubMed] [Google Scholar]
- Shirazi-Beechey S. P.; Moran A. W.; Batchelor D. J.; Daly K.; Al-Rammahi M. Glucose sensing and signalling; regulation of intestinal glucose transport. Proc. Nutr. Soc. 2011, 70, 185–193. 10.1017/S0029665111000103. [DOI] [PubMed] [Google Scholar]
- Brubaker P. L. Glucagon-like Peptide-2 and the Regulation of Intestinal Growth and Function. Compr. Physiol. 2018, 8, 1185–1210. 10.1002/cphy.c170055. [DOI] [PubMed] [Google Scholar]
- Ren W.; Wu J.; Li L.; Lu Y.; Shao Y.; Qi Y.; Xu B.; He Y.; Hu Y. Glucagon-Like Peptide-2 Improve Intestinal Mucosal Barrier Function in Aged Rats. J. Nutr. Health. Aging 2018, 22, 731–738. 10.1007/s12603-018-1022-8. [DOI] [PubMed] [Google Scholar]
- Moran A. W.; Al-Rammahi M. A.; Arora D. K.; Batchelor D. J.; Coulter E. A.; Daly K.; Ionescu C.; Bravo D.; Shirazi-Beechey S. P. Expression of sodium/glucose co-transporter 1 (SGLT1) is enhanced by supplementation of the diet weaning piglets with artificial sweeteners. Br. J. Nutr. 2010, 104, 637–646. 10.1017/S0007114510000917. [DOI] [PubMed] [Google Scholar]
- Moran A. W.; Al-Rammahi M.; Zhang C.; Bravo D.; Calsamiglia S.; Shirazi-Beechey S. P. Sweet taste receptor expression in ruminant intestine and its activation by artificial sweeteners to regulate glucose absorption. J. Dairy Sci. 2014, 97, 4955–4972. 10.3168/jds.2014-8004. [DOI] [PubMed] [Google Scholar]
- Bojahr J.; Brockhoff A.; Daly K.; Meyerhof W.; Shirazi-Beechey S. Characterization of the pig sweet taste receptor by heterologous expression. Chem. Senses 2015, 40, 270–271. [Google Scholar]
- Saitou N.; Nei M. The neighbor-joining method: a new method for reconstructing phylogenetic trees. Mol. Biol. Evol. 1987, 4, 406–425. 10.1093/oxfordjournals.molbev.a040454. [DOI] [PubMed] [Google Scholar]
- Jones D. T.; Taylor W. R.; Thornton J. M. The rapid generation of mutation data matrices from protein sequences. Comput. Appl. Biosci. 1992, 8, 275–282. 10.1093/bioinformatics/8.3.275. [DOI] [PubMed] [Google Scholar]
- Felsenstein J. PHYLIP-Phylogeny Inference Package (Version 3.2). Cladistics 1989, 5, 164–166. [Google Scholar]
- Ye J.; Coulouris G.; Zaretskaya I.; Cutcutache I.; Rozen S.; Madden T. L. Primer-BLAST: A tool to design target-specific primers for polymerase chain reaction. BMC Bioinformatics 2012, 13, 134. 10.1186/1471-2105-13-134. [DOI] [PMC free article] [PubMed] [Google Scholar]
- Shirazi-Beechey S. P.; Davies A. G.; Tebbutt K.; Dyer J.; Ellis A.; Taylor C. J.; Fairclough P.; Beechey R. B. Preparation and properties of brush-border membrane vesicles from human small intestine. Gastroenterology 1990, 98, 676–685. 10.1016/0016-5085(90)90288-C. [DOI] [PubMed] [Google Scholar]
- Rowell-Schäfer B. A.; Dyer J.; Hofmann R. R.; Lechner-Doll M.; Meyer H. H. D.; Shirazi-Beechey S. P.; Streich W. J. Abundance of intestinal Na+/glucose cotransporter (SGLT1) in roe deer (Capreolus capreolus). J. Anim. Physiol. Anim. Nutr. 1999, 82, 25–32. 10.1046/j.1439-0396.1999.00215.x. [DOI] [Google Scholar]
- Dyer J.; Vayro S.; King T. P.; Shirazi-Beechey S. P. Glucose sensing in the intestinal epithelium. Eur. J. Biochem. 2003, 270, 3377–3388. 10.1046/j.1432-1033.2003.03721.x. [DOI] [PubMed] [Google Scholar]
- Dyer J.; Al-Rammahi M.; Waterfall L.; Salmon K. S. H.; Geor R. J.; Bouré L.; Edwards G. B.; Proudman C. J.; Shirazi-Beechey S. P. Adaptive response of equine intestinal Na+/glucose co-transporter (SGLT1) to an increase in dietary soluble carbohydrate. Pflugers Arch. Eur. J. Physiol. 2009, 458, 419–430. 10.1007/s00424-008-0620-4. [DOI] [PubMed] [Google Scholar]
- Johnson M.; Zaretskaya I.; Raytselis Y.; Merezhuk Y.; McGinnis S.; Madden T. L. NCBI BLAST: a better web interface. Nucleic Acids Res. 2008, 36, W5–W9. 10.1093/nar/gkn201. [DOI] [PMC free article] [PubMed] [Google Scholar]
- Rhouma M.; Fairbrother J. M.; Beaudry F.; Letellier A. Post weaning diarrhea in pigs: risk factors and non-colistin-based control strategies. Acta Vet Scand. 2017, 59, 31. 10.1186/s13028-017-0299-7. [DOI] [PMC free article] [PubMed] [Google Scholar]
- Connor E. E.; Evock-Clover C. M.; Wall E. H.; Baldwin R. L. IV; Santin-Duran M.; Elsasser T. H.; Bravo D. M. Glucagon-like peptide 2 and its beneficial effects on gut function and health in production animals. Domest. Anim. Endocrinol. 2016, S56–S65. 10.1016/j.domaniend.2015.11.008. [DOI] [PubMed] [Google Scholar]
- Stearns A. T.; Balakrishnan A.; Rounds J.; Rhoads D. B.; Ashley S. W.; Tavakkolizadeh A. Capsaicin-sensitive vagal afferents modulate posttranscriptional regulation of the rat Na+/glucose cotransporter SGLT1. Am. J. Physiol. Gastrointest. Liver Physiol. 2008, 294, G1078–G1083. 10.1152/ajpgi.00591.2007. [DOI] [PubMed] [Google Scholar]
- Stearns A. T.; Balakrishnan A.; Rhoads D. B.; Tavakkolizadeh A. Rapid upregulation of sodium-glucose transporter SGLT1 in response to intestinal sweet taste stimulation. Ann. Surg. 2010, 251, 865–871. 10.1097/SLA.0b013e3181d96e1f. [DOI] [PMC free article] [PubMed] [Google Scholar]
- Bates S. L.; Sharkey K. A.; Meddings J. B. Vagal involvement in dietary regulation of nutrient transport. Am. J. Physiol. 1998, 274, G552–G560. 10.1152/ajpgi.1998.274.3.G552. [DOI] [PubMed] [Google Scholar]
- Nassar C. F.; Barada K. A.; Abdallah L. E.; Hamdan W. S.; Taha A. M.; Atweh S. F.; Saade N. E. Involvement of capsaicin-sensitive primary afferent fibers in regulation of jejunal alanine absorption. Am. J. Physiol. Gastrointest. Liver Physiol. 1995, 268, G695–G699. 10.1152/ajpgi.1995.268.4.G695. [DOI] [PubMed] [Google Scholar]
- Mills J. C.; Gordon J. I. The intestinal stem cell niche: there grows the neighborhood. Proc. Natl. Acad. Sci. U. S. A. 2001, 98, 12334–12336. 10.1073/pnas.231487198. [DOI] [PMC free article] [PubMed] [Google Scholar]
- Lillehoj H.; Liu Y.; Calsamiglia S.; Fernandez-Miyakawa M. E.; Chi F.; Cravens R. L.; Oh S.; Gay C. G. Phytochemicals as antibiotic alternatives to promote growth and enhance host health. Vet. Res. 2018, 49, 76. 10.1186/s13567-018-0562-6. [DOI] [PMC free article] [PubMed] [Google Scholar]
- Sterk A.; Schlegel P.; Mul A. J.; Ubbink-Blanksma M.; Bruininx E. M. A. M. Effects of sweeteners on individual feed intake characteristics and performance in group-housed weanling pigs. J. Anim. Sci. 2008, 86, 2990–2997. 10.2527/jas.2007-0591. [DOI] [PubMed] [Google Scholar]
- Ponce C. H.; Brown M. S.; Silva J. S.; Schlegel P.; Rounds W.; Hallford D. M. Effects of a dietary sweetener on growth performance and health of stressed beef calves and on diet digestibility and plasma and urinary metabolite concentrations of healthy calves. J. Anim. Sci. 2014, 92, 1630–1638. 10.2527/jas.2013-6795. [DOI] [PubMed] [Google Scholar]
- McMeniman J. P.; Rivera J. D.; Schlegel P.; Rounds W.; Galyean M. L. Effects of an artificial sweetener on health, performance, and dietary preference of feedlot cattle. J. Anim. Sci. 2006, 84, 2491–2500. 10.2527/jas.2006-098. [DOI] [PubMed] [Google Scholar]
- Baldassano S.; Amato A.; Mulè F. Influence of glucagon-like peptide 2 on energy homeostasis. Peptides 2016, 86, 1–5. 10.1016/j.peptides.2016.09.010. [DOI] [PubMed] [Google Scholar]
- Connor E. E.; Wall E. H.; Bravo D. M.; Evock-Clover C. M.; Elsasser T. H.; Baldwin R. L. IV; Santín M.; Vinyard B. T.; Kahl S.; Walker M. P. Reducing gut effects from Cryptosporidium parvum infection in dairy calves through prophylactic glucagon-like peptide 2 therapy or feeding of an artificial sweetener. J. Dairy Sci. 2017, 100, 3004–3018. 10.3168/jds.2016-11861. [DOI] [PubMed] [Google Scholar]