

Abstract
Luminescent semiconductor quantum dots (QDs) have recently been suggested as novel probes for imaging and sensing cell membrane voltages. However, a key bottleneck for their development is a lack of techniques to assess QD responses to voltages generated in the aqueous electrolytic environments typical of biological systems. Even more generally, there have been relatively few efforts to assess the response of QDs to voltage changes in live cells. Here, we develop a platform for monitoring the photoluminescence (PL) response of QDs under AC and DC voltage changes within aqueous ionic environments. We evaluate both traditional CdSe/CdS and more biologically compatible InP/ZnS QDs at a range of ion concentrations to establish their PL/voltage characteristics on chip. Wide-field, few-particle PL measurements with neuronal cells show the QDs can be used to track local voltage changes with greater sensitivity (ΔPL up to twice as large) than state-of-the-art calcium imaging dyes, making them particularly appealing for tracking subthreshold events. Additional physiological observation studies showed that while CdSe/CdS dots have greater PL responses on membrane depolarization, their lower cytotoxicity makes InP/ZnS far more suitable for voltage sensing in living systems. Our results provide a methodology for the rational development of QD voltage sensors and highlight their potential for imaging changes in cell membrane voltage.
Keywords: Quantum dots, voltage sensing, electric field, photoluminescence, live cell
Real-time imaging and accurate read-out of electrical signals from biological cells is one of the ultimate goals of modern physiology. Several cell types in animals are electrically excitable, for example, neuronal cells which play key roles in motor and sensory control.1 Accurate live imaging of individual neuron dynamics (in the presence of many tens of thousands of neurons) would pave the way for a better understanding of memory2 and associated diseases.3,4 Such advances in neuroscience would also provide a paradigm for the development of artificial intelligence which heavily leans on our understanding of how human brains and neurons operate. Much success has already been achieved in imaging changes in neuronal membrane potential. Existing methods typically combine some form of optical microscopy such as fluorescence intensity5,6 or lifetime imaging,7 2-photon fluorescence,8,9 FRET microscopy,10,11 or Raman12 scattering, with localizable chromophores such as organic dyes,13 tethered organic–inorganic nanoparticles,14,15 DNA origami,16 gold nanoparticles,17 or genetically encoded fluorescent proteins.18−20 In spite of these advances, patch clamp electrophysiology, which is highly invasive, has limited spatial resolution, and can typically be applied to only a few neurons at a time,21 still remains the predominant method to accurately and quantitatively measure membrane potentials. This is because, thus-far, imaging-based techniques have only been able to capture relative changes in membrane voltage due to the challenges posed by developing and benchmarking sufficiently sensitive optical voltage reporters.22
An ideal “optical” electrical sensor should be photostable, bright under low-intensity imaging conditions, and have little or no cytotoxicity.23 Furthermore, it should be sufficiently small (<5 nm) to localize in the cell membrane. Sensor response times should range in the “second to sub-millisecond” interval as changes in membrane voltage potential have this time scale.24 Although several fluorescent dyes have some of the desired characteristics of an ideal electrical sensor, all have one or more limitations.25,26 More fundamentally, very little systematic benchmarking of voltage sensing moieties has been performed to quantitatively analyze their response to a given transmembrane voltage and to compare among them. Consequently, major gaps remain in our understanding for the rational design of cellular voltage probes.
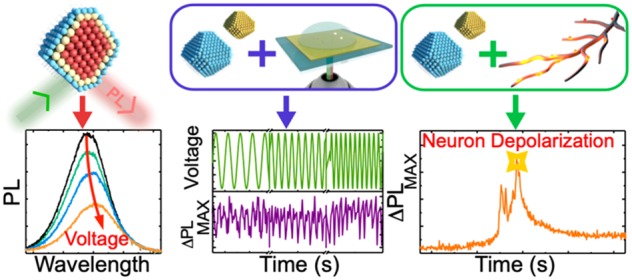
One of the newest and most promising candidates suggested for imaging membrane potential changes is semiconducting quantum dots (QDs).23 Unlike organic chromophores, QDs are typically photostable and can be synthesized to have low cytotoxicity and photoluminescence (PL) intermittency (blinking).27 They are comparatively inexpensive as they can be manufactured by batch or flow routes from cheap precursors avoiding the need for complex and expensive synthetic organic procedures. Placing QDs in an electric field primarily results in a quenching of their emission intensity, shifting of the PL peak maximum to higher or lower energies (quantum confined Stark effect) and broadening of the emission. The first effect, which is the main probe used in this work, arises due the reduction in the electron and hole wave function overlap on application of an electric field. This reduces the exciton radiative rate, which consequently reduces the PL quantum yield, and hence results in a dimming of the QD PL. Recent work has shown that ionization of QDs in the presence of an electric field also plays a significant role in their PL quenching,28 and the exact mechanism of PL quenching remains debated.
Several studies have demonstrated the potential of inorganic QDs as voltage probes, both in ensemble and at the single molecule level. Following the initial work of Marshall et al., which showed theoretically the promise of QDs as voltage sensors,29 Rowland et al. used a solid-state capacitive device to demonstrate that both the lifetime and the PL intensity of QDs are modulated by an electric field,28 with dots containing a type-II band alignment showing markedly better response in ensemble measurements. In addition, Park et al. suggested that “rod”-shaped QDs (nanorods) have the most optimal shape for voltage response and demonstrated their efficacy at the single-particle level as well as successful incorporation into model membranes.30−32 More recently, using a balanced photodetection scheme, Bar-Elli et al. showed that the PL response of QDs to voltage can be observed in wide-field imaging, demonstrating the potential for imaging firing events in many neurons simultaneously.33
Despite this impressive body of work, several outstanding questions remain. First, all such studies have been performed in solid-state capacitive structures where the field strength is held constant throughout the active layer. This contrasts to cell systems where the electric field is created by transmembrane flow of cations or anions.34 To assess the full potential of QDs, measurements must hence be performed in aqueous, ionic environments in which voltage changes are mediated by ion, as opposed to electron, rearrangements. More generally, the capacitive structures typically used are challenging to fabricate, with several dielectric deposition cycles required, where the high-energy conditions may damage dots sandwiched within the device. A platform that can quantitatively evaluate the voltage sensing ability of QDs in a high-throughput, reproducible and nondestructive manner, is therefore required. Furthermore, to the best of our knowledge, evaluation of QD voltage sensors has only been performed on II–VI CdX (X = S, Se, or Te) based materials, whose cytotoxicity can be mitigated by careful engineering, but are generally less desirable for living systems. An alternative to these materials is recently developed III–V indium-based QDs, which generally display lower cytotoxicity.35 For QD voltage sensors to reach their full potential, such biologically friendly compounds must be investigated both in devices and in vivo.15,36
Here we develop and apply a simple, robust device for evaluating the PL/voltage response and efficacy of QDs (and other) voltage probes. Working in an electrolytic environment that closely mimics the nature of field changes across cell membranes, we show that the PL of both II–VI (CdSe/CdS) and III–V (InP/ZnS) QDs are able to respond to fields generated by ion gradients37 and track AC and DC voltage changes. Having evaluated the platform, we then compare the fields measured with the PL response of QDs in retinal ganglion cell (RGC) axons from Xenopus laevis, under membrane depolarization, with single-point PL detection. In some cases, we find good agreement between the PL/voltage changes on chip and those that might be expected on membrane depolarization, however there is often also poor agreement, highlighting the limitations of such a detection scheme and the importance of imaging many neurons simultaneously. Consequently, exploring imaging in a wide-field PL detection modality demonstrates that QDs exhibit a larger PL change (up to ∼50% greater) as compared to that of simultaneously imaged state-of-the-art calcium indicators. These changes in PL can be used to read out (local) changes in membrane potential even when QDs are not directly localized within the cell membrane. Our results provide concrete advances toward generating a reproducible and robust device for quantitatively assessing QD-based voltage sensors and show that QDs (particularly InP/ZnS) have great potential for tracking voltage changes in live cells.
Results
Figure 1a shows a schematic of the platform used to determine the PL response of QDs, or dye molecules, to a voltage. Central to the setup is a device (Figure 1a) consisting of an ITO glass slide, atop which a thin strip (∼300 nm) of dielectric (Ta2O5) is patterned to prevent charge transfer CdSe/CdS or InP/ZnS QDs (wurtzite crystal structure, CdSe/CdS, zinc blende crystal structure, InP/ZnS; see Experimental Methods and Supporting Information (SI), S1 and S2 for additional characterization, e.g., absorption spectra, HAADF STEM), are cast onto the dielectric surface with any excess dots removed following solvent washing (dot layer ∼10 nm thickness). A drop of electrolyte solution (KNO3(aq)) of a known concentration is then placed atop the dots on the chip. Two platinum electrodes are dipped into the electrolyte solution, one acting as the working electrode and the second being a reference; the distance between the electrodes is minimized while taking care to ensure they do not contact and create a short circuit. A third silver electrode is wired to the ITO surface to act as a counter-electrode, and all three connected to a potentiostat from which the applied voltage can be controlled. The device is held within an inverted fluorescence microscope to excite the QDs (532 nm; excitation spot size ∼ 1 μm), with PL collected in reflection and focused onto the entrance of a fiber spectrometer. In this way voltage can simultaneously be applied in a controlled fashion while monitoring the PL response (see SI, S3 circuit diagrams, RC, characteristics, etc.). Nanoparticles are capped with bipyridine ligands, and minimal deattachment of dots from the chip surface is observed on addition of the droplet (control measurements see SI, Sections S4 and S5). We also make note here that because the surface of neuronal membranes is not carefully faceted the exact crystal structure of dots, for example, wurtzite or zinc blende likely plays minimal role in orientation on the membrane surface.
Figure 1.

Electrochemical setup used to apply voltage and monitor PL from QDs. (a) Confocal microscope and electrochemical cell used to evaluate a potential voltage sensor. QDs are deposited at the working electrode/electrolyte interface of an electrochemical cell with voltage applied between the ITO and Pt electrodes, using a potentiostat. Simultaneously, samples are excited with a 532 nm laser (∼1 μm beam size) with emission collected through the ITO back surface. (b) Cartoon schematic of device cross-section shown alongside COMSOL simulation depicting the variation in potential across the device for a positive voltage applied to the ITO. Shown in the case of 1 mM KNO3, the potential is shown to drop predominately across the QD and extended double layer with the Ta2O5 layer (dielectric) experiencing little to no potential drop. (c) Cross-sectional TEM image of chip used for applying a voltage to QDs. The electrochemical device consists of an ITO bottom electrode atop which is evaporated ∼300 nm of high-κ dielectric (Ta2O5); QDs sit smoothly at the electrolyte (KNO3) dielectric interface as shown above.
To understand the voltage drop in the device, we performed finite element simulations (COMSOL), as summarized in Figure 1b. From cross-sectional TEM and STEM-EDX measurements of the device (SI, S6), accounting for carbon deposited (required for imaging) and rinse steps normally deployed, we estimate the thickness of the QD layer to be ∼10 nm. This equates to around 2–3 densely packed layers of QDs on the surface of the ∼300 nm-thick Ta2O5 layer; each material maintains its own dielectric constant (κ ∼ 10, QDs and κ ∼ 30, Ta2O5). Applying a positive (negative) voltage to the ITO induces a polarization in the dielectric which causes an accumulation of negative (positive) charges at the ITO/Ta2O5 interface. Positive (negative) ions consequently accumulate at the Ta2O5-QD/electrolyte top interface. The decay in concentration of negative (positive) ions from the Ta2O5 surface results in a potential drop (Debye–Hückel effect).38 For the monovalent salt and range of concentrations used in this work, the screening length of ions ranges from ∼0.3 nm to ∼300 nm. Due to imperfect packing of the QDs on the surface of the Ta2O5, ions from the solution will permeate through the layers. This coupled with the polarizability of the QDs makes the screening layer evolution and subsequent field drop difficult to exactly ascertain. However, since the applied voltage can be precisely controlled, we can use the thickness of the QD layer alongside the potential drop from COMSOL to estimate the field experienced by the QDs. The simplifying assumption made is that the field will drop uniformly across the 10 nm layer. By using the voltage values obtained from COMSOL, the contribution of the Debye screening effect is taken into account. As supported by simulations (SI, S6), the field is strongest in the region immediately above the dielectric surface within which the QDs sit and the field strength is dependent on the salt concentration. Although the exact manner in which ions arrange around dots (individual height ∼5 nm; dielectric roughness <1.2 nm) is beyond the scope of this work, we believe these simplifying approximations are appropriate to determine the field.
In solid-state capacitive structures, it has been shown that the PL of quasi type-II CdSe/CdS QDs can be modulated by up to 60% on the application of electric fields of ∼0.8 MV/cm.28 We evaluated the electric field response within the device presented here by experiments on similar bipyridine-capped CdSe/CdS as well as relatively unexplored InP/ZnS QDs. The PL response was measured from an ensemble of dots with an estimated ∼10 nm thick layer (see above); the precise number of QDs within this layer is challenging to ascertain, but we note it is sufficiently low that blinking can be observed atop of PL intensity traces (SI, S7). Figure 2a shows the PL response of CdSe/CdS QDs on application of a field of ∼0.9 MV/cm (similar in magnitude to the field change on neuronal membrane depolarization)6,39 using a droplet of 1 M KNO3. In line with previous studies, a clear red shift (∼3 nm) and quenching of the PL peak by ∼60% can be observed on application of this field (quantified as |ΔPL/PL|, where ΔPL is the change in PL (peak) intensity on application of the field, and PL is the peak emission intensity at zero field; the PL intensity is integrated over the 600–750 nm range), along with some degree of PL broadening.31 We note that similar values in terms of the electric field required to produce a given PL change were obtained in the studies by Rowland et al.28 This further validates our methodology for determining the electric field and the resulting magnitudes obtained; any variations in this work might be due to chemical differences in the QDs used. The PL quenching is completely reversible, that is, on returning to zero field the PL intensity and shape return to their original values, indicating that the field does not degrade the dots in any way. Furthermore, QDs capped with an insulating SiO2 shell show a similar degree of PL quenching, indicating electrochemical or charge transfer effects do not play a significant role in the observed response (SI, S7). Repeating the measurements over several devices and across a range of voltages shows that, for fields above 0.6 MV/cm, the PL response scales linearly with the applied voltage (Figure 2b), with up to 90% modulation at 1.25 MV/cm; beyond this field there is no additional response. At fields below ∼0.25 MV/cm, |ΔPL/PL| is small and does not significantly vary with field. The similarity of this behavior to that observed in solid-state device not only validates the device but also, given the similar magnitude in changes, suggests a similar mechanism for PL quenching within our device as compared to previous work.28
Figure 2.

Voltage dependence of steady-state PL spectra. (a) CdSe/CdS QD PL spectrum on the application of an electric field of up to 0.9 MV/cm. The spectra red shift (∼3 nm) and broaden (Δfwhm ∼7 nm) as the field is increased, in line with previous studies.28 (b) Dependence of the change in PL intensity on the electric field strength. Between 0.5 and 1 MV/cm, as the field is increased, |ΔPL/PL| increases approximately linearly; at the extrema of fields (<0.25 MV/cm and 1 MV/cm>), there is a tail off in the response. The error bars are derived from a minimum of 20 repeat experiments. (c) PL spectrum of InP/ZnS QDs on the application of an electric field of up to 0.9 MV/cm. In this case, the spectrum blue shifts (1.5 nm) with a maximum |ΔPL/PL| of ∼70%. (d) |ΔPL/PL| change of CdSe/CdS QDs at varying salt concentrations and constant applied voltage (1 V). |ΔPL/PL| decreases approximately linearly, in line with an increase in the Debye screening length when salt concentration is lowered. Repeating the experiments with deionized water produces no PL change on application of a voltage (SI, S7). (e) Normalized PL response under 1 Hz AC voltage sweep (top blue). The response of both CdSe/CdS (green) and InP/ZnS (maroon) QDs as well as a perylene diimide dye (purple) cast on the chip mirrors the voltage sweep with minimal lag, demonstrating the platform can be used to calibrate the response of a variety of materials to a changing electric field.
The cytotoxic effects of CdX (X = S, Se, Te) nanoparticles on cells have been well studied.40,41 Although the release of toxic Cd2+ can be mitigated with careful surface modification, they are challenging voltage probes, particularly given the release of such ions can modify the currents through ion channels. Indium phosphide III–V QDs have been suggested as more biocompatible cellular probes. Although arguably less developed than CdX nanoparticles, they display a similarly tunable array of PL and shape/size properties.42,43 Consequently, we repeated the measurements discussed above on InP/ZnS nanocrystals. A similar degree of PL quenching, with a maximum |ΔPL/PL| of ∼70%, is achieved in these materials on the application of fields ∼0.95 MV/cm. The PL peak blue-shifts (∼1.5 nm) on application of the field, Figure 2c (∼10 nm-thick film). In asymmetric QDs, based on the orientation of the QDs within the electric field, both blue and red shifting of the PL peak maximum has been observed.33 The InP/ZnS dots used in this work are tetrahedral in shape (as shown by TEM analysis, SI, S2) and hence such a response can be expected,33 resulting from the intrinsic dipole afforded by the asymmetric shape. However, the predominant observation of blue-shifts across different measurements and devices (SI, S8) suggests a preferential orientation of the QDs within the electric double layer; the exact origin of such behavior is beyond the scope of this work. The similar magnitude in |ΔPL/PL| response to CdSe/CdS dots suggests that InP/ZnS QDs are equally suitable as probes. In general, the InP/ZnS dots used here exhibited mild photobleaching under confocal excitation indicating that improved materials engineering, compared to the dots used here, may enhance material viability. Importantly we note that these bleaching effects take place over minutes which are significantly longer time scales than the duration of our experiments both on device and in live cells, which is on the order of seconds.
For a fixed applied voltage, |ΔPL/PL| could also be expected to vary with ion concentration. As the ion concentration decreases, the Debye screening length will increase, the potential will drop over a greater distance, and the overall field strength experienced by QDs will decrease. In Figure 2d we plot the PL change in CdSe/CdS QDs as a function of KNO3(aq) concentration at a constant applied voltage. Reducing the ion concentration from 1 M to 1 μM results in a decrease in |ΔPL/PL| from 45% to 10%. In mammalian cells, the intracellular ion concentrations typically range from 10–6 M to 10–2 M, and hence the results here confirm QDs are viable as voltage sensors within the biological concentration limit.39,44 We note the exact manner and mechanism by which the ion concentration affects the electric field experienced by QDs is beyond the scope of this work. It could be for instance that varying the ion concentration alters the proportion of charged dots, which has been suggested to contribute to PL quenching;28 additional work is required to fully understand this. A final important characterization of the device is the effect of applying an AC voltage. In Figure 2e, we plot the PL response of CdSe/CdS, InP/ZnS dots as well as a perylene diimide dye (similar structure to that used for commercial voltage sensing; drop cast on device) on application of a 1 Hz (sinusoidal) voltage waveform. In all cases, the PL response mirrors the voltage waveform with no observable lagging and the largest |ΔPL/PL| response being for CdSe/CdS dots. Subsequent measurements show the devices allow for voltage/PL cycling at up to 20 Hz (SI, S9). Beyond this frequency, no response can be recorded because the cycling time is comparable to the RC (charging) time of the chip. Our device hence measures at the lower range of frequencies that would be expected for neuronal voltage changes.45 For any PL-based voltage sensing moiety, the theoretical fastest response time to a field will be governed by the balance of the PL lifetime and the time taken for the electronic states or structure to respond to the presence of a field. For CdSe/CdS QDs the PL lifetime is ∼9 ns. Given in steady-state PL we observe a field induced quenching of the emission, the time taken for the electronic bands to reorganize to the presence of a field must be below this. In organic dyes, the PL lifetime is typically much shorter ∼10–100 ps, which is much closer to the time scale taken for structural, if not electronic rearrangements of the molecules to a field. Hence much more care must be taken in designing a voltage reporting dye.
As the photon (live imaging) gradually replaces the electron (patch clamp) for probing neuronal voltage, challenges still remain with regard to the detection of local (submicrometer) voltage changes and subthreshold events which involve small changes in membrane potential. Although the effectiveness of QDs in responding to an electric field has been demonstrated numerous times (including above), few studies have investigated whether these effects can be translated to quantitative imaging of membrane potential in neurons. Hence, in order to first evaluate whether the PL of QDs responds to a voltage change in live cells, and how the precision/magnitude compares to established techniques like patch clamp, measurements were performed on RGC axons derived from Xenopus laevis eye primordia (embryonic frog eyes). CdSe/CdS or InP/ZnS QDs were injected into early embryonic cells that give rise to the central nervous system (see Experimental Methods), with differentiated neurons later on cultured, and depolarization of the neuronal membrane induced via osmotic shock. PL from QDs within the primary neurons was then detected using a similar setup to that as on chip, with focused excitation/collection (Figure 3a). It should be noted the exact localization of QDs within the neuronal cells is unknown, that is, although the QDs are small enough to sit in the membrane, it cannot be said definitively whether they reside therein or elsewhere within the cell. The neuronal membrane of Xenopus RGCs has a resting voltage of ∼ –70 mV, which rapidly drops in magnitude (i.e., toward 0 mV) after osmotic shock, followed by recovery or cell death (Figure 3a). Because the depolarization of a cell corresponds to a decrease in the electric field experienced by QDs (by around 0.9 MV/cm46,47), their brightness should increase during a depolarization event; this is important as it allows us to distinguish membrane depolarization from any bleaching or blinking effects of the dots which would show a decrease in PL intensity over time.
Figure 3.

PL response of QDs in live Xenopus laevis retinal ganglion cell axons to cell depolarization. (a) Cartoon schematic of the setup, showing neurons illuminated with a 532 nm laser with PL from the QDs imaged in reflection. Stimulated membrane depolarization via osmotic shock causes a drop in the intracellular field, resulting in an increase in the PL. (b) Example traces of QD PL following depolarization under various conditions (top left): CdSe/CdS QDs loaded at 0.5 mg/mL into the embryo show a sharp 66% increase in PL on depolarization. In other cases, the PL increase is smaller (32% for CdSe loaded at 0.1 mg/mL into the embryo). InP/ZnS QDs loaded at 0.5 mg/mL into the embryo show a sharp ∼11% increase in PL on depolarization. QDs also respond to depolarization created by addition of potassium gluconate. The weak oscillations in PL that can be seen after the initial sharp PL change may correspond to additional depolarization events. We note that the laser power and spectrometer acquisition time were varied between experiments, explaining the difference in noise and absolute counts (see Experimental Methods for further discussion).
Figure 3b(i–iv) shows example traces of the PL response of CdSe/CdS and InP/ZnS dots upon depolarization of the cell membrane. Depolarization is achieved either via addition of water or potassium gluconate to the cell media, and the PL monitored throughout. Figure 3b demonstrates the typical response of cells containing CdSe/CdS QDs following addition of H2O. Initially the PL intensity rapidly increases, with typically two or three peaks in the response. Following the shock, the PL intensity seems to drop off slowly; this is consistent with axons having been damaged by the shock, which sometimes eventually leads to cell death, or recovering and re-establishing the membrane potential. Due to experimental factors, it is difficult to say whether any of the cells might have equilibrated to a steady-state membrane potential value above the preshock value. In Figure 3b(i), we show a typical trace of the neuronal depolarization (embryo initially injected with a total of 10 nL of 0.5 mg/mL QDs) following an osmotic shock. The ΔPL/PL response is large at ∼70%, and comparing this value with Figure 2b shows that, in the absence of other factors (see below), this corresponds to field change of ∼0.9 MV/cm experienced by the dots. Analyzing previous literature studies,48 where patch clamping was performed on comparable cells, suggests this to be a reasonable value for the field change on cell depolarization, demonstrating the platform developed has potential as a calibration tool for voltage indicators (see SI, Sections S10 and S11 for further analysis).
However, there is a large variation in the PL changes observed during cell depolarization, depending on the exact sample location (i.e., collection of neurons examined) and conditions examined within the focused excitation/detection scheme. For example, in Figure 3b(ii,iv), we show the PL response of cells depolarized via addition of H2O or potassium gluconate solution to the culture dish, respectively. In Figure 3b(ii), the CdSe/CdS QDs are loaded at a lower concentration into the embryos (10 nL of 0.1 mg/mL QDs at initial injection), compared to Figure 3b(i or iv) (10 nL of 0.5 mg/mL QDs at initial injection). In both cases the PL change is smaller (∼30%) as compared to that displayed in Figure 3b(i). This could be for a number of reasons such as aggregation/location of dots resulting in alteration of the Debye screening length across which the field drops and self-quenching of the emission, local changes in field that cannot be calibrated for, or multiple depolarizing neurons with different responses being within the excitation spot. Indeed, epifluorescence images of neurons tend to show that QDs are to some degree aggregated both when injected and cast on-top of the cells even after multiple washing steps (SI, SectionS12). This may result in the ΔPL measured being not purely related to field changes on depolarization, increasing the uncertainty on the field read-out. However, in general, these results highlight that although intraneuronal QDs do respond to neuronal membrane potential changes, single-point PL detection is not suitable for measuring quantitative changes in membrane potential as it is unable to distinguish each of these factors. Consequently, despite the high signal-to-noise ratio that can be achieved from this method, a wide-field illumination scheme, ideally on few dots, is necessary to produce quantitatively meaningful data. Repeating the measurements with InP/ZnS QDs produced similar results (Figure 3b(iii) with osmotic shock, resulting in rapid increase in the QD PL. For these QDs there is again poor agreement between the on-chip PL/voltage changes and those that might be expected from the simplest literature approximations of cell depolarization. This could be due to any of the aforementioned effects as well as orientation factors, resulting from differences in how these asymmetric dots sit within the membrane and on-chip. Finally, it is interesting to note that under depolarization by addition of potassium gluconate (Figure 3b(iv)) small oscillations (ΔPL < 5%) can be detected in the PL.46,49,50 The exact mechanism underlying these is unknown but shows that despite the calibration limitations, the PL response of QDs is bright enough to track these less-understood events (SI, S13).
The ultimate goal for any voltage indicator is to use it to assess and image local changes in membrane potential with high fidelity. Consequently, the above measurements were extended to a wide-field PL imaging scheme to overcome some of the limitations imposed by single point detection. QDs were injected on top of Xenopus RGC axons expressing a calcium indicator (jGCaMP7f), whose emission wavelength was at a different center frequency to that of the dots; any unattached QDs were removed by multiple washing cycles with culture media. It is important to note the GCaMP emission is not quenched by QDs (SI, S14). This is to be expected given the poor overlap between GCaMP emission and QD absorption as well as the relatively larger separation between QDs and dye >6 nm, that is, outside the radius required for emission quenching via long-range Förster energy transfer. GCaMP emission intensity increases with increasing calcium concentration; calcium influx is commonly used as a proxy for membrane potential which is possible due to the high density of voltage gated calcium channels in neuronal membranes.51 Although calcium dyes do not sense membrane potential in the same manner as QDs and are not fully quantitative in their response, the relative magnitude of changes in PL between these two sensors is an interesting comparison from an imaging viewpoint. Indeed, we have found by simultaneous imaging of membrane depolarization with GCaMP and a voltage sensing dye (from a FLIPR assay kit which has been previously used for measuring fast changes in membrane potential of neurons)52 that the GCaMP response is greater (SI, S16). These results are further supported by measurements similar to those reported in Figure 3 where the PL change of the VSD and QDs is monitored simultaneously on neuronal depolarization (SI, S16). Dual channel recording with wide-field epifluorescence excitation/detection was then used to monitor the PL response of both QDs and the dye to osmotic shock-induced membrane depolarization. Figure 4a shows a typical fluorescence image (in the dye emission channel). The white boxes mark the location of CdSe/CdS nanocrystals shown in the inset. As can be seen by the left panel (total QD PL over time) and inset images of the QDs, the local brightness of single (or a few) QDs can be tracked over time with the emission intensity closely tracking the calcium signal.
Figure 4.

Using QD voltage reporters to detect neuronal membrane depolarization with wide-field PL imaging. (a) CdSe/CdS QDs are injected on top of the RGC axons expressing a calcium indicator (jGCaMP7f). QDs remaining in suspension are removed by washing. The image (left panel) shows a wide-field PL image of neurons in the dye emission channel. Individual or few QDs are identified (white boxes; SI, S15) and their PL intensity tracked over time (central panel). As the neuronal membrane potential changes, the total QD PL initially increases before dropping following cell death or repolarization (right panel; integrated over all identified QDs). t0 shows the intensity of QDs before addition of H2O, t1 on cell depolarization, and t2 following cell death/repolarization (b, i–iv). The PL of individual QDs (red) and the dye (black) can be simultaneously tracked in the locations marked. The PL changes are correlated between the two emission channels allowing them to be distinguished from blinking/bleaching events. The magnitude of PL increase on depolarization is typically larger for QDs compared to the dye, as indicated by the arrows.
To assess whether the QDs can track the local changes in membrane voltage, we plot in Figure 4b the PL intensity as a function of time for both the QDs and the calcium indicator dye at the locations marked by the white boxes (see SI, S15 for details of data analysis which accounts for any movement, differences in the focal plane, and detachment etc.). In each case, strong correlation (insets) is observed between dot and dye intensity, allowing us to separate informative PL changes from random blinking events. Indeed, dots not attached to neurons show only small random PL fluctuations. Importantly, the change in QD PL (ΔPL) is consistently larger (between ∼5 and 60% greater) than that of the calcium dye. This indicates the QDs have an improved sensitivity to neuronal membrane changes as compared to measuring the fluorescence intensity of a calcium indicator dye (i.e., a proxy voltage sensing dye). This is critical, as in the wide-field scheme, detected changes in PL are significantly smaller compared to focused excitation/collection, and depolarization events, especially those which are subthreshold and close to the noise level, require a highly sensitive response. In terms of obtaining quantitative values for the corresponding field change in the wide-field scheme, factors relating to dot aggregation and multiple overlapping neurons can be somewhat disregarded as single or few QDs are being imaged. Furthermore, given that CdSe/CdS QDs are approximately spherically symmetric, orientation effects should also play a negligible role. Consequently, comparing the PL change in each trace with the plot obtained in Figure 2b allows us to at least semiquantitatively track the local field during depolarization. For example, the ∼40% PL change in Figure 4b(i) should correspond to a field change of ∼0.8 MV/cm, whereas the ∼20% PL changes in Figure 4b(iv) represent fields closer to 0.6 MV/cm. These values should however again be treated with extreme caution as the actual location and proximity of dots to the cell membrane are unknown. Given the relatively large PL/field changes, we speculate the dots may be close to the lipid headgroups,48 but our results show that it is not necessary to have QDs localized within the cell membrane to observe a voltage-dependent PL change. In the future, simultaneously imaging QDs while performing patch clamp electrophysiology measurements is required to make a quantitative link between these results, but in light of the aforementioned limitations (overlapping neurons, aggregation of dots, etc.; see above) removed by the wide-field detection scheme, the results in Figure 4 can be seen as a step toward quantitatively using QD voltage reporters. It should be noted that patch-clamp electrophysiology of RCG axons has never been performed because the axons have diameters of only few hundred nanometers, again highlighting a case where an alternate probe for the quantitative read-out of membrane potential is required. The above experiments were repeated with InP/ZnS QDs, but their lower brightness and fast photobleaching precluded a full assessment of their response, further highlighting the need for improved materials engineering (see SI, S17 for results). However, in general, the improved sensitivity offered by QDs in a wide-field imaging scheme as compared to dyes traditionally used for monitoring neuronal activity highlights their promise for tracking localized voltage changes. Comparing experimental values with the calibrated PL changes on the device also provides a method for making this tracking quantitative. Adding a thicker shell to suppress blinking, anchoring ligands to target particular binding sites, and reducing aggregation to improve the distribution of the dots are relatively simple modifications that could improve the reliability of the field values even further. The success of calcium dyes should not be understated, however, particularly in terms of their speed and ability to localize to particular organelles.13,20,53,54 Indeed, by calibrating with patch-clamp electrophysiology, these moieties can even be used as quantitative sesnors.55,56 In the above we have focused on only one part of a neuronal firing event, namely membrane depolarization. However, there are several other critical processes that make up a full action potential such as hyperpolarization, where the membrane potential drops below the resting potential. In theory the QD PL should also be sensitive to this process and hence could complement calcium or any other VSDs. This is further emphasized by our experiments (SI, S16) which show the signals from these two moieties do not appear to interfere with one another. For example, in RGC axons, hyperpolarization will involve a change in membrane potential from −65 mV to −80 mV, which is an effective field change of ∼0.2 MV/cm. Based on the curve in Figure 2b, this should result in a ∼25% change in the PL.
A final important consideration that must be made when selecting a voltage reporter is its effect on the biological system. An ideal moiety should not only be efficient in tracking voltage changes but also benign in its physiological interactions. A fully quantitative physiological study of the effect of the QDs injected as voltage reports is beyond the scope of this work; instead observational measurements were made during embryo development, up to the stage at which neurons were extracted and dissected. Embryos injected with CdSe/CdS nanoparticles show stunted growth, often a significant curvature of the spine (spinal lordosis), and underdeveloped eyes (SI, S18). In addition, they can also display multiple eyes, tails, and heads, likely due to leaching of Cd2+ ions which are well documented to have mutagenic effects on aquatic organisms. In contrast, embryos injected with InP/ZnS QDs consistently appear well-developed and healthy, with no such disfigurement and are indistinguishable from untreated embryos. Consequently, if the photobrightness and photostability issues with these systems can be resolved, they present themselves as better voltage indicators from a physiological standpoint. It should be noted that work by Kirchner et al. has extensively explored the role of coatings on CdSe-based QD cytotoxicity.40 In this work it was found adding a ZnS shell to QD surface mitigated leaching of Cd2+ ions. In the absence of this shell, polymeric ligands were found to be better at preventing Cd2+ leaching as compared to traditional acid ligands such as MPA. This study also concluded that the cytoxcity of ingested QDs was much higher than those sitting on the cell surface (at concentrations below which particles precipitated). This is an important point for our work where we have shown that QDs need not necessarily be located in the cell membrane to act as voltage reporters. Future studies should focus on the effect of these coatings which have also been noted to be highly sensitive to the specific cells, etc.40
Conclusion
In summary, we have developed a device for the evaluation of cellular voltage sensors in aqueous ionic environments. We have shown that the PL/voltage responses on-chip can match those observed in live cells (from literature electrophysiology measurements) with a single-point focused excitation/collection detection scheme. However, factors relating to QD aggregation, multiple neuronal events, etc., make this method generally unreliable. Using a wide-field imaging modality allows us to remove many of these limiting factors and begin to improve reliability and track local changes in the electrical field in a semiquantitative manner. Importantly, we demonstrate the sensitivity of QDs to membrane depolarization can be greater (up to twice as large) as compared to state-of-the-art calcium-based voltage imaging dyes, suggesting they have promise for complementing the tracking of electrical events. Our results, demonstrating the PL response of QDs injected on-top of depolarizing RGC cells, suggest it is not necessarily required to localize QDs to the cell membrane to use them as voltage sensors.
We specifically focused on the voltage response of colloidal QDs, but as shown by measurements on an organic dye, the platform can also be used to assess the efficacy of other voltage sensing probes. The charging times of the device limit its ability to assess “fast” (submillisecond) voltage changes, and hence further work is required, either via improved device/fabrication, for example, charge transfer blocking layer with higher dielectric constant, or by monitoring an alternate probe, for example, fluorescence lifetime or intermittency rates. Although their increased brightness and photostability makes CdX nanocrystals good voltage sensors, especially at high membrane voltages where QD PL is dim, InP-based QDs appear to have great potential due to their low cytotoxicity.
Further computational and electrophysiology studies must be performed to improve the quantitative readout between PL intensities and electric field, both on chip and in cells. The former could aid with determining the exact nature of the electric field, for example, the orientation of ions around QDs. Performing simultaneous patch clamping experiments, while measuring the PL change of QDs during a neuronal depolarization event, will assist in understanding factors limiting precise measurement of the field change.57 These experiments could also be combined with rapid-scanning video microscopy or techniques such as light-sheet microscopy to further enhance sensitivity. However, in general, as demonstrated by our work, the outlook for QD voltage sensing is bright. Improved engineering of these materials will not only allow for imaging of large neuronal networks, to better understand the central nervous system and tackle a raft of neurological diseases, but also aid with identification of signaling pathways in eukaryotic organisms and bacteria to design better medicines.
Experimental Methods
Device Preparation
ITO slides (0.17 mm thickness, 8–12 Ω/□ resistance; Diamond Coatings) were precleaned with acetone and isopropanol and then plasma treated for 10 min in O2 plasma. E-beam deposition of Ta2O5 in pellet form (Kurt J Lesker) was then performed in a home-built system (deposition parameters, 5 kV, 70 mA) The deposition rate was held constant at 0.1 nm/min. Tooling calibration was performed via witness ellipsometry of silicon wafers coated with varying thicknesses of Ta2O5. An aluminum mask was placed atop of the slides to control the exact patterning. Silver wire (0.125 mm diameter) was contacted to the device using silver DAG. Diluted solutions of QDs were then deposited onto the chips via drop casting. Any residual dots were removed by washing with appropriate solvent.
QD Synthesis
CdSe/CdS core–shell nanocrystals were synthesized similarly to the method of Bae et al.58 In short, CdO (0.128 g, 1 mmol), oleic acid (1.26 mL), and 1-octadecene (20 mL) were degassed under vacuum at 110 °C for 30 min. The vessel was switched to N2 and heated to 300 °C to form a colorless solution. A 1 M solution of Se in trioctylphosphine was prepared in the glovebox and injected (0.25 mL) into the Cd solution at 300 °C. After 90 s, 1-dodecanethiol (180 μL) was added dropwise, and the reaction was maintained at 300 °C for 30 min. The reaction was quenched by cooling to room temperature, and the product isolated by repeated precipitation and centrifugation with ethanol and resuspension in toluene. ZnS shelling was performed according to the method of Dethelfsen et al.59
InP/ZnS core–shell nanocrystals were synthesized according to the method of Kim et al.60 A typical synthesis is as follows: InCl3 (0.24 g, 1 mmol) and oleylamine (5 mL) was degassed under vacuum at 140 °C for 1 h. The solution was switched to N2 and heated to 180 °C for injection. Tris(dimethylamino)phosphine (0.18 mL) in oleylamine (0.5 mL) was quickly injected into the solution and maintained for 15 min. The reaction was quenched by cooling to room temperature, and the product was isolated by repeated precipitation and resuspension with acetone and hexane, respectively, and stored in the glovebox. For growth of ZnS shells, ZnCl2 (0.27 g, 2 mmol) and oleylamine (2 mL) and 1-octadecene (5 mL) were degassed at 120 °C under vacuum. The vessel was switched to N2 and heated to 200 °C until all solid had dissolved. The solution was cooled to room temperature, and a solution of InP cores (20 mg/mL, 3 mL) was injected, then degassed under vacuum. The vessel was again switched to N2 and heated to 140 °C, whereupon 1-dodecanethiol (0.48 mL, 2 mmol) was added dropwise. The reaction was heated to 250 °C for 1 h to facilitate shell growth before cooling to room temperature. The finished product was isolated by repeated precipitation and centrifugation in acetone and resuspension in hexane.
Ligand exchange of nanocrystals with pyridine was performed with the addition of an equal volume of pyridine to a 20 mg/mL solution of nanocrystals in a glovebox and left at room temperature for 10 min. Acetone was added to precipitate the exchanged dots followed by centrifugation at 4000 rpm. The supernatant was discarded, and the dots were resuspended in toluene.
Confocal PL Microscopy
An inverted microscope setup is used with an objective (Olympus ACHN 40XP) focusing a 532 nm laser (Laser Quantum Gem, CW, 532 nm, 100 mW) onto the sample. The reflected light is separated using a dichroic mirror (Semrock 532 nm RazorEdge), filtered using an edge filter (Semrock 532 nm EdgeBasic), and the resulting spectra measured (Ocean Optics, Ventanna 532 nm)
Cross-Section Transmission Electron Microscopy
A lamella for transmission electron microscopy (TEM) analysis was extracted from the device using a focused ion beam (FIB). Prior to extraction, protective layers of carbon and platinum were deposited on the active surface. A cross-section was then milled out, lifted off the device surface, and fixed on a TEM-compatible mount. After thinning down to electron transparency (<200 nm of thickness), the lamella was characterized in a FEI Tecnai Osiris S/TEM (scanning transmission electron microscope), operated at 200 kV. The microscope was used to acquire bright-field TEM images and STEM-energy-dispersive x-ray spectroscopy (EDX) elemental maps. The EDX setup consisted of a Bruker Super-X system, with 4 detectors arranged around the sample, with a total coverage of 0.9 sr. Data were processed in Hyperspy, an open-source python-based toolkit for electron microscopy data analysis.
Cell Culture and Dissection
All animal experiments for this paper were conducted in accordance with the Ethical Review Committee of the University of Cambridge and United Kingdom Home Office Guidelines. Xenopus laevis embryos of mixed sex were obtained and fertilized in vitro, and embryos were kept at 14–18 °C. Embryos were dissected at stage 35/36, according to the Nieukoop and Faber Normal Table of Xenopus development (Nieukoop and Faber, 1958). Prior to dissection, embryos were anaesthetized in a 20% w/v tricaine methanesulfonate solution (MS222, pH 7.6–7.8, with 1× penicillin-streptomycin-amphotericin B (PSF, Lonza)) and transferred to a Sylgard 184-lined dish where they were immobilized with bent 0.2 mm dissecting pins. Whole eye primordia were then explanted and immediately transferred into Xenopus culture media (60% L-15 + 1× PSF, pH 7.6–7.8).
Eye primordia were placed, with the lenses facing up, onto glass-bottomed 35 mm diameter dishes (Ibidi or MatTek), which had been coated with 10 μg/mL of poly-d-lysine (PDL, MW 70–150 kDa, P6407) for 30 min, followed by 5 μg/mL of laminin (L2020) for 30 min. Cultures were grown overnight in a 20 °C cell culture incubator and used for imaging experiments the following day (∼20–25 h after plating).
Early imaging experiments were conducted in Live Cell Imaging Solution (LCIS, Thermo Fisher, A14291DJ). However, as survival seemed similar, later experiments were conducted in Xenopus culture media.
Injections
Four-cell stage Xenopus embryos were injected in both dorsal blastomeres with a solution of QDs and RNA, diluted in sterile water as previously described.61 Briefly, newly fertilized Xenopus embryos were washed in a solution of 2% w/v l-cysteine (pH 8.0, in 0.1× MBS, C7352) to remove jelly coats and subsequently allowed to develop to the four cell stage. Embryos for which the dorsal blastomeres could be easily distinguished were selected for injection and placed into a dish containing 4% w/v Ficoll PM400 solution (pH 7.5, with 1X PSF, F4375) with a plastic grid taped to the bottom to hold the embryos in place.
Glass capillary tubes (Harvard Apparatus, GC100FS-10) were pulled into needles and filled with the RNA/QD solution. Needles were loaded into a micromanipulator (Scientifica), manually broken with forceps, and injection time and pressure adjusted to result in a 5 nL droplet (Eppendorf FemtoJet 4i Microinjector 5252000021). Embryos were kept in Ficoll solution for 1–2 h at room temperature following injection, before being stored a 14–18 °C in 0.1X MBS.
Preparation of RNA for Injection
Capped and polyadenylated jGCaMP7f (referred to henceforth as GCaMP) RNA was prepared and injected at 2–3 ng/BM along with the QDs. The pGP-CMV-jGCaMP7f plasmid was a gift of Douglas Kim and GENIE Project (Addgene plasmid # 104483). Briefly, the GCaMP insert was subcloned into the PCS2+ vector using standard molecular biology techniques. Capped, polyadenylated RNA was made via in vitro transcription using the mMESSAGE mMACHINE SP6 Transcription Kit and Poly(A) Tailing Kit (ThermoFisher Scientific, AM 1340, AM 1450).
Fluorescence Imaging
Wide-field fluorescence imaging was conducted on a Leica DMI-8 microscope, using a 60× N.A. 1.4 oil immersion objective and captured with a sCMOS camera (Orca Flash 4.0, Hamamatsu photonics, Japan). QDs were imaged through a filter with 540–552 nm excitation, 560 nm dichroic, and 567–643 nm emission, and GCaMP though a filter with 450–490 nm excitation, 495 nm dichroic, and 500–550 nm emission. Imaging was performed at 20–21 °C.
Imaging for Morphology Photographs
Embryos were anesthetized in MS222 for the dissection. Enough fluid was removed so that the embryos remained basically stationary. Images were taken with a sCMOS camera (Zyla 4.2, Andor) through an upright stereomicroscope with an NA 0.125 objective (Zeiss AxioZoom.V16).
RGC Axon Depolarization
Depolarization of RGC cells was performed by addition of either H2O (Milli-Q) or potassium gluconate solution (Sigma) to glass-bottom dishes containing adherent RGC cultures.
Acknowledgments
We thank the Engineering and Physical Science Research Council (EPSRC, UK) and the Winton Program for the Physics of Sustainability for financial support. M.C. acknowledges funding from an EPSRC Doctoral Training Award (EP/L016087/1). M.C. thanks L. Dolby for assistance with graphics and figures. R.P. thanks M. Walker, E. Evans, D. Credington, and A. Cheminal (Cambridge) for assistance with initial experiments and invaluable discussions. In addition, we thank K. Mooslenher (Cambridge) for help with preparation of constructs for calcium imaging and N. Davis (Victoria University, New Zealand) for providing PDI dye samples.
Supporting Information Available
The Supporting Information is available free of charge on the ACS Publications website at DOI: 10.1021/acs.nanolett.9b03026.
Structural and electrical device characterization, COMSOL simulations of voltage drop, statistics of PL response on chip, control experiments evaluating PL response in H2O, results of AC voltage cycling, additional membrane depolarization experiments with single-point detection, identification of QDs within wide-field imaging of RGC axons, physiological observations of behavior of QDs on cells and embryos (PDF)
Author Contributions
∥ These authors contributed equally.
The authors declare no competing financial interest.
Supplementary Material
References
- Ainsworth M.; Lee S.; Cunningham M. O.; Traub R. D.; Kopell N. J.; Whittington M. A. Rates and Rhythms: A Synergistic View of Frequency and Temporal Coding in Neuronal Networks. Neuron 2012, 75 (4), 572–583. 10.1016/j.neuron.2012.08.004. [DOI] [PubMed] [Google Scholar]
- Schacter D. L. Understanding Implicit Memory: A Cognitive Neuroscience Approach. Am. Psychol. 1992, 47 (4), 559–569. 10.1037/0003-066X.47.4.559. [DOI] [PubMed] [Google Scholar]
- Bidaud I.; Mezghrani A.; Swayne L. A.; Monteil A.; Lory P. Voltage-Gated Calcium Channels in Genetic Diseases. Biochim. Biophys. Acta, Mol. Cell Res. 2006, 1763 (11), 1169–1174. 10.1016/j.bbamcr.2006.08.049. [DOI] [PubMed] [Google Scholar]
- Simms B. A.; Zamponi G. W. Neuronal Voltage-Gated Calcium Channels: Structure, Function, and Dysfunction. Neuron 2014, 82 (1), 24–25. 10.1016/j.neuron.2014.03.016. [DOI] [PubMed] [Google Scholar]
- Homma R.; Baker B. J.; Jin L.; Garaschuk O.; Konnerth A.; Cohen L. B.; Bleau C. X.; Canepari M.; Djurisic M.; Zecevic D. Wide-Field and Two-Photon Imaging of Brain Activity with Voltage- and Calcium-Sensitive Dyes. Methods Mol. Biol. 2009, 489, 43. 10.1007/978-1-59745-543-5_3. [DOI] [PubMed] [Google Scholar]
- Loew L. M.Design and Use of Organic Voltage Sensitive Dyes. In Membrane Potential Imaging in the Nervous System and Heart; Springer: Cham, 2015. [Google Scholar]
- Gautam S. G. Exploration of Fluorescent Protein Voltage Probes Based on Circularly Permuted Fluorescent Proteins. Front. Neuroeng. 2009, 2 (14), 1–8. 10.3389/neuro.16.014.2009. [DOI] [PMC free article] [PubMed] [Google Scholar]
- Brinks D.; Klein A. J.; Cohen A. E. Two-Photon Lifetime Imaging of Voltage Indicating Proteins as a Probe of Absolute Membrane Voltage. Biophys. J. 2015, 109 (5), 914–921. 10.1016/j.bpj.2015.07.038. [DOI] [PMC free article] [PubMed] [Google Scholar]
- Chamberland S.; Yang H. H.; Pan M. M.; Evans S. W.; Guan S.; Chavarha M.; Yang Y.; Salesse C.; Wu H.; Wu J. C.; et al. Fast Two-Photon Imaging of Subcellular Voltage Dynamics in Neuronal Tissue with Genetically Encoded Indicators. eLife 2017, 6, e2569 10.7554/eLife.25690. [DOI] [PMC free article] [PubMed] [Google Scholar]
- Sung U.; Sepehri-Rad M.; Piao H. H.; Jin L.; Hughes T.; Cohen L. B.; Baker B. J. Developing Fast Fluorescent Protein Voltage Sensors by Optimizing FRET Interactions. PLoS One 2015, 10 (11), e0141585. 10.1371/journal.pone.0141585. [DOI] [PMC free article] [PubMed] [Google Scholar]
- Sung U.; Jin L.; Hughes T.; Cohen L. B.; Baker B. J.; Sepehri-Rad M. Improving Signal Dynamics of Fluorescent Protein Voltage Sensors by Optimizing FRET Interactions. Biophys. J. 2015, 108 (2), 152a. 10.1016/j.bpj.2014.11.838. [DOI] [PMC free article] [PubMed] [Google Scholar]
- Baker B. J.; Kosmidis E. K.; Vucinic D.; Falk C. X.; Cohen L. B.; Djurisic M.; Zecevic D. Imaging Brain Activity with Voltage- and Calcium-Sensitive Dyes. Cell. Mol. Neurobiol. 2005, 25 (2), 245–282. 10.1007/s10571-005-3059-6. [DOI] [PMC free article] [PubMed] [Google Scholar]
- Yan P.; Acker C. D.; Zhou W.-L.; Lee P.; Bollensdorff C.; Negrean A.; Lotti J.; Sacconi L.; Antic S. D.; Kohl P.; et al. Palette of Fluorinated Voltage-Sensitive Hemicyanine Dyes. Proc. Natl. Acad. Sci. U. S. A. 2012, 109 (50), 20443–20448. 10.1073/pnas.1214850109. [DOI] [PMC free article] [PubMed] [Google Scholar]
- Pritzl S. D.; Pschunder F.; Ehrat F.; Bhattacharyya S.; Lohmüller T.; Huergo M. A.; Feldmann J. Trans-Membrane Fluorescence Enhancement by Carbon Dots: Ionic Interactions and Energy Transfer. Nano Lett. 2019, 19 (6), 3886–3891. 10.1021/acs.nanolett.9b01071. [DOI] [PubMed] [Google Scholar]
- Nag O. K.; Stewart M. H.; Deschamps J. R.; Susumu K.; Oh E.; Tsytsarev V.; Tang Q.; Efros A. L.; Vaxenburg R.; Black B. J.; et al. Quantum Dot-Peptide-Fullerene Bioconjugates for Visualization of in Vitro and in Vivo Cellular Membrane Potential. ACS Nano 2017, 11 (6), 5598–5563. 10.1021/acsnano.7b00954. [DOI] [PMC free article] [PubMed] [Google Scholar]
- Hemmig E. A.; Fitzgerald C.; Maffeo C.; Hecker L.; Ochmann S. E.; Aksimentiev A.; Tinnefeld P.; Keyser U. F. Optical Voltage Sensing Using DNA Origami. Nano Lett. 2018, 18 (3), 1962–1971. 10.1021/acs.nanolett.7b05354. [DOI] [PMC free article] [PubMed] [Google Scholar]
- Zhang J.; Atay T.; Nurmikko A. V. Optical Detection of Brain Cell Activity Using Plasmonic Gold Nanoparticles. Nano Lett. 2009, 9 (2), 519–524. 10.1021/nl801891q. [DOI] [PubMed] [Google Scholar]
- Abdelfattah A. S.; Farhi S. L.; Zhao Y.; Brinks D.; Zou P.; Ruangkittisakul A.; Platisa J.; Pieribone V. A.; Ballanyi K.; Cohen A. E.; et al. A Bright and Fast Red Fluorescent Protein Voltage Indicator That Reports Neuronal Activity in Organotypic Brain Slices. J. Neurosci. 2016, 36 (8), 2458–2472. 10.1523/JNEUROSCI.3484-15.2016. [DOI] [PMC free article] [PubMed] [Google Scholar]
- Jin L.; Han Z.; Platisa J.; Wooltorton J. R. A.; Cohen L. B.; Pieribone V. A. Single Action Potentials and Subthreshold Electrical Events Imaged in Neurons with a Fluorescent Protein Voltage Probe. Neuron 2012, 75 (5), 779–785. 10.1016/j.neuron.2012.06.040. [DOI] [PMC free article] [PubMed] [Google Scholar]
- Storace D.; Sepehri Rad M.; Kang B. E.; Cohen L. B.; Hughes T.; Baker B. J. Toward Better Genetically Encoded Sensors of Membrane Potential. Trends Neurosci. 2016, 39 (5), 277–289. 10.1016/j.tins.2016.02.005. [DOI] [PMC free article] [PubMed] [Google Scholar]
- Sakmann B.; Neher E. Patch Clamp Techniques for Studying Ionic Channels in Excitable Membranes. Annu. Rev. Physiol. 1984, 46, 455–472. 10.1146/annurev.ph.46.030184.002323. [DOI] [PubMed] [Google Scholar]
- St-Pierre F.; Marshall J. D.; Yang Y.; Gong Y.; Schnitzer M. J.; Lin M. Z. High-Fidelity Optical Reporting of Neuronal Electrical Activity with an Ultrafast Fluorescent Voltage Sensor. Nat. Neurosci. 2014, 17, 884–889. 10.1038/nn.3709. [DOI] [PMC free article] [PubMed] [Google Scholar]
- Efros A. L.; Delehanty J. B.; Huston A. L.; Medintz I. L.; Barbic M.; Harris T. D. Evaluating the Potential of Using Quantum Dots for Monitoring Electrical Signals in Neurons. Nat. Nanotechnol. 2018, 13, 278–288. 10.1038/s41565-018-0107-1. [DOI] [PubMed] [Google Scholar]
- Bezanilla F. The Voltage Sensor in Voltage-Dependent Ion Channels. Physiol. Rev. 2000, 80 (2), 555–592. 10.1152/physrev.2000.80.2.555. [DOI] [PubMed] [Google Scholar]
- Kulkarni R. U.; Kramer D. J.; Pourmandi N.; Karbasi K.; Bateup H. S.; Miller E. W. Voltage-Sensitive Rhodol with Enhanced Two-Photon Brightness. Proc. Natl. Acad. Sci. U. S. A. 2017, 114 (11), 2813–2818. 10.1073/pnas.1610791114. [DOI] [PMC free article] [PubMed] [Google Scholar]
- Kulkarni R. U.; Vandenberghe M.; Thunemann M.; James F.; Andreassen O. A.; Djurovic S.; Devor A.; Miller E. W. In Vivo Two-Photon Voltage Imaging with Sulfonated Rhodamine Dyes. ACS Cent. Sci. 2018, 4 (10), 1371–1378. 10.1021/acscentsci.8b00422. [DOI] [PMC free article] [PubMed] [Google Scholar]
- Mahler B.; Spinicelli P.; Buil S.; Quelin X.; Hermier J. P.; Dubertret B. Towards Non-Blinking Colloidal Quantum Dots. Nat. Mater. 2008, 7, 659–664. 10.1038/nmat2222. [DOI] [PubMed] [Google Scholar]
- Rowland C. E.; Susumu K.; Stewart M. H.; Oh E.; Mäkinen A. J.; O’Shaughnessy T. J.; Kushto G.; Wolak M. A.; Erickson J. S.; Efros A. L.; et al. Electric Field Modulation of Semiconductor Quantum Dot Photoluminescence: Insights into the Design of Robust Voltage-Sensitive Cellular Imaging Probes. Nano Lett. 2015, 15 (10), 6848–6854. 10.1021/acs.nanolett.5b02725. [DOI] [PubMed] [Google Scholar]
- Marshall J. D.; Schnitzer M. J. Optical Strategies for Sensing Neuronal Voltage Using Quantum Dots and Other Semiconductor Nanocrystals. ACS Nano 2013, 7 (5), 4601–4609. 10.1021/nn401410k. [DOI] [PMC free article] [PubMed] [Google Scholar]
- Park K.; Weiss S. Design Rules for Membrane-Embedded Voltage-Sensing Nanoparticles. Biophys. J. 2017, 112 (4), 703–713. 10.1016/j.bpj.2016.12.047. [DOI] [PMC free article] [PubMed] [Google Scholar]
- Park K.; Deutsch Z.; Li J. J.; Oron D.; Weiss S. Single Molecule Quantum-Confined Stark Effect Measurements of Semiconductor Nanoparticles at Room Temperature. ACS Nano 2012, 6 (11), 10013–10023. 10.1021/nn303719m. [DOI] [PMC free article] [PubMed] [Google Scholar]
- Park J.; Kuo Y.; Li J.; Huang Y.-L.; Miller E. W.; Weiss S. Improved Surface Functionalization and Characterization of Membrane Targeted Semiconductor Voltage Nanosensors. J. Phys. Chem. Lett. 2019, 10 (14), 3906–3913. 10.1021/acs.jpclett.9b01258. [DOI] [PubMed] [Google Scholar]
- Bar-Elli O.; Steinitz D.; Yang G.; Tenne R.; Ludwig A.; Kuo Y.; Triller A.; Weiss S.; Oron D. Rapid Voltage Sensing with Single Nanorods via the Quantum Confined Stark Effect. ACS Photonics 2018, 5 (7), 2860–2867. 10.1021/acsphotonics.8b00206. [DOI] [PMC free article] [PubMed] [Google Scholar]
- Bezanilla F. How Membrane Proteins Sense Voltage. Nat. Rev. Mol. Cell Biol. 2008, 9 (4), 323–332. 10.1038/nrm2376. [DOI] [PubMed] [Google Scholar]
- Mićić O. I.; Cheong H. M.; Fu H.; Zunger A.; Sprague J. R.; Mascarenhas A.; Nozik A. J. Size-Dependent Spectroscopy of InP Quantum Dots. J. Phys. Chem. B 1997, 101 (25), 4904–4912. 10.1021/jp9704731. [DOI] [Google Scholar]
- Chen G.; Zhang Y.; Peng Z.; Huang D.; Li C.; Wang Q. Glutathione-Capped Quantum Dots for Plasma Membrane Labeling and Membrane Potential Imaging. Nano Res. 2019, 12 (6), 1321–1326. 10.1007/s12274-019-2283-1. [DOI] [Google Scholar]
- Xu J.; Lavan D. A. Designing Artificial Cells to Harness the Biological Ion Concentration Gradient. Nat. Nanotechnol. 2008, 3, 666–670. 10.1038/nnano.2008.274. [DOI] [PMC free article] [PubMed] [Google Scholar]
- Debye P.; Hückel E. On the Theory of Electrolytes. I. Freezing Point Depression and Related Phenomena. Phys. Zeitschrift 1923, 24 (9), 185–206. [Google Scholar]
- Lodishet al. Molecular Cell. Biology, 4th ed.; W. H. Freeman & Co: New York, 2001. [Google Scholar]
- Kirchner C.; Liedl T.; Kudera S.; Pellegrino T.; Javier A. M.; Gaub H. E.; Stölzle S.; Fertig N.; Parak W. J. Cytotoxicity of Colloidal CdSe and CdSe/ZnS Nanoparticles. Nano Lett. 2005, 5 (2), 331–338. 10.1021/nl047996m. [DOI] [PubMed] [Google Scholar]
- Winnik F. M.; Maysinger D. Quantum Dot Cytotoxicity and Ways to Reduce It. Acc. Chem. Res. 2013, 46 (3), 672–680. 10.1021/ar3000585. [DOI] [PubMed] [Google Scholar]
- Bharali D. J.; Lucey D. W.; Jayakumar H.; Pudavar H. E.; Prasad P. N. Folate-Receptor-Mediated Delivery of InP Quantum Dots for Bioimaging Using Confocal and Two-Photon Microscopy. J. Am. Chem. Soc. 2005, 127 (32), 11364–11371. 10.1021/ja051455x. [DOI] [PubMed] [Google Scholar]
- Yong K. T.; Ding H.; Roy I.; Law W. C.; Bergey E. J.; Maitra A.; Prasad P. N. Imaging Pancreatic Cancer Using Bioconjugated Inp Quantum Dots. ACS Nano 2009, 3 (3), 502–510. 10.1021/nn8008933. [DOI] [PMC free article] [PubMed] [Google Scholar]
- Wang Q.; Smith C. Molecular Biology of the Cell (Fifth Edition). Biosci. Educ. 2008, 11, 1. 10.3108/beej.11.r4. [DOI] [Google Scholar]
- Plášek J.; Sigler K. Slow Fluorescent Indicators of Membrane Potential: A Survey of Different Approaches to Probe Response Analysis. J. Photochem. Photobiol., B 1996, 33 (2), 101–124. 10.1016/1011-1344(96)07283-1. [DOI] [PubMed] [Google Scholar]
- Stoney S. D. Mechanisms of Accommodation in Different Types of Frog Neurons. J. Gen. Physiol. 1969, 53 (2), 248–262. 10.1085/jgp.53.2.248. [DOI] [PMC free article] [PubMed] [Google Scholar]
- Cohen R.; Schmitt B. M.; Atlas D. Molecular Identification and Reconstitution of Depolarization-Induced Exocytosis Monitored by Membrane Capacitance. Biophys. J. 2005, 89 (6), 4364–4373. 10.1529/biophysj.105.064642. [DOI] [PMC free article] [PubMed] [Google Scholar]
- Warshaviak D. T.; Muellner M. J.; Chachisvilis M. Effect of Membrane Tension on the Electric Field and Dipole Potential of Lipid Bilayer Membrane. Biochim. Biophys. Acta, Biomembr. 2011, 1808 (10), 2608–2617. 10.1016/j.bbamem.2011.06.010. [DOI] [PMC free article] [PubMed] [Google Scholar]
- Hasenstaub A.; Shu Y.; Haider B.; Kraushaar U.; Duque A.; McCormick D. A. Inhibitory Postsynaptic Potentials Carry Synchronized Frequency Information in Active Cortical Networks. Neuron 2005, 47 (3), 423–435. 10.1016/j.neuron.2005.06.016. [DOI] [PubMed] [Google Scholar]
- Beraneck M.; Pfanzelt S.; Vassias I.; Rohregger M.; Vibert N.; Vidal P.-P.; Moore L. E.; Straka H. Differential Intrinsic Response Dynamics Determine Synaptic Signal Processing in Frog Vestibular Neurons. J. Neurosci. 2007, 27 (16), 4283–4296. 10.1523/JNEUROSCI.5232-06.2007. [DOI] [PMC free article] [PubMed] [Google Scholar]
- Preuss S.; Stein W. Comparison of Two Voltage-Sensitive Dyes and Their Suitability for Long-Term Imaging of Neuronal Activity. PLoS One 2013, 8 (10), e75678. 10.1371/journal.pone.0075678. [DOI] [PMC free article] [PubMed] [Google Scholar]
- Fairless R.; Beck A.; Kravchenko M.; Williams S. K.; Wissenbach U.; Diem R.; Cavalié A. Membrane Potential Measurements of Isolated Neurons Using a Voltage-Sensitive Dye. PLoS One 2013, 8 (3), e58260 10.1371/journal.pone.0058260. [DOI] [PMC free article] [PubMed] [Google Scholar]
- Tanabe T.; Takeshima H.; Mikami A.; Flockerzi V.; Takahashi H.; Kangawa K.; Kojima M.; Matsuo H.; Hirose T.; Numa S. Primary Structure of the Receptor for Calcium Channel Blockers from Skeletal Muscle. Nature 1987, 328, 313. 10.1038/328313a0. [DOI] [PubMed] [Google Scholar]
- Grienberger C.; Konnerth A. Imaging Calcium in Neurons. Neuron 2012, 73, 862. 10.1016/j.neuron.2012.02.011. [DOI] [PubMed] [Google Scholar]
- Dana H.; Chen T. W.; Hu A.; Shields B. C.; Guo C.; Looger L. L.; Kim D. S.; Svoboda K. Thy1-GCaMP6 Transgenic Mice for Neuronal Population Imaging in Vivo. PLoS One 2014, 9, e108697. 10.1371/journal.pone.0108697. [DOI] [PMC free article] [PubMed] [Google Scholar]
- Muto A.; Ohkura M.; Kotani T.; Higashijima S. I.; Nakai J.; Kawakami K. Genetic Visualization with an Improved GCaMP Calcium Indicator Reveals Spatiotemporal Activation of the Spinal Motor Neurons in Zebrafish. Proc. Natl. Acad. Sci. U. S. A. 2011, 108, 5425. 10.1073/pnas.1000887108. [DOI] [PMC free article] [PubMed] [Google Scholar]
- Reeve J. E.; Corbett A. D.; Boczarow I.; Kaluza W.; Barford W.; Bayley H.; Wilson T.; Anderson H. L. Porphyrins for Probing Electrical Potential across Lipid Bilayer Membranes by Second Harmonic Generation. Angew. Chem., Int. Ed. 2013, 52, 9044–9048. 10.1002/anie.201304515. [DOI] [PMC free article] [PubMed] [Google Scholar]
- Bae W. K.; Lim J.; Lee D.; Park M.; Lee H.; Kwak J.; Char K.; Lee C.; Lee S. R/G/B/Natural White Light Thin Colloidal Quantum Dot-Based Light-Emitting Devices. Adv. Mater. 2014, 26, 6387–6393. 10.1002/adma.201400139. [DOI] [PubMed] [Google Scholar]
- Dethlefsen J. R.; Døssing A. Preparation of a ZnS Shell on CdSe Quantum Dots Using a Single-Molecular ZnS Precursor. Nano Lett. 2011, 11 (5), 1964–1969. 10.1021/nl200211n. [DOI] [PubMed] [Google Scholar]
- Kim K.; Yoo D.; Choi H.; Tamang S.; Ko J.-H.; Kim S.; Kim Y.-H.; Jeong S. Halide-Amine Co-Passivated Indium Phosphide Colloidal Quantum Dots in Tetrahedral Shape. Angew. Chem., Int. Ed. 2016, 55 (11), 3714–3718. 10.1002/anie.201600289. [DOI] [PubMed] [Google Scholar]
- Leung K. M.; Van Horck F. P. G.; Lin A. C.; Allison R.; Standart N.; Holt C. E. Asymmetrical β-Actin MRNA Translation in Growth Cones Mediates Attractive Turning to Netrin-1. Nat. Neurosci. 2006, 9 (10), 1247–1256. 10.1038/nn1775. [DOI] [PMC free article] [PubMed] [Google Scholar]
Associated Data
This section collects any data citations, data availability statements, or supplementary materials included in this article.