Abstract
Upon infection of their host, temperate phages (viruses that infect bacteria) enter either a lytic or a lysogenic cycle. The former results in bacterial cell lysis and phage release (horizontal transmission), while lysogeny is characterized by integration of the phage in the host genome and dormancy (vertical transmission)1. Co-culture experiments of bacteria and temperate phage mutants, which are locked in the lytic cycle, have shown that CRISPR-Cas can efficiently eliminate the invading phages2,3. By contrast, here we show that when challenged with wild-type temperate phage that can become lysogenic, type I CRISPR-Cas immune systems are unable to eliminate these phages from the bacterial population. In fact, our data suggest that CRISPR-Cas immune systems are in this context maladaptive to the host due to severe immunopathological effects brought about by imperfect matching of spacers to integrated phage sequences (prophages). These fitness costs drive the loss of CRISPR-Cas from bacterial populations, unless the phage carries anti-CRISPR (acr) genes that suppress the immune system of the host. Using bioinformatics, we show that this imperfect targeting is likely to occur frequently in nature. These findings can help to explain the patchy distribution of CRISPR-Cas immune systems within and between bacterial species and highlight the strong selective benefits of phage-encoded acr genes for both the phage and host under these circumstances.
CRISPR-Cas (Clustered Regularly Interspaced Short Palindromic Repeats; CRISPR-associated) adaptive immune systems provide sequence-specific resistance against phage infections by inserting phage-derived sequences (spacers) of around 30 bp into CRISPR loci on the host genome4. Upon reinfection, CRISPR transcripts guide Cas proteins to destroy the matching target5. The uptake of new spacers is far more efficient if a pre-existing spacer has partial complementarity to the phage. This process, known as “priming”, is widespread in type I systems, and provides protection against phage mutants that overcome host resistance by point mutation of their target sites6,7. However, partially matching spacers can also cause immunopathological effects when temperate phages enter the lysogenic lifecycle, where the phage genome is integrated into that of the host and exists in a dormant state until it gets induced. Lysogeny is common but variable across bacterial genera8. During lysogeny, a primed CRISPR-Cas immune system may target the partially complementary site in the prophage, causing damage to both the phage and host DNA and resulting in induction of the SOS-response9. However, if and how these potentially negative effects impact the evolutionary and population dynamics of phage-bacteria interactions remains unclear, since these processes have only been studied in the context of virulent phages2,3.
Temperate phages persist despite CRISPR
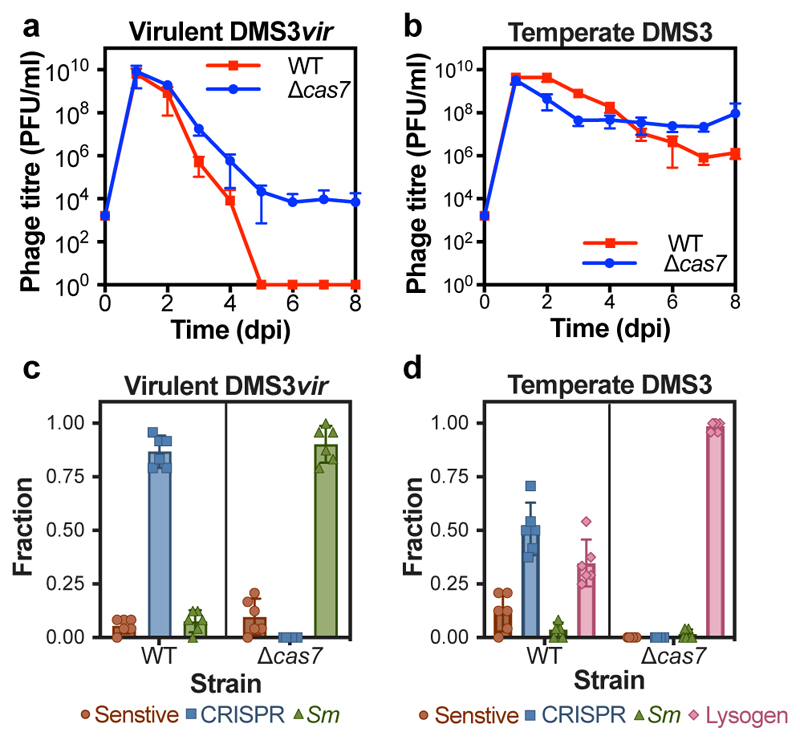
To explore this, we infected Pseudomonas aeruginosa PA14 with either the temperate phage DMS3 or the virulent mutant DMS3vir (a DMS3 mutant that is locked in the lytic cycle through mutation of the c-repressor gene) and monitored bacterial and phage population dynamics for 8 days. P. aeruginosa strain PA14 carries a type I-F CRISPR-Cas immune system, with spacer 1 of CRISPR array 2 having an imperfect match (5 mismatches) to gene 42 of DMS39,10. As previously reported3, DMS3vir was driven extinct by WT bacteria at 5 days post-infection (dpi) due to the evolution of CRISPR-based resistance, whereas a Δcas7 mutant - lacking a functional CRISPR-Cas system - evolved surface-based resistance that allowed for phage persistence (Fig. 1a-c). In contrast, both WT and Δcas7 bacteria were unable to clear wildtype DMS3 infections (Fig. 1b), suggesting that the ability to transmit vertically (i.e. lysogeny) is a critical determinant of temperate phage survival when bacteria encode CRISPR-Cas immune systems. To understand the evolutionary drivers of these population dynamics, we isolated bacterial clones from the DMS3-infected cultures at 3 dpi and quantified the proportion of lysogens and bacteria with CRISPR-based and surface-based resistance. This showed that CRISPR resistance evolution was significantly reduced in WT populations exposed to DMS3 compared to DMS3vir (Fig. 1c,d), and instead many WT bacteria carried the DMS3 prophage (Fig. 1d), which confers phage resistance through superinfection exclusion. However, lysogeny levels were reduced in WT hosts compared to the Δcas7 strain, which almost invariably carried the prophage (Fig. 1d).
Figure 1. Phage persistence and host resistance evolution upon virulent or temperate phage infections.
(a) Phage densities over time following infection of WT PA14 or the Δcas7 mutant with DMS3vir or (b) DMS3. The limit of phage detection is 200 PFU/ml. (c) Fraction of bacteria that had evolved resistance at 3 dpi following infection with phage DMS3vir or (d) DMS3, either through CRISPR-Cas (CRISPR), surface modification (sm) or lysogeny (Lysogen). Fractions are based on 24 random clones per replicate experiment. In all panels, data shown are the mean of 6 biologically independent replicates per treatment. Error bars represent 95% confidence intervals (c.i.).
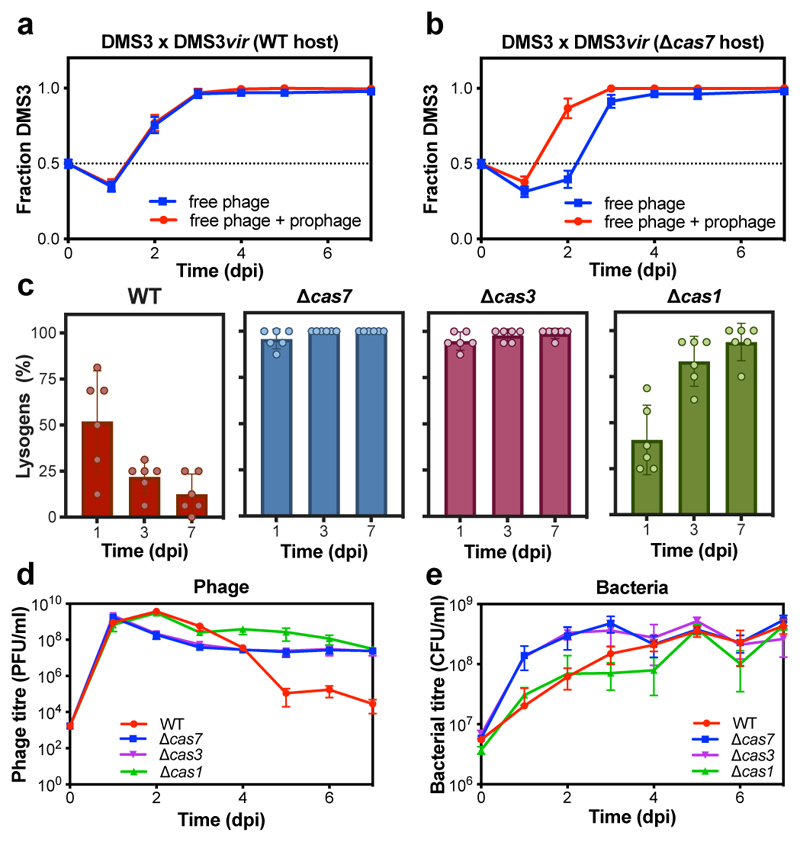
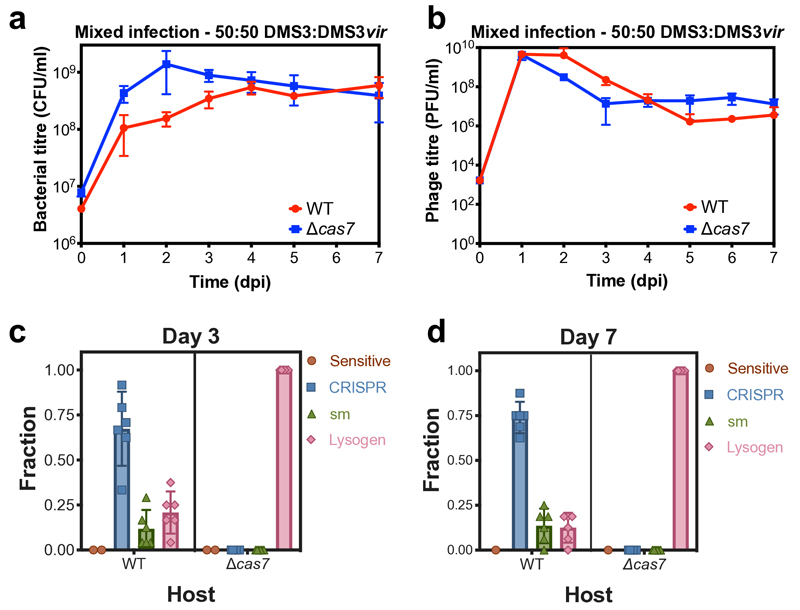
The difference in DMS3 and DMS3vir persistence could be due to either differences in host resistance evolution or the ability of DMS3 to transmit vertically while continuously releasing free phage particles through prophage induction. To distinguish between these possibilities, we infected WT and Δcas7 strains with an equal mix of DMS3 and DMS3vir and observed similar bacterial and phage population dynamics and resistance evolution to those during infection with temperate phage alone (Extended Data Fig. 1). Next, we examined how the relative frequencies of DMS3 and DMS3vir changed over time (Fig. 2a,b). Initially, DMS3vir outcompetes DMS3, consistent with the idea that high densities of sensitive hosts favour horizontal transmission (i.e. the lytic replication cycle)11. However, at later time points, all free phage particles belong to the DMS3 genotype. As the host population experienced by the two phage genotypes was identical, this demonstrates that vertical transmission facilitates the observed persistence of DMS3. Interestingly, persistence of free phages was facilitated despite low frequencies of lysogeny in WT compared to Δcas7 bacteria (Fig. 2a,b, compare blue and red lines, and Extended Data Fig. 1c,d).
Figure 2. The impact of CRISPR adaptation and interference on lysogeny and phage persistence.
(a) Relative frequency of DMS3 over time following infection of WT PA14 or (b) the Δcas7 mutant host with an equal mix of DMS3 and DMS3vir. Relative frequencies are shown both for the free and total (i.e. including lysogens) phage population. (c) Percentage of DMS3 lysogens in the host population at 1, 3, or 7 dpi of either the WT PA14 strain, the isogenic CRISPR-interference deficient mutants Δcas7 and Δcas3, or the isogenic CRISPR-adaptation deficient mutant Δcas1, based on 24 random clones per replicate experiment per time point. (d) DMS3 phage and (e) bacterial densities during this co-culture experiment. In all panels, data shown are the mean of 6 biologically independent replicates per treatment. Error bars represent 95% c.i.
Next, to understand why lysogen formation was depressed in WT compared to Δcas7 bacteria, we performed temporal sampling of DMS3-infected populations over 7 days. Interestingly, this revealed that lysogeny in WT bacteria was already depressed at 1 dpi and continued to decline until 7 dpi, whereas the proportion of lysogens in isogenic mutants with a defective CRISPR-interference pathway (Δcas3 and Δcas7 mutants) was high and constant during this same period (Fig. 2c). Crucially, the proportion of DMS3 lysogens at 1 dpi was also depressed in a Δcas1 mutant, which is unable to acquire novel spacers (adaptation) but is proficient in detecting and destroying complementary DNA (interference). However, in this background, the proportion of lysogens increased between 1 and 7 dpi to levels similar to the CRISPR-interference mutants (Fig. 2c). These data therefore suggest that WT and Δcas1 bacteria are partially resistant to DMS3 infection, even in the absence of spacer acquisition, resulting initially in fewer lysogens and further reductions if the hosts carry the genetic machinery to acquire additional spacers.
Mismatched spacers are maladaptive
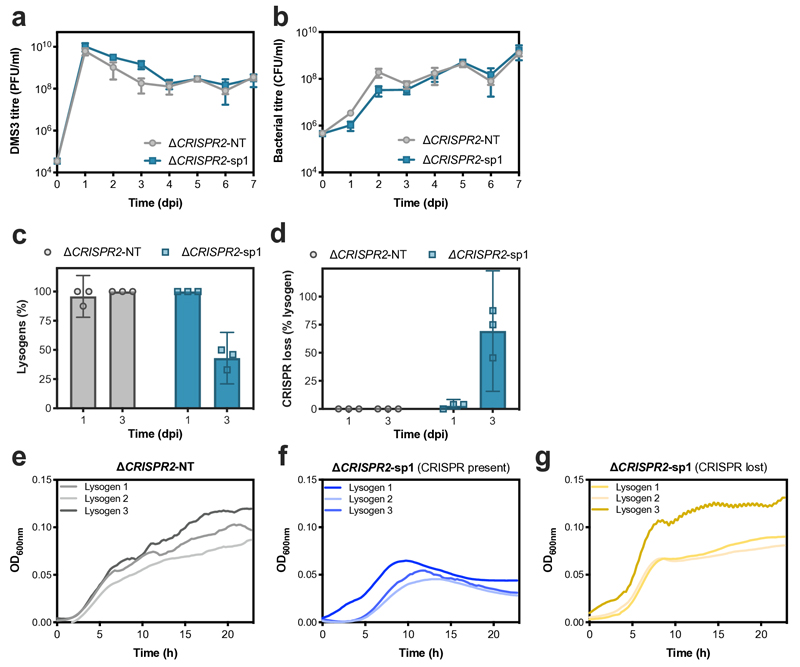
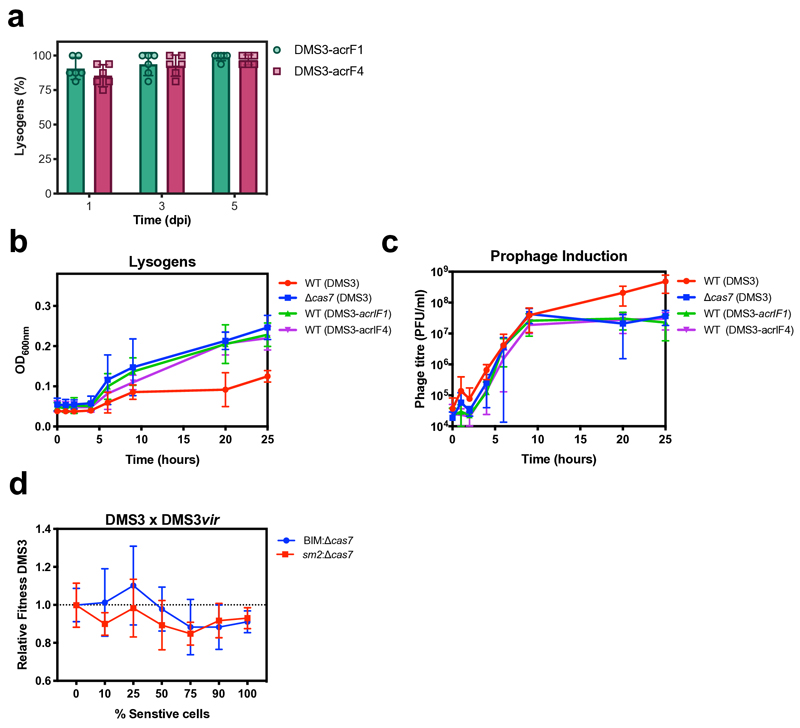
We hypothesized that the observed suppression of lysogeny in WT and Δcas1 backgrounds was dependent on the imperfect match (5 mismatches) between gene 42 of DMS3 and spacer 1 of CRISPR array 29,10. To test this, we infected a strain lacking CRISPR array 2 (ΔCRISPR2) with DMS3 and observed that plasmid-based expression of spacer 1 (ΔCRISPR2-sp1) led to similar population dynamics to those observed during infection of the wildtype strain (Extended Data Fig. 2a,b) and suppression of lysogeny (Extended Data Fig. 2c), while expression of a control non-targeting spacer (ΔCRISPR2-NT) did not. To further corroborate the hypothesis that the suppression of lysogeny was caused by partial CRISPR-Cas resistance, we performed infections with phages carrying anti-CRISPR genes (acr), which are widespread and diverse genes (currently classified into 45 families) carried by a range of different mobile genetic elements, that block CRISPR-interference12. As expected, infection of WT bacteria with a mutant phage DMS3 carrying either acrIF1 or acrIF4, both of which block the I-F CRISPR-Cas system of PA1413, showed similar lysogeny levels to those observed for interference-deficient mutants (Extended Data Fig. 3a).
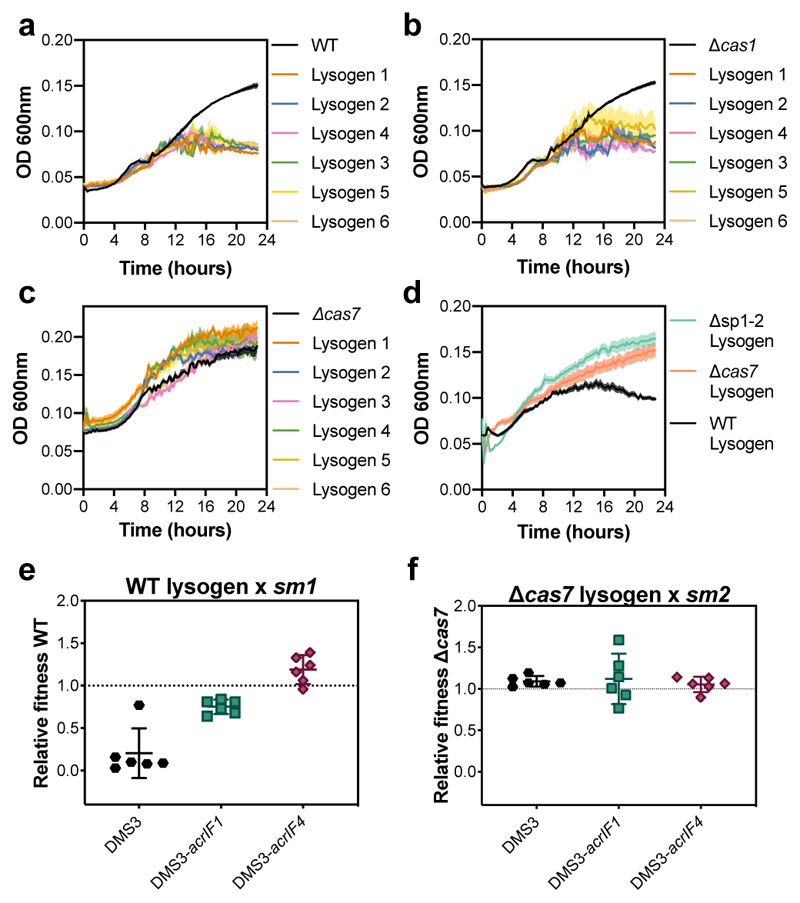
Intriguingly, although lysogen formation was reduced in WT and Δcas1 bacteria, the concentration of free phages was actually higher during the early stages of DMS3 infection of these hosts (Fig. 2d). This effect disappeared by 7 dpi - if bacteria were unable to acquire new spacers (Δcas1) - or inverted at 4 dpi if they had a functional CRISPR-Cas system (Fig. 2d). This also coincided with reduced bacterial densities of WT and Δcas1 populations compared to CRISPR-interference mutants during the early stages of the phage epidemic (Fig. 2e), suggesting that functional CRISPR-Cas immune systems may be maladaptive in this context. We speculated that the high DMS3 titres during early stages of infection of WT and Δcas1 bacteria (Fig. 2d and 1b) and the concurrent reduced bacterial densities could be due to interactions between the CRISPR interference machinery and the partially complementary prophage (i.e. autoimmunity), which can activate an SOS-response9 and which in turn may trigger prophage induction14. To test this, we isolated 6 independent DMS3 lysogens from WT, Δcas7 and Δcas1 backgrounds at 1 dpi. Growth measurements revealed significant fitness costs of lysogeny in WT and Δcas1 backgrounds, whereas growth of Δcas7 lysogens was unaffected (Fig. 3a-c). Growth of lysogens lacking spacers 1 and 2 of CRISPR 2 (Δsp1-2) or lacking the entire CRISPR 2 array (ΔCRISPR2-NT) was comparable to that of Δcas7 lysogens (Fig. 3d and Extended Data Fig. 2c), but restoring the expression of CRISPR 2 spacer 1 (ΔCRISPR2-sp1) resulted in a reduced growth rate (Extended Data Fig. 2d), confirming that this spacer is responsible for the reduced fitness of WT bacteria carrying the prophage. Competition of lysogens against bacteria with surface-based resistance confirmed a fitness cost of lysogeny in the WT, but not in the Δcas7 background (Fig. 3e,f, relative fitness<1, one-tailed Wilcoxon and t-tests, WT: df=5, p=0.016; Δcas7: t5=3.6551, p=0.99). This effect was reduced if the prophage possessed an acr gene (Fig. 3e, one-tailed t-test, acrIF1: t5=16.562, acrIF4: t5=14.805 and p<0.0001 in both cases), whereas acr genes had no effect on fitness of Δcas7 lysogens (Fig. 3f, ANOVA F2,15 =0.205, p=0.82).
Figure 3. Fitness of lysogens with an active CRISPR-Cas system is reduced unless they encode acr genes.
(a) 24-hour growth curves of uninfected control cultures, or 6 independent DMS3 lysogens in WT PA14, (b) Δcas1 (CRISPR-adaptation deficient), and (c) Δcas7 (CRISPR-interference deficient) genetic backgrounds. Lysogens were isolated from day 1 of the co-culture experiment shown in Fig. 2. Curves are the mean of 6 (a,b) or 4 (c) replicates and shaded areas represent standard error of the mean. (d) 24-hour mean growth curves of 6 lysogens in WT, Δcas7 and Δsp1-2 (carrying a deletion of CRISPR2 spacers 1 and 2) backgrounds isolated from 6 biological replicates. Each growth curve was performed in 5 technical replicates. Shaded areas represent standard error of the mean. (e) Fitness relative to a surface mutant (sm) of WT PA14 lysogens isolated 1 day post infection with DMS3 or (f) PA14 Δcas7 lysogens isolated 1 day post infection with DMS3. Relative fitness was determined after 1 day of competition. Each point represents the average relative fitness of one independent lysogen clone measured across 6 biologically independent experiments and error bars indicate 95% c.i.
Next, we estimated prophage induction levels in WT and Δcas7 lysogens. To this end, we pelleted bacterial cultures and washed away free phages, followed by resuspension in fresh medium, and monitored bacterial densities and free phage accumulation over 25 hours. While initial cell densities were similar for all strains, growth of WT cultures plateaued at a lower density (Extended Data Fig. 3b), yet they accumulated more phage particles compared to Δcas7 lysogens (Extended Data Fig. 3c), unless the prophage carried an acr gene. Taken together, these data support the hypothesis that, unless DMS3 encodes acr genes, CRISPR-Cas causes immunopathology during vertical transmission of the phage, which triggers prophage induction and hence explains the high free phage titres during the early infection stage.
These immunopathological effects may select for CRISPR mechanisms that selectively target phages during their lytic cycle, as has been described for type III systems15,16. However, competition between DMS3 and DMS3vir phages showed that the main determinant of their relative fitness is the proportion of sensitive bacteria in the population11 (Extended Data Fig. 3d, two-way ANOVA F6,83=3.1683, p=0.008) and is independent of whether resistance of bacteria in the population was CRISPR-based or surface-based (Extended Data Fig. 3d, F1,76=2.8923, p=0.09). This suggests that the type I CRISPR-Cas system of P. aeruginosa lacks the ability to distinguish between phages that enter lytic or lysogenic cycles.
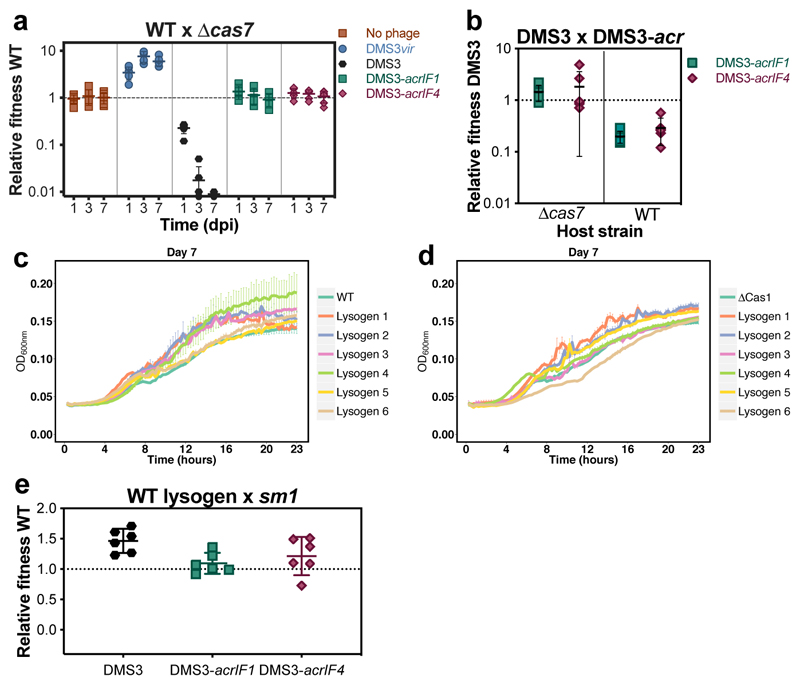
Given these opposing fitness effects of CRISPR-Cas immune systems during horizontal2,3, and vertical transmission of DMS3 (Fig. 3), it is unclear what the net fitness effects of CRISPR-Cas systems are during temperate phage infections. To explore this, we competed WT and Δcas7 strains in the presence of either DMS3vir, DMS3, DMS3-acrIF1 or DMS3-acrIF4 phages and determined their relative fitness at day 1, 3 and 7. Strikingly, while WT bacteria were fitter than Δcas7 in the presence of virulent phage (Fig. 4a, one-tailed Wilcoxon test, relative fitness>1; p=0.016), they were considerably less fit during temperate phage infection (Fig. 4a, relative fitness<1; p=0.018), unless the temperate phage carried acr genes (Fig. 4a, relative fitness ≠1; p=0.16). Hence, in this context acr genes not only provide a benefit to the phage during both horizontal3,17,18 and vertical transmission (Fig. 4b, one-tailed t-test: relative fitness ≠1, acrIF1; t5=39.30, p<0.0001; acrIF4; t5=11.61, p <0.0001), but also to the host by preventing autoimmunity.
Figure 4. Lysogens evolve to mitigate fitness costs.
(a) Relative fitness of WT during competition with Δcas7 hosts following infection with 104 PFU of either DMS3, the lytic mutant DMS3vir, or the anti-CRISPR-encoding mutants DMS3-acrIF1 and DMS3-acrIF4. (b) Relative fitness of DMS3 (free phages + lysogens) following 3 days of competition with DMS3-acrIF1 or DMS3-acrIF4 on either WT PA14 or Δcas7 mutant. (c) 24-hour growth curves of uninfected control cultures, or 6 biologically independent DMS3 lysogens in the WT PA14 or (d) Δcas1 genetic backgrounds, which were isolated from day 7 of the co-culture experiment shown in Fig. 2. Curves are the mean of 6 replicates and error bars represent standard error of the mean. (e) Relative fitness of a DMS3 lysogen in a WT PA14 genetic background, isolated from day 5 of a co-culture experiment, during competition with a surface mutant. Relative fitness was calculated after 1 day of competition. All panels show the mean of 6 biologically independent replicates per treatment. Error bars represent 95% c.i. (panels a,b and e) or standard error of the mean (panels c and d).
Bacteria evolve to lose CRISPR-Cas
We next monitored whether WT lysogens evolved to alleviate these autoimmunity costs through mutation of their immune system or the prophage. Lysogens in WT and adaptation-deficient Δcas1 backgrounds, which had reduced growth during early infection, were selected from the late infection stage (7 dpi). Growth curves revealed that the negative fitness consequences of CRISPR-Cas immune systems had disappeared in these “late lysogens”, and they now had growth rates comparable to ancestral hosts lacking the prophage (Fig. 4c,d, compare to Fig. 3a,b). A competition experiment confirmed this finding, showing that late lysogens in a WT background were fitter than a surface mutant (Fig. 4e, one-tailed t-test, relative fitness>1; t5=5.985, p<0.001), and the presence of acr genes in the prophage no longer increased the fitness of the host (Fig. 4e, one-tailed t-test: acrIF1; t5=-5.5085, p=1.00; acrIF4; t5=-2.0395, p=0.95) (compare to Fig. 3e).
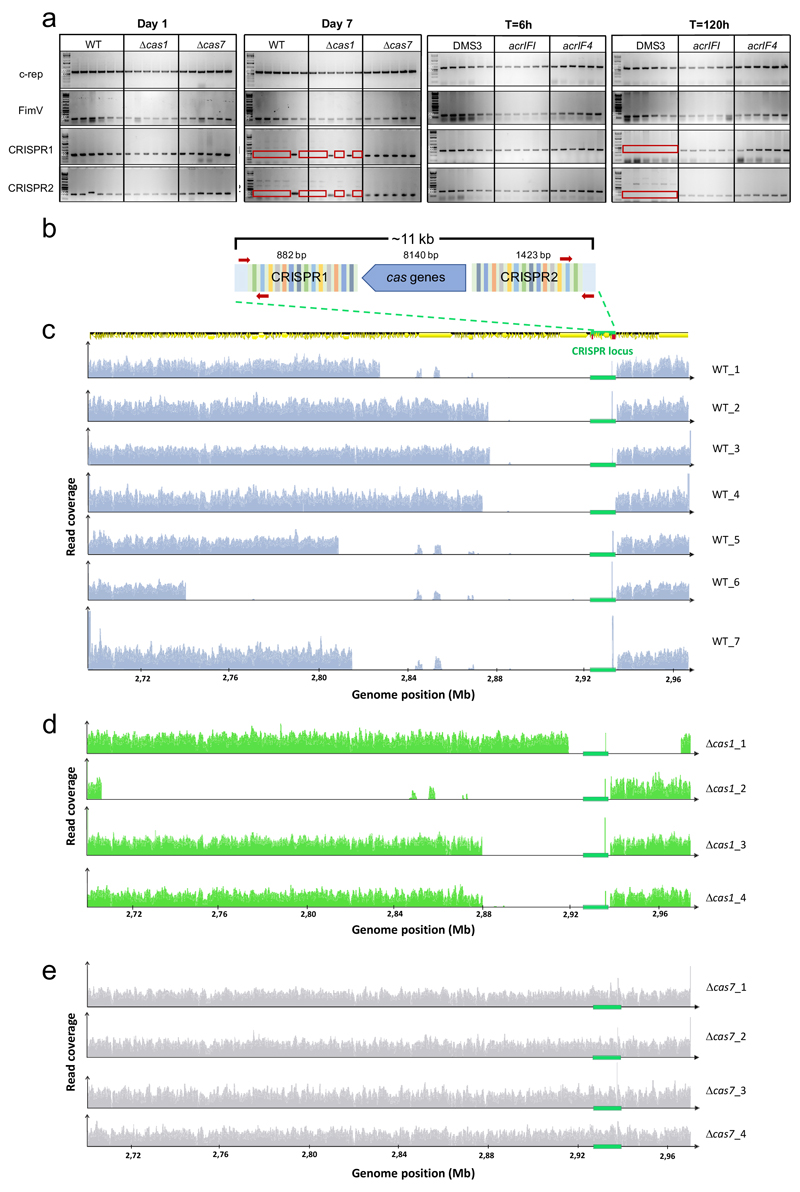
To understand the mechanistic basis for this alleviation in fitness costs, we performed PCR analyses of the CRISPR loci of 6 independent lysogens in WT, Δcas1 and Δcas7 backgrounds, isolated from early or late time points after infection. Both CRISPR loci (1 and 2) amplified as expected in early lysogens (Extended Data Fig. 4a), however, amplification failed in many late lysogens in WT and Δcas1 backgrounds (Extended Data Fig. 4a, negative PCR indicated by red frame), suggesting that the CRISPR-Cas locus was lost in these clones. Whole genome sequencing of late lysogens revealed large genomic deletions associated with prophage integration (between ~ 50 and 230 kb) that encompassed the entire CRISPR-Cas locus - but contained no essential gene19 - in WT and Δcas1 backgrounds, while the genome remained intact in Δcas7 late lysogens (Extended Data Fig. 4c-e and Extended Data Table 1). This loss of the CRISPR-Cas locus was clearly driven by the immunopathological effects of CRISPR 2 spacer 1, as the locus was maintained in lysogens lacking CRISPR 2 (ΔCRISPR2) but lost when expression of spacer 1 was restored (ΔCRISPR2-sp1) (Extended Data Fig. 2b). The loss of CRISPR-Cas was also avoided when WT bacteria were lysogenized by DMS3 carrying acr genes (Extended Data Fig. 4a).
Generality of the empirical data
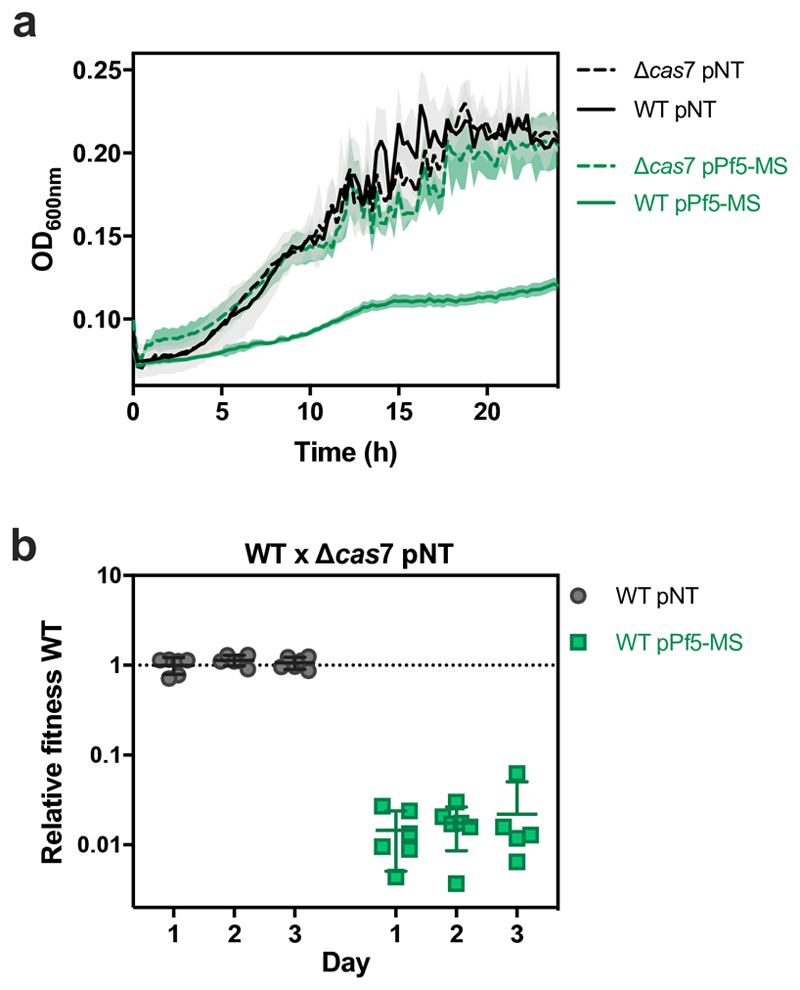
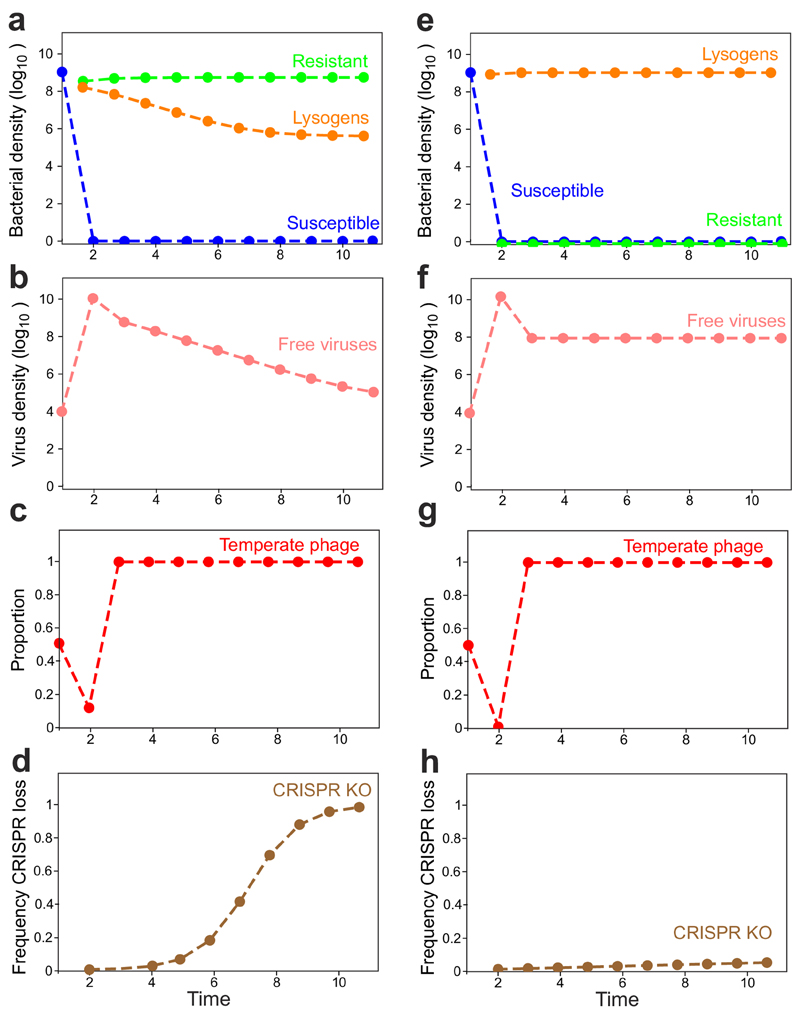
Collectively, these data show that temperate phage infection can drive rapid loss of CRISPR-Cas immune systems from bacterial genomes due to immunopathological effects that manifest during vertical transmission. To generalize our findings beyond phage DMS3 (belonging to Caudovirales), we introduced a priming spacer with one mismatch against the Pf5 prophage (Inoviridae) that is naturally present in the genome of WT PA1420. Expression of a Pf5-priming spacer caused reduced growth of the WT strain and strong selection for bacteria carrying a deletion in their CRISPR-Cas immune system (Extended Data Fig. 5). These observations therefore suggest that immunopathological effects generally drive selection for CRISPR loss, whenever hosts carry spacers primed against their prophage. Indeed, when we formalized these ideas in a theoretical framework, we recovered very similar population and evolutionary dynamics as those observed in our experiments (Extended Data Fig. 6; See Supplemental Information for a detailed description of the model).
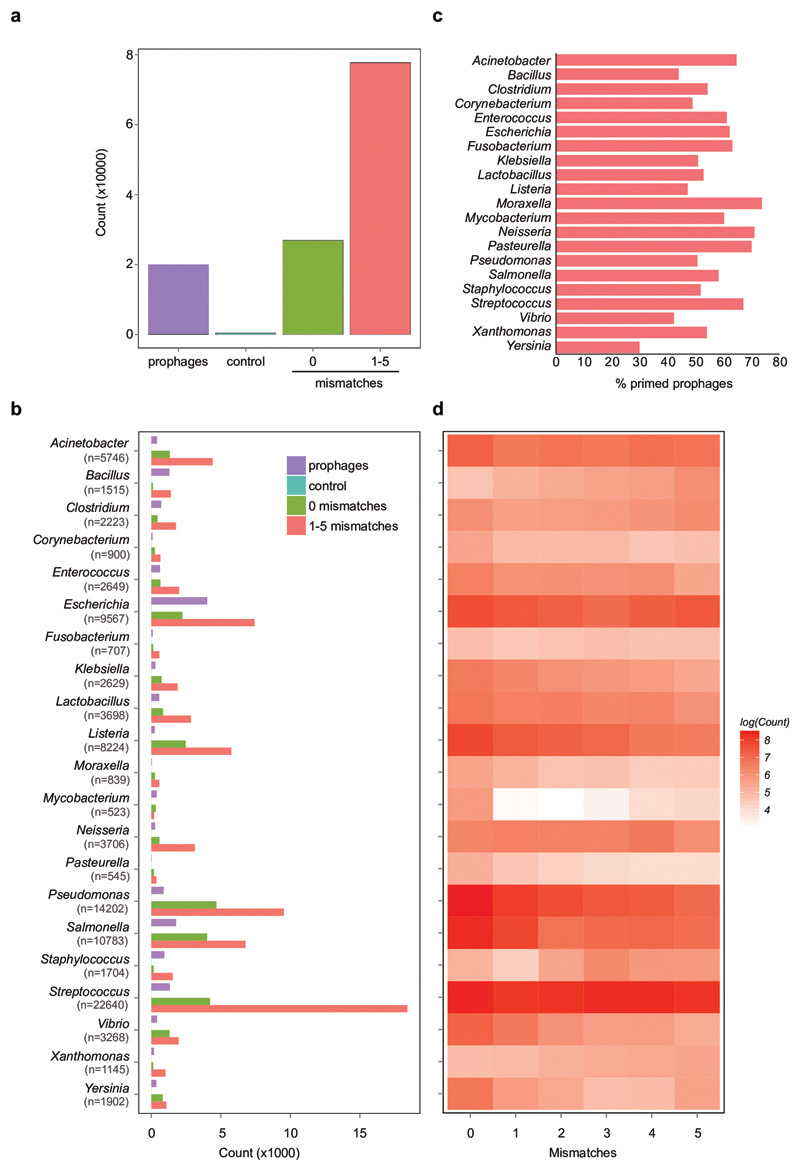
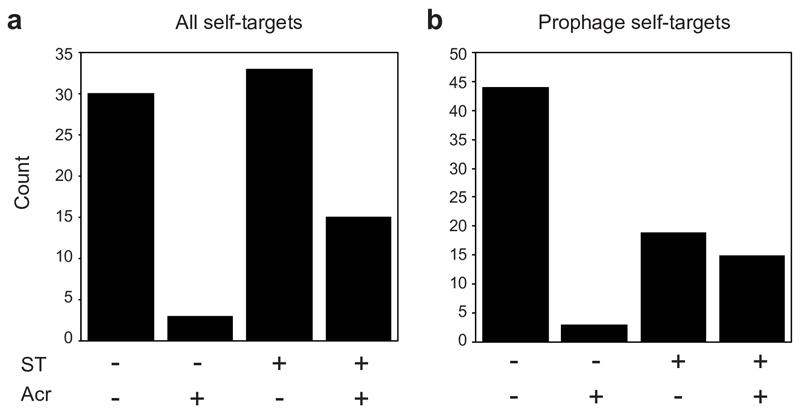
Crucially, priming is thought to be frequent in nature due to the relaxed sequence identity requirements for triggering this pathway, with up to 13 mismatches between a pre-existing spacer and the target being tolerated7. Indeed, analysis of the spacers from >170k bacterial genomes and a dataset of ~20k prophages21 revealed that pre-existing spacers with perfect or imperfect (1-5 mismatches) targets to temperate phages are common within genera (Extended Data Fig. 7; see also Supplemental Information for further information). On average, 49% of all prophages were targeted by priming spacers carried by bacteria within the same genera as the lysogen (Extended Data Fig. 7c). If mismatched spacers generally cause residual DNA cleavage activity by the CRISPR immune system, they would be expected to cause similar immunopathological effects as those observed for the P. aeruginosa-DMS3 interaction. Indeed, when all complete P. aeruginosa genomes were assessed, we observed a significant enrichment for an increase in acr frequency when self-targeting spacers matched prophages (Extended Data Fig. 8), which is consistent with the idea that these spacers cause immunopathological effects. Together, these bioinformatic analyses suggest that maladaptive effects of CRISPR-Cas against temperate phages are likely common in nature.
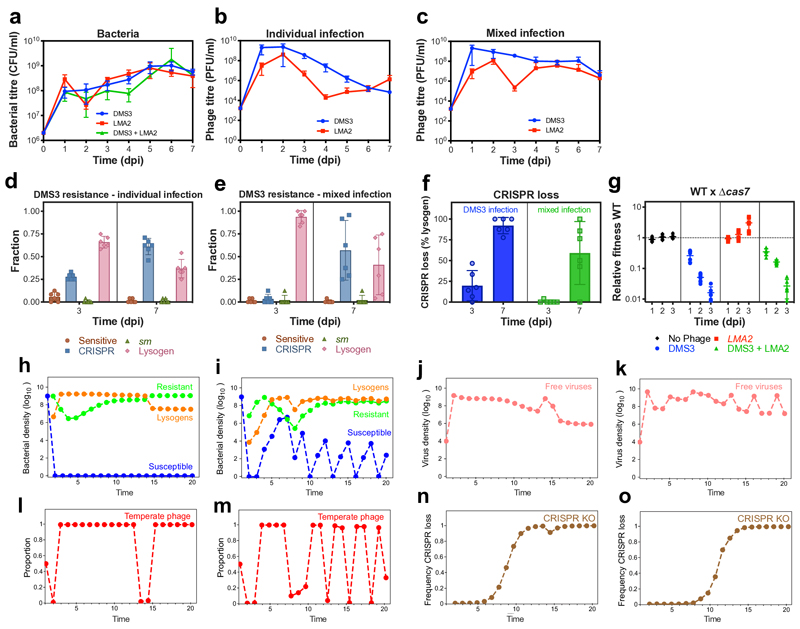
In natural ecosystems, bacteria are frequently exposed to both temperate and virulent phages, and the latter may superinfect the lysogens. To further generalize our findings, we explored whether these superinfections would likely change the observed population and evolutionary dynamics. We found that mixed infection of WT PA14 with temperate phage DMS3 and virulent phage LMA2 (which can superinfect DMS3 lysogens) resulted in similar rates of lysogenization (Extended Data Fig. 9d,e) and high fitness costs of CRISPR-Cas (Extended Data Fig. 9g), that drive evolutionary loss of the immune system (Extended Data Fig. 9f). Our theoretical model recovered similar dynamics, independent of whether CRISPR-based resistance evolves against only one (as in our experiment) or against both phages (Extended Data Fig. 9h-o).
Discussion
The observation that approximately 60% of all bacterial genotypes lack CRISPR-Cas systems and that closely related strains differ in whether they encode cas genes suggests that these systems are frequently gained and lost from bacterial genomes22. While phage infection is typically assumed to be an important selective force for the maintenance of CRISPR-Cas immune systems, this work reveals their rapid loss when exposed to a temperate phage, as a result of immunopathological effects when the CRISPR immune system is “primed” against this phage. Certain CRISPR-Cas immune systems may mitigate some of these autoimmunity costs by limiting the spacer acquisition and cleavage of transcriptionally silent elements15,23. However, CRISPR-based autoimmunity is frequently reported24–27, and the high frequencies at which primed self-targeting interactions occur suggests this is likely a major driver of the evolutionary loss of CRISPR systems in nature.
Methods
Bacterial strains and viruses
P. aeruginosa UCBPP-PA14 (referred to as WT) and P. aeruginosa UCBPP-PA14 csy3::lacZ (referred to as Δcas7) were used in all experiments (described previously28). The surface mutant Tn::pilA lacking a pilus (referred to as sm2) has been described previously29 and was used in competition experiments with bacteriophage insensitive mutant (BIM) with 2 additional acquired spacers over those present in the WT strain (as described previously2).
Lysogens in WT or cas mutant backgrounds used in growth curves, fitness and induction experiments were generated in this study and the presence of a prophage was confirmed by PCR. PA14 strains Δcas3, Δcas1, ΔCRISPR2 and CRISPR2 Δspacer1-2, respectively identified as SMC4268, SMC4277 and SMC3895 and SMC4707, were described elsewhere10,28.
Phage amplifications were carried out on P. aeruginosa UCBPP-PA14 csy3::lacZ. DMS3 and the obligately lytic variant DMS3vir have been described previously30. DMS3-acrIF1 and DMS3-acrIF4 phages were generated in this study following the method for hybrid phage construction detailed in an earlier study17. DMS3vir-acrIF1 was used in downstream analyses and has been described elsewhere3. A virulent phage capable of infecting DMS3 lysogens (LMA2, described previously31) was used in co-culture experiments.
All bacterial strains were grown at 37°C in LB broth or M9 medium (22 mM Na2HPO4; 22 mM KH2PO4; 8.6 mM NaCl; 20 mM NH4Cl; 1 mM MgSO4; 0.1 mM CaCl2) supplemented with 0.2% glucose. When appropriate, medium was further supplemented with gentamycin (50 mg/ml) and arabinose (1% w/v).
Evolution experiments
To monitor the evolution of bacterial resistance in response to phage infection and the associated bacterial and phage population dynamics, microcosms with 6 ml of M9 medium supplemented with 0.2% glucose were inoculated with approximately 106 colony forming units (CFU) bacteria from fresh overnight cultures of the corresponding bacterial strains. These cultures were infected with 104 plaque forming units (PFU) of DMS3vir, DMS3, DMS3-acrIF or LMA2 phages, followed by incubation at 37°C and shaking at 180 revolutions per minute (rpm). Cultures were transferred 1:100 into fresh medium every 24 hours for 5-8 days. All experiments were performed in 6 independent replicates.
Determination of resistance phenotypes
Resistance phenotypes were determined at day 3 or day 7 by streaking individual colonies (24 randomly picked per replicate) through DMS3vir and phage DMS3vir-acrIF1. Surface modification was confirmed by colony morphology, broad-range resistance to DMS3vir and DMS3vir-acrIF1, and a lack of newly acquired spacers. Lysogens were determined by broad resistance to both phage and a positive PCR amplification of the c-repressor gene in bacterial genome, amplified using primers 5’-GCGGAATGAGCGCTAAACC-3’ and 5’-CAAGTGCTTTAGCGAGGAATGC-3’. CRISPR-resistance was confirmed by resistance to DMS3vir, but not to DMS3vir-acrIF1 and a PCR confirming spacers had been added to one of the CRISPR arrays. Primers 5’-CTAAGCCTTGTACGAAGTCTC-3’ and 5’-CGCCGAAGGCCAGCGCGCCGGTG-3’ were used to amplify CRISPR array 1, and primers 5’-GCCGTCCAGAAGTCACCACCCG-3’ and 5’-TCAGCAAGTTACGAGACCTCG-3’ for CRISPR array 2. As a positive control for PCR, primers 5’-GCTTGCAGTTCCTCAACGAG-3’ and 5’-CACCAGGAAATTCAGGTAGGG-3’ were used to amplify the housekeeping control gene fimV involved in pilus formation.
Bacterial and phage titres
Bacterial densities were determined by plating on LB agar dilutions of samples taken at each transfer in M9 salts (22 mM Na2HPO4; 22 mM KH2PO4; 8.6 mM NaCl; 20 mM NH4Cl; 1 mM MgSO4; 0.1 mM CaCl2). Phages were extracted at each transfer by chloroform extraction (sample: chloroform 10:1 v/v), and phage titers were determined by spotting serial dilutions of isolated phage samples in M9 salts on a lawn of PA14Δcas7.
Phage Competition
Fixed phenotypes
Competition experiments were performed in glass vials in 6 ml of M9 medium. Experiments were initiated by inoculating a 1:100 dilution of different mixes of overnight cultures of the Δcas7 strain and either the surface mutant ΔpilA29 (sm2) or BIM strain (2 spacers targeting DMS3). A 50:50 mix of phages DMS3vir and DMS3 was added (108 PFU) and the vials were incubated at 37°C with shaking for 8 hours. Phages were extracted by chloroform extraction and spot assays carried out to determine phage titres. To determine phage relative frequencies, plaque assays were carried out by serially diluting phage extractions and adding 200 µl of the selected dilution to 600 µl of Δcas7 overnight culture and 6 ml molten top agar (0.5%), which was then poured over a prewarmed LB agar plate. The plates were incubated overnight at 37°C and the plaques generated by temperate and virulent phages were discriminated by differences in opacity, and a subset confirmed by PCR. All experiments were performed in 6 replicates.
Coevolution competitions
Phage competition was also measured in the presence of host evolution. Initially sensitive Δcas7 or WT hosts were infected with 104 PFU of a 50:50 mix of temperate and virulent phages (DMS3 and DMS3vir). The experiment was run as a standard evolution experiment, and bacterial and phage titres measured every day for 7 days. Resistance phenotypes were assessed on days 3 and 7, as described above, and plaque assays used to determine the ratio of temperate to virulent phage at each time point.
Competition DMS3 x DMS3-acrIF
Temperate DMS3 was also competed against a mutant encoding Acr proteins. Initially sensitive Δcas7 or WT hosts were infected with 104 PFU of a 50:50 mix of DMS3 and DMS3-acrIF1 (or DMS3-acrIF4). The experiment was run for 3 days and samples of total phage population (i.e. free phages + prophages, no chloroform extraction) were collected and immediately frozen every day. Phage titres were measured every day by spot test. To determine their relative fitness, the relative frequencies of each phage were determined at T=0 and at T=3 by qPCR, following the method described elsewhere32.
Expression of priming spacers
The expression of the CRISPR RNA (crRNA) encoding spacer 1 of CRISPR2 was restored in strain PA14ΔCRISPR2 using an arabinose inducible expression vector (pHERD30T-based). Briefly, oligonucleotides containing the sequences of a non-targeting (NT) spacer (5’-GTCTTCTTTGAGCTTCCAGAGAACTGAAGAC-3’) or of spacer 1 (5’-ATCAGCCGGACGTTGTAGTAGTCGAGCGCGGT-3’) and flanked by two CRISPR2 repeats were annealed and ligated between NcoI/HindIII restriction sites. The resulting plasmids were transformed into PA14ΔCRISPR2 to generate the strains ΔCRISPR2-sp1 and ΔCRISPR2-NT, respectively. Similarly, a spacer targeting the natural Pf5 prophage of PA14 (accession number AY324828) with 1 mismatch 5’-AGTCCTTCTAGTGAGCGGAACCAAAATCTATT-3’ was expressed in WT PA14 strain.
Measuring prophage induction
Single colonies were picked from plated lysogens and grown in LB media overnight at 37°C with 180 rpm shaking. The overnight culture was diluted 1:100 in fresh M9 media and grown until optical density (OD600nm) reached ~0.1. The cultures were then pelleted by centrifugation and the pellet washed 5 times in M9 buffer, then resuspended in 10 ml of M9 media. The cultures were grown at 37°C with shaking and samples taken regularly for phage quantification by spot assay and OD600nm measurements using a Biotek synergy 2 plate reader.
24-hour growth curves
Single colonies were isolated and grown in M9 media overnight at 37°C with 180 rpm shaking. The following day, this culture was diluted 1:100 and 250 µl of this mixture was added to a 96-well plate and growth curves were measured for 23 hours in a Thermo Scientific Varioskan flash plate reader with continuous shaking at 180 rpm. Readings of OD600nm were taken every 15 minutes and the plate kept at 37°C. All growth curves were performed in 6-12 replicates.
Bacterial competition
Competition experiments were performed in 6 ml M9 medium supplemented with 0.2% glucose. Competition experiments were initiated by inoculating 1:100 from a 1:1 mixture of overnight cultures (grown in M9 medium + 0.2% glucose) of each strain. If phages were included, they were added at a concentration of 104 PFU. Cells were transferred 1:100 daily into fresh broth. At varying time points, from 1 to 7 days, samples were taken and cells were serially diluted in M9 salts and plated on LB agar supplemented with 50 μg ml-1 X-gal (to allow discrimination between strains carrying the lacZ gene (blue) or those without (white)). All experiments were performed in 6 replicates. Relative fitness was calculated from changes in the relative frequencies of blue and white colonies (rel. fitness = [(fraction strain A at t=x) * (1 – (fraction stain A at t=0))] / [(fraction strain A at t=0) * (1 – (fraction strain A at t=x)]).
Whole-genome sequencing and bioinformatic analyses
Lysogen clones in WT, Δcas7 and Δcas1 backgrounds were isolated from the late timepoints of the evolution experiments. Standard genome sequencing and standard bioinformatic analyses were provided by MicrobesNG (as described in http://www.microbesng.uk). Raw read sequencing data have been deposited in the European Nucleotide Archive under the study accession number PRJEB34503. Trimmed reads were mapped to WT PA14 reference genome (accession number NC_008463) with Geneious® 9.1.8 software using Bowtie2 mapper33 to identify the genomic deletion. Reads were also mapped to DMS3 reference genome (accession number DQ631426) and hybrid reads composed of a 5’-extremity matching PA14 and a 3’-extremity matching the 5’-end of DMS3 (and vice versa, i.e. reads composed of a 5’-extremity matching the 3’-end of DMS3 and a 3’-extremity matching PA14) were extracted. These hybrid reads were then mapped back to PA14 genome to identify prophage insertion sites.
Extended Data
Extended Figure 1. Infections with a 50:50 mix of temperate:virulent phages.
(a) Bacterial and (b) phage titres during a co-culture experiment of either WT PA14 (red) or Δcas7 mutant (blue) and a 50:50 mix of DMS3 and DMS3vir. (c) Resistance phenotypes at day 3 or (d) day 7 of the co-culture experiment, based on 24 random clones per replicate experiment. Data shown are the mean of 6 biological replicates per treatment. Error bars represent 95% c.i.
Extended Figure 2. Suppression of lysogeny and immunopathological effects are due to spacer 1 of CRISPR array 2.
(a) Phage and (b) bacterial titres during co-culture of phage DMS3 and P. aeruginosa PA14ΔCRISPR2 expressing either a non-targeting spacer from a plasmid (ΔCRISPR2-NT) or the original CRISPR2 spacer 1 (ΔCRISPR2-sp1). (c)The proportion of lysogens and (d) the frequency of loss of CRISPR-Cas immune systems at 1 and 3 dpi, based on PCR analyses of 24 random clones per replicate experiment. Panels a to d show the mean of 3 biological replicates (error bars represent 95% c.i.) (e-g) Growth of 3 independent lysogen clones isolated at 3 dpi as determined by OD600nm measurements. (e) ΔCRISPR2-NT and (f) ΔCRISPR2-sp1 lysogen clones carry the ancestral ΔCRISPR2 CRISPR-Cas immune system, while (g) ΔCRISPR2-sp1 lysogen clones have evolved to lose CRISPR-Cas.
Extended Figure 3. Prophage induction rates are increased in hosts with active CRISPR-Cas.
(a) Percentage lysogens formed upon infection of WT host with DMS3 phages engineered to produce AcrIF1 or AcrIF4 anti-CRISPR proteins. (b) Optical density and (c) phage titres during growth of lysogens of DMS3, DMS3-acrIFI or DMS3-acrIF4 in a WT PA14 or Δcas7 genetic background. (d) Relative fitness of DMS3 phage during competition with the virulent mutant DMS3vir in the presence of varying fractions of sensitive (Δcas7) host and resistant hosts with either CRISPR- (BIM) or surface-based immunity (sm2) against these phages. Data show mean fitness at 8 hours post-infection. All panels show the mean of 6 biological replicates and error bars represent 95% c.i.
Extended Figure 4. Lysogens lose their CRISPR-Cas immune systems.
(a) PCR amplification of the c-repressor gene of the prophage (c-rep, 611 bp), the fimV gene (located ~ 1 Mb from the CRISPR loci, positive control for the PCR, 116 bp) and CRISPR loci 1 (349 bp) and 2 (206 bp) on the host genome. PCRs were performed on 6 independent DMS3 lysogens in WT, Δcas1 and Δcas7 backgrounds isolated at 1 or 7 dpi as well as on 6 independent lysogens of DMS3, DMS3-acrIF1 or DMS3-acrIF4 (WT background) isolated at 6 or 120 hours post infection. Red frames indicate failure to amplify a product. PCR amplifications were performed on clones isolated from 3 biological replicate experiments and produced similar results. For gel source data, see Supplementary Figure 1. (b) Schematic of the CRISPR-Cas locus of PA14 WT which spans a region of around 11 kb. Primers used to amplify regions of CRISPR arrays 1 or 2 are shown as red arrows. (c) Whole genome sequencing of DMS3 lysogens that lost their CRISPR-Cas system (red frames in panel a) in WT PA14, (d) Δcas1 or (e) Δcas7 backgrounds. Graphs show the read coverage of the region encompassing positions 2,700,000 – 2, 970,000 of WT PA14 genome. CRISPR-Cas locus is indicated by a green box on the x-axis. A genome map depicting coding sequences (yellow arrows) is shown above the graphs. Region comprised between 2.84-2.88 Mb includes sequences that are repeated elsewhere on PA14 genome, explaining why reads mapping these positions are still detected in some of the deletion mutants. High peak at the 3’-end of the CRISPR locus corresponds to the coverage of spacer 20 of CRISPR2 by reads that derive from DMS3 prophage (5’- and 3’ extremities of these reads map to phage genome). Spacer 20 of CRISPR2 has 100% identity to DMS3 but is not immunogenic because there is no consensus PAM.
Extended Figure 5. Expression of Pf5 priming spacer in P. aeruginosa PA14.
(a) Growth of Δcas7 (dashed line) or WT (solid line) clones carrying an expression plasmid encoding a non-targeting spacer (pNT) or a spacer targeting PA14 natural prophage Pf5 with one mismatch (pPf5-MS) as determined by OD600nm measurements. Graphs show mean curves from 6 biological replicates and shaded areas corresponds to 95% c.i. (b) Relative fitness of WT pNT or WT pPf5-MS during competition with Δcas7 pNT. Data shown are the mean of 6 biological replicates per treatment. Error bars represent 95% c.i.
Extended Figure 6. Simulations of population and evolutionary dynamics of bacteria-phage interactions, when virulent and temperate phages compete on bacteria with CRISPR-Cas system.
Graphs show densities of (a) susceptible hosts, CRISPR-resistant bacteria and lysogens or (b) free viruses over time, as well as (c) the frequency of temperate phages in a population composed of both temperate and virulent types. Note that temperate phages can transmit both horizontally and vertically, whereas virulent phages can transmit only horizontally and cannot superinfect lysogens. (d) Frequency of evolutionary loss of CRISPR-Cas system in the lysogen population over time. The simulations shown in (a-d) reflect the situation where both virulent and temperate phages lack acr genes, whereas (e-h) reflect the scenario where the temperate type carries an acr.
Extended Figure 7. Matches between spacers and temperate phages are widespread.
(a) Total matches between non-redundant spacers (n=1,239,973) from 171,361 RefSeq and Genbank complete genomes and a non-redundant set of temperate phages (n=19,996)21. The counts of perfect (0) or mis-matched (1-5) targets are shown. As a control, the temperate phages were shuffled ten times retaining the hexanucleotide content (Control). (b) Counts of spacers matching temperate phages from all genera with over 500 spacer-prophage matches. The total number of spacer-prophage matches is shown for each genus in brackets (i.e. n=X). Counts of matches are shown (0 or 1-5 mismatches, green and red). The number of temperate phages analysed is plotted (Prophage, purple) and the matches to shuffled prophages (Control, blue; not visible as only 0 to 10 counts). (c) Percentage of prophages within each genus that were targeted by self-priming spacers (1-5 mismatches). (d) Heatmap of the distribution of mismatches (0-5). Genera are as in (b) and data is shown as log(Count) for each genus, as the number of matches varied widely between genera.
Extended Figure 8. Self-targeting genomes are enriched for acr gene(s).
The number of P. aeruginosa genomes with complete CRISPR-Cas systems that contain (+) or lack (-) genes encoding known Acr. For these strains, the total with perfect (0) or mismatched (1-5) self-targeting (ST) spacers to (a) anywhere in the genome or to (b) prophages are shown. For complete P. aeruginosa genomes all self-targeting events were analysed for matches to prophages using PHASTER37. The greater number of genomes with acr genes (Acr +) and self-targeting (ST +) compared to those without ST is significant (p = 8.14E-05, Fisher’s exact test, two sided, n=71).
Extended Figure 9. Presence of a superinfecting virulent phage does not alter immunopathological effects.
(a) Bacterial and (b-c) phage titres upon (b) individual or (c) mixed infection of WT PA14 with phage DMS3 and virulent phage LMA2. (d-e) Resistance phenotypes evolved by bacteria against DMS3 upon (d) individual or (e) mixed infection. (f) Frequency of loss of CRISPR-Cas immune systems upon infection with phage DMS3 or with both phages DMS3 and LMA2, based on 24 random clones per replicate experiment. (g) Relative fitness of WT PA14 during competition with PA14 Δcas7 in the presence or absence of phages DMS3 and LMA2. All panels (a-g) show means of 6 biological replicates and error bars indicate 95% c.i. (h-o) Simulations of population and evolutionary dynamics during infection of bacteria carrying CRISPR-Cas systems with a mixed population of unrelated virulent and temperate phages. Graphs show densities of (h,i) susceptible hosts, CRISPR-resistant bacteria, lysogens and (j,k) free viruses over time, as well as (l,m) the frequencies of temperate phages in a population composed of both temperate and virulent types. Note that temperate phage can transmit both horizontally and vertically, whereas virulent phage can transmit only horizontally and can superinfect the lysogens (because temperate and virulent phages are unrelated). (n,o) Frequencies of evolutionary loss of CRISPR-Cas system in the lysogen population over time. The simulations shown in (h, j, l, n) reflect the scenario where bacteria can evolve CRISPR-based resistance against both phages, whereas (I, k, m, o) reflects the situation where CRISPR-based resistance does not evolve against the virulent phage and bacteria instead evolve costly surface-based resistance (as it is the case in the experiments). See also supplementary information for a detailed description of the simulations.
Extended Data Table 1. Genomic deletions and prophage insertion sites in DMS3 late lysogen clones.
| Strain | Sample name | Name on ED Fig. 4 | Deleted region | Prophage insertion site(s) | |||
|---|---|---|---|---|---|---|---|
| Start (bp) | End (bp) | Length (bp) | Position (bp) | Proportion of mapped hybrid readsa | |||
| PA14 WT | WT117 | WT_1 | 2,831,115 | 2,938,245 | 107,131 | replace deleted region | 73 |
| WT221 | WT_2 | 2,879,871 | 2,938,280 | 58,410 | replace deleted region | 44.2 | |
| 3,555,252 | 42.3 | ||||||
| WT3213 | WT_3 | 2,880,477 | 2,938,285 | 57,809 | replace deleted region | 84 | |
| WT4313 | WT_4 | 2,878,050 | 2,938,509 | 60,460 | replace deleted region | 72.3 | |
| 3,944,997 | 6.3 | ||||||
| 4,067,332 | 3.8 | ||||||
| 4,453,953 | 2.5 | ||||||
| WT566b | - | 0 | 0 | 0 | nd | nd | |
| WT6615 | WT_5 | 2,812,027 | 2,938,165 | 126,139 | replace deleted region | 42.0 | |
| 3,325,229 | 49.6 | ||||||
| WT7AnneD1 | WT_6 | 2,743,638 | 2,938,176 | 194,539 | replace deleted region | 22.6 | |
| 5,214,542 | 28.9 | ||||||
| 5,732,030 | 24.0 | ||||||
| 5,860,538 | 22.6 | ||||||
| WT8AnneD2 | WT_7 | 2,818,271 | 2,938,290 | 120,020 | 2,335,454 | 24.8 | |
| 2,652,167 | 29.6 | ||||||
| replace deleted region | 21.8 | ||||||
| 3,079,052 | 21.3 | ||||||
| PA14 Δcas1 | cas11114 | Δcas1_1 | 2,918,943 | 2,970,427 | 51,485 | 3,079,190 | 84.3 |
| cas1222 | Δcas1_2 | 2,706,504 | 2,938,538 | 232,035 | replace deleted region | 90.6 | |
| 4,478,625 | 2.8 | ||||||
| cas1333c | - | 0 | 0 | 0 | partial | nd | |
| cas14415 | Δcas1_3 | 2,879,882 | 2,938,523 | 58,642 | 2,730,814 | 44.1 | |
| replace deleted region | 46.0 | ||||||
| 4,481,869 | 3.1 | ||||||
| cas1555d | - | 2,902,848 | 2,938,280 | 35,433 | replace deleted region | 78.8 | |
| 2,934,176 | 7.7 | ||||||
| cas16611 | Δcas7_4 | 2,879,874 | 2,938,285 | 58,412 | replace deleted region | 94.2 | |
| PA14 Δcas7 | cas7114 | Δcas7_1 | 0 | 0 | 0 | 1,120,809 | 86.7 |
| cas72211 | Δcas7_2 | 0 | 0 | 0 | 410,059 | 82.9 | |
| cas73313 | Δcas7_3 | 0 | 0 | 0 | 5,725,887 | 74.7 | |
| cas7442 | Δcas7_4 | 0 | 0 | 0 | 5,743,045 | 84.5 | |
| cas7554 | - | 0 | 0 | 0 | 905,180 | 37.9 | |
| cas7669 | - | 0 | 0 | 0 | 1,667,097 | 75.0 | |
Sum does not reach 100% as a proportion of hybrid reads that mapped PA14 genome did not allow to define a potential prophage insertion site.
Sample contaminated with a Bacteriophage Insensitive Mutant (BIM) clone; sequencing data not interpretable
Only 2607 bp of DMS3 DNA (including c-repressor gene) are inserted in bacterial genome at position 5,834,730
Mixed population - reads matching the CRISPR locus are still detectable but coverage is very low
Supplementary Material
Acknowledgements
We thank A.R. Davidson (University of Toronto, Toronto, Canada) for providing the mutant strains of PA14 Δcas3, Δcas7, Δcas1 and ΔCRISPR2, G.A. O’Toole (Dartmouth College, New Hampshire, USA) for the strain CRISPR2Δsp1,2 and J. Bondy-Denomy (University of California, San Francisco, USA) for the Tn::pilA (ΔpilA) PA14 surface mutant. Genome sequencing was provided by MicrobesNG (http://www.microbesng.uk), which is supported by the BBSRC (grant number BB/L024209/1). This work was funded by a grant from the European Research Council (https://erc.europa.eu) (ERC-STG-2016-714478 - EVOIMMECH) and NERC Independent Research Fellowship (NE/M018350/1) awarded to E.R.W., A.C. has received funding from the European Union’s Horizon 2020 research and innovation programme under the Marie Sklodowska-Curie grant agreement No 834052. P.F. was supported by the Marsden Fund from the Royal Society of New Zealand.
Footnotes
Author Contributions
Conceptualization of the study was done by C.R, A.C. and E.R.W. Experimental design was carried out by C.R., A.C., B.N.J.W and E.R.W. Bacterial evolution, competition and growth experiments were done by C.R. and A.C. with assistance from O.F. and I.M.; Virulent vs Temperate phage competitions and prophage induction rate experiments were performed by C.R. All experiments with Acr-phages and CRISPR2 spacer 1 were done by A.C.; B.N.J.W and A.C. carried out Pf5 experiments. Experiment with superinfecting virulent phage was done by E.R.W.; C.R., A.C., B.W., T.C., C.B., P.F., and E.R.W. analysed the data. S.G. generated theoretical mathematical models; T.C. conducted bioinformatic analyses supervised by C.B. and P.F.; A.C. made whole genome sequencing analyses. C.R. wrote the original draft of the manuscript; A.C. wrote the revised version of the manuscript with contributions from C.R., B.W., T.C., S.G., C.B. and P.F.; E.R.W. supervised the project and provided comments on all versions of the manuscript.
Author Information
The authors declare no competing interests.
Data and code availability
Source data associated with main figures and Extended Data Figures 1,2,3,5,7,8 and 9 are available in the online version of this publication. Sequencing data have been deposited in the European Nucleotide Archive under the study accession number PRJEB34503. The datasets analysed for the bioinformatic study are available on github at https://github.com/davidchyou/Rollie-Chevallereau
Code availability
Mathematical algorithms generated during this study are available in the online supplementary information file. Scripts generated for the bioinformatics analyses are available on github at https://github.com/davidchyou/Rollie-Chevallereau
References
- 1.Stewart FM, Levin BR. The population biology of bacterial viruses: Why be temperate. Theor Popul Biol. 1984;26:93–117. doi: 10.1016/0040-5809(84)90026-1. [DOI] [PubMed] [Google Scholar]
- 2.Westra ER, et al. Parasite Exposure Drives Selective Evolution of Constitutive versus Inducible Defense. Curr Biol. 2015;25:1043–1049. doi: 10.1016/j.cub.2015.01.065. [DOI] [PubMed] [Google Scholar]
- 3.van Houte S, et al. The diversity-generating benefits of a prokaryotic adaptive immune system. Nature. 2016;532:385–388. doi: 10.1038/nature17436. [DOI] [PMC free article] [PubMed] [Google Scholar]
- 4.Barrangou R, et al. CRISPR Provides Acquired Resistance Against Viruses in Prokaryotes. Science. 2017;315:1709–1712. doi: 10.1126/science.1138140. [DOI] [PubMed] [Google Scholar]
- 5.Garneau JE, et al. The CRISPR/Cas bacterial immune system cleaves bacteriophage and plasmid DNA. Nature. 2010;468:67–71. doi: 10.1038/nature09523. [DOI] [PubMed] [Google Scholar]
- 6.Datsenko KA, et al. Molecular memory of prior infections activates the CRISPR/Cas adaptive bacterial immunity system. Nat Commun. 2012;3:1–7. doi: 10.1038/ncomms1937. [DOI] [PubMed] [Google Scholar]
- 7.Fineran PC, et al. Degenerate target sites mediate rapid primed CRISPR adaptation. Proc Natl Acad Sci. 2014;111:E1629–E1638. doi: 10.1073/pnas.1400071111. [DOI] [PMC free article] [PubMed] [Google Scholar]
- 8.Howard-Varona C, Hargreaves KR, Abedon ST, Sullivan MB. Lysogeny in nature: mechanisms, impact and ecology of temperate phages. ISME J. 2017;11:1511–1520. doi: 10.1038/ismej.2017.16. [DOI] [PMC free article] [PubMed] [Google Scholar]
- 9.Heussler GE, et al. Clustered Regularly Interspaced Short Palindromic Repeat-Dependent, Biofilm-Specific Death of Pseudomonas aeruginosa Mediated by Increased Expression of Phage-Related Genes. mBio. 2015;6:e00129–15. doi: 10.1128/mBio.00129-15. [DOI] [PMC free article] [PubMed] [Google Scholar]
- 10.Zegans ME, et al. Interaction between Bacteriophage DMS3 and Host CRISPR Region Inhibits Group Behaviors of Pseudomonas aeruginosa. J Bacteriol. 2009;191:210–219. doi: 10.1128/JB.00797-08. [DOI] [PMC free article] [PubMed] [Google Scholar]
- 11.Berngruber TW, Froissart R, Choisy M, Gandon S. Evolution of Virulence in Emerging Epidemics. PLoS Pathog. 2013;9:e1003209. doi: 10.1371/journal.ppat.1003209. [DOI] [PMC free article] [PubMed] [Google Scholar]
- 12.Trasanidou D, et al. Keeping crispr in check: diverse mechanisms of phage-encoded anti-crisprs. FEMS Microbiol Lett. 2019;366 doi: 10.1093/femsle/fnz098. fnz098. [DOI] [PMC free article] [PubMed] [Google Scholar]
- 13.Bondy-Denomy J, et al. Multiple mechanisms for CRISPR–Cas inhibition by anti-CRISPR proteins. Nature. 2015;526:136–139. doi: 10.1038/nature15254. [DOI] [PMC free article] [PubMed] [Google Scholar]
- 14.Little JW, Michalowski CB. Stability and Instability in the Lysogenic State of Phage Lambda. J Bacteriol. 2010;192:6064–6076. doi: 10.1128/JB.00726-10. [DOI] [PMC free article] [PubMed] [Google Scholar]
- 15.Goldberg GW, Jiang W, Bikard D, Marraffini La. Conditional tolerance of temperate phages via transcription-dependent CRISPR-Cas targeting. Nature. 2014;514:633–637. doi: 10.1038/nature13637. [DOI] [PMC free article] [PubMed] [Google Scholar]
- 16.Samai P, et al. Co-transcriptional DNA and RNA cleavage during type III CRISPR-Cas immunity. Cell. 2015;161:1164–1174. doi: 10.1016/j.cell.2015.04.027. [DOI] [PMC free article] [PubMed] [Google Scholar]
- 17.Landsberger M, et al. Anti-CRISPR Phages Cooperate to Overcome CRISPR-Cas Immunity. Cell. 2018;174:908–916.e12. doi: 10.1016/j.cell.2018.05.058. [DOI] [PMC free article] [PubMed] [Google Scholar]
- 18.Borges AL, et al. Bacteriophage Cooperation Suppresses CRISPR-Cas3 and Cas9 Immunity. Cell. 2018;174:917–925.e10. doi: 10.1016/j.cell.2018.06.013. [DOI] [PMC free article] [PubMed] [Google Scholar]
- 19.Poulsen BE, et al. Defining the core essential genome of Pseudomonas aeruginosa. Proc Natl Acad Sci. 2019 doi: 10.1073/pnas.1900570116. 201900570. [DOI] [PMC free article] [PubMed] [Google Scholar]
- 20.Mooij MJ, et al. Characterization of the integrated filamentous phage Pf5 and its involvement in small-colony formation. Microbiology. 2007;153:1790–1798. doi: 10.1099/mic.0.2006/003533-0. [DOI] [PMC free article] [PubMed] [Google Scholar]
- 21.Zhou Y, Liang Y, Lynch KH, Dennis JJ, Wishart DS. PHAST: a fast phage search tool. Nucleic Acids Res. 2011;39:W347–352. doi: 10.1093/nar/gkr485. [DOI] [PMC free article] [PubMed] [Google Scholar]
- 22.Makarova KS, et al. An updated evolutionary classification of CRISPR–Cas systems. Nat Rev Microbiol. 2015;13:722–736. doi: 10.1038/nrmicro3569. [DOI] [PMC free article] [PubMed] [Google Scholar]
- 23.Levy A, et al. CRISPR adaptation biases explain preference for acquisition of foreign DNA. Nature. 2015;520:505–510. doi: 10.1038/nature14302. [DOI] [PMC free article] [PubMed] [Google Scholar]
- 24.Stern A, Keren L, Wurtzel O, Amitai G, Sorek R. Self-targeting by CRISPR: Gene regulation or autoimmunity? Trends Genet. 2010;26:335–340. doi: 10.1016/j.tig.2010.05.008. [DOI] [PMC free article] [PubMed] [Google Scholar]
- 25.Vercoe RB, et al. Cytotoxic Chromosomal Targeting by CRISPR/Cas Systems Can Reshape Bacterial Genomes and Expel or Remodel Pathogenicity Islands. PLoS Genet. 2013;9:e1003454. doi: 10.1371/journal.pgen.1003454. [DOI] [PMC free article] [PubMed] [Google Scholar]
- 26.Jiang W, et al. Dealing with the Evolutionary Downside of CRISPR Immunity: Bacteria and Beneficial Plasmids. PLoS Genet. 2013;9:e1003844. doi: 10.1371/journal.pgen.1003844. [DOI] [PMC free article] [PubMed] [Google Scholar]
- 27.Goldberg GW, et al. Incomplete prophage tolerance by type III-A CRISPR-Cas systems reduces the fitness of lysogenic hosts. Nat Commun. 2018;9 doi: 10.1038/s41467-017-02557-2. 61. [DOI] [PMC free article] [PubMed] [Google Scholar]
- 28.Cady KC, O’Toole GA. Non-Identity-Mediated CRISPR-Bacteriophage Interaction Mediated via the Csy and Cas3 Proteins. J Bacteriol. 2011;193:3433–3445. doi: 10.1128/JB.01411-10. [DOI] [PMC free article] [PubMed] [Google Scholar]
- 29.Liberati NT, et al. An ordered, nonredundant library of Pseudomonas aeruginosa strain PA14 transposon insertion mutants. Proc Natl Acad Sci. 2006;103:2833–2838. doi: 10.1073/pnas.0511100103. [DOI] [PMC free article] [PubMed] [Google Scholar]
- 30.Cady KC, Bondy-Denomy J, Heussler GE, Davidson AR, O’Toole GA. The CRISPR/Cas Adaptive Immune System of Pseudomonas aeruginosa Mediates Resistance to Naturally Occurring and Engineered Phages. J Bacteriol. 2012;194:5728–5738. doi: 10.1128/JB.01184-12. [DOI] [PMC free article] [PubMed] [Google Scholar]
- 31.Ceyssens P-J, et al. Comparative analysis of the widespread and conserved PB1-like viruses infecting Pseudomonas aeruginosa. Environ Microbiol. 2009;11:2874–2883. doi: 10.1111/j.1462-2920.2009.02030.x. [DOI] [PubMed] [Google Scholar]
- 32.Chevallereau A, et al. Exploitation of the cooperative behaviours of anti-CRISPR phages. bioRXiv Microbiology. 2019 doi: 10.1101/574418. [DOI] [PMC free article] [PubMed] [Google Scholar]
- 33.Langmead B, Salzberg SL. Fast gapped-read alignment with Bowtie 2. Nat Methods. 2012;9:357–359. doi: 10.1038/nmeth.1923. [DOI] [PMC free article] [PubMed] [Google Scholar]
- 34.Biswas A, Staals RHJ, Morales SE, Fineran PC, Brown CM. CRISPRDetect: A flexible algorithm to define CRISPR arrays. BMC Genomics. 2016;17:356. doi: 10.1186/s12864-016-2627-0. [DOI] [PMC free article] [PubMed] [Google Scholar]
- 35.Couvin D, et al. CRISPRCasFinder, an update of CRISRFinder, includes a portable version, enhanced performance and integrates search for Cas proteins. Nucleic Acids Res. 2018;46:W246–W251. doi: 10.1093/nar/gky425. [DOI] [PMC free article] [PubMed] [Google Scholar]
- 36.Watters KE, Fellmann C, Bai HB, Ren SM, Doudna JA. Systematic discovery of natural CRISPR-Cas12a inhibitors. Science. 2018;362:236–239. doi: 10.1126/science.aau5138. [DOI] [PMC free article] [PubMed] [Google Scholar]
- 37.Arndt D, et al. PHASTER: a better, faster version of the PHAST phage search tool. Nucleic Acids Res. 2016;44:W16–W21. doi: 10.1093/nar/gkw387. [DOI] [PMC free article] [PubMed] [Google Scholar]
Associated Data
This section collects any data citations, data availability statements, or supplementary materials included in this article.


