Abstract
Midbrain dopamine (DA) neurons encode both reward and movement-related events, and are implicated in disorders of reward processing as well as movement. Consequently, disentangling the contribution of DA neurons in reinforcing versus generating movements is challenging and has led to lasting controversy. We dissociated these functions by parametrically varying the timing of optogenetic manipulations in a Pavlovian conditioning task, and examining the influence on anticipatory licking prior to reward delivery. Inhibiting both ventral tegmental area (VTA) and substantia nigra pars compacta (SNc) DA neurons in the post-reward period had a significantly greater behavioral effect than inhibition in the pre-reward period of the task. Furthermore, the contribution of DA neurons to behavior decreased linearly as a function of elapsed time after reward. Together, the results indicate a temporally restricted role of DA neurons primarily related to reinforcing stimulus-reward associations, and suggest that directly generating movements is a comparatively less important function.
Introduction
A hallmark of Pavlovian conditioning is that sensory stimuli associated with appetitive outcomes elicit behavioral responses such as anticipatory movements 1. This relies on neural systems for regulating the strength of stimulus-reward associations, as well as systems for generating the conditioned responses. Although many lines of evidence indicate that midbrain DA neurons play an important role in both of these processes 2–4, the distinction between the DA system’s role in reinforcement learning versus generation of movement has not been fully elucidated 5–7.
DA neurons encode reward prediction error (RPE) signals, reflecting the discrepancy between the expected and actual level of reward 8, 9. These signals are thought to be crucial for forming and updating stimulus-reward associations, and there is strong causal evidence for this from studies that manipulate DA neurons 10, 11. As learning progresses, DA neurons shift from responding only after rewards, to also responding to reward-predicting cues 8, 12. The significance of this cue-related activity is unclear, but one possible interpretation is that these signals enable or motivate animals to generate conditioned movements 3, 13–15. Furthermore, DA neurons appear to also encode motor information 16–22, providing additional evidence that they may be involved in generating movements. But despite significant progress in characterizing their dynamics, the behavioral significance of DA neurons at different time periods has not been systematically compared. Particularly, it remains unclear whether, in animals that have undergone Pavlovian conditioning, the pre- or post-reward period of DA activity is more important for producing conditioned responses. To address this gap in our understanding, we used a trace conditioning task, in which movement and reinforcement occur at distinct time periods (pre- and post-reward, respectively), and can thus be disentangled with temporally specific optogenetic manipulations 13, 23.
Results
Differential behavioral contribution of pre- and post-reward DA neuron activity
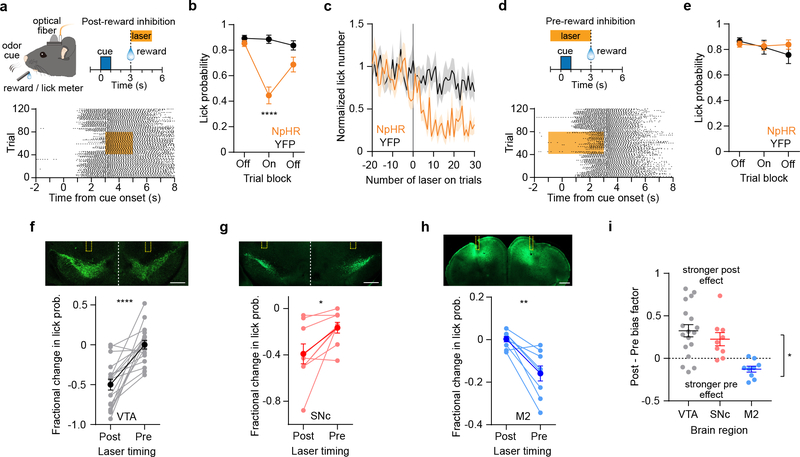
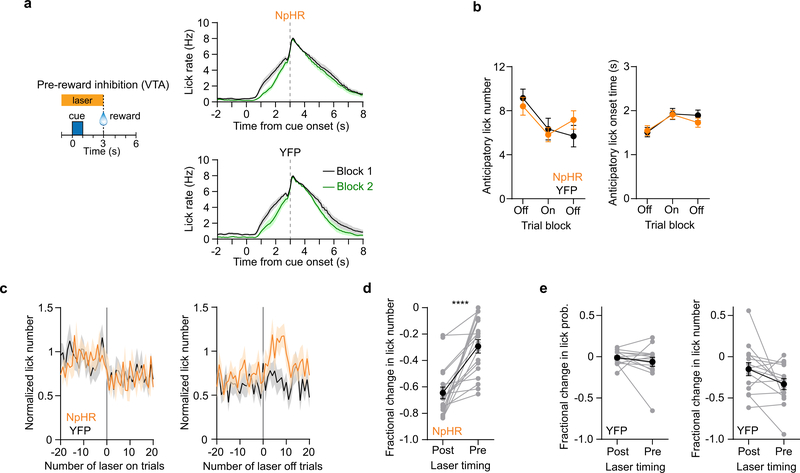
We virally expressed eNpHR3.0 or a control fluorophore in VTA (also encompassing medial regions of the SNc) DA neurons (n = 18 eNpHR3.0+ and 14 YFP+ DAT-Cre mice). In separate animals we confirmed that applying laser stimulation reduced the mean spontaneous firing of VTA neurons recorded in vivo (Extended Data Fig. 1). Head-restrained, food-restricted animals underwent Pavlovian conditioning, in which an olfactory cue was paired after a 2 s delay with an unconditioned sweetened milk reward (Fig. 1a). Following an initial learning period, presentation of the cue frequently elicited a conditioned response in the form of anticipatory licking that began prior to reward delivery 24. After training mice to reliably perform this response, we examined their licking performance across multiple test sessions representing different time periods of optogenetic inhibition (i.e., light delivery occurred before or after the reward). Each session was comprised of three blocks of 40 trials, with the laser activated in the second block. Continuously inhibiting DA neurons for 2 s immediately after reward delivery significantly reduced the probability and rate of anticipatory licking (Fig. 1a, 1b, Extended Data Fig. 2). These changes occurred over the course of about 10 trials (Fig. 1c).
Fig. 1. Pre- and post-reward DA signals differentially control conditioned movements.
a. (Top left) Schematic of behavioral training setup in head-restrained mice. (Top right) Trial structure of the Pavlovian reward conditioning task. Orange bar indicates the timing of the laser, which here occurs in the post-reward period (2 s duration). (Bottom) Lick raster of a mouse expressing eNpHR3.0 in VTA DA neurons. Orange shaded area indicates duration of post-reward laser stimulus given on trials 41 – 80.
b. Inhibiting DA neurons in the post-reward period significantly reduced the probability of anticipatory licking in the laser block compared to controls (n = 18 eNpHR3.0+ and 14 YFP+ mice, two-way RM ANOVA, group effect: F1,30 = 15, P = 0.0005, trial block effect: F2,60 = 20.9, P < 0.0001). Post-hoc Sidak’s test: ****P < 0.0001.
c. Mean number of anticipatory licks per animal (n = 18 eNpHR3.0+ and 14 YFP+ mice) as a function of trial number, for post-reward laser stimulation. Data are normalized to the mean lick count in the first trial block corresponding to laser off. Data are aligned to the start of the second trial block. Shading represents SEM.
d. (Top) Schematic of test session with pre-reward DA inhibition (4 s laser duration starting 1 s prior to cue onset). (Bottom) Lick raster of the same mouse as in (a), but with laser during pre-reward DA inhibition on trials 41 – 80.
e. Inhibiting DA neurons in the pre-reward period had no significant effect on the probability of anticipatory licking (n = 18 eNpHR3.0+ and 14 YFP+ mice, two-way RM ANOVA, group effect: F1,30 = 0.2, P = 0.64, trial block effect: F2,60 = 1.8, P = 0.17).
f. (Top) Viral expression and approximate position of optical fibers (dashed yellow line) preferentially targeting the lateral VTA (including medial SNc). Dashed white line indicates the midline. Scale bars in (f-h): 0.5 mm. (Bottom) Fractional change in anticipatory lick probability caused by pre and post-reward inhibition (n = 18 eNpHR3.0+ DAT-Cre mice, two-sided paired t-test, t17 = 5.6, P < 0.0001). The fractional change in lick probability for pre-reward inhibition was not significantly different from zero (two-sided paired t-test, t17 = 0.02, P = 0.98). Darker shaded symbols represent mean ± SEM.
g. (Top) Viral expression and approximate position of optical fibers preferentially targeting the lateral SNc. (Bottom) Fractional change in anticipatory lick probability caused by pre and post-reward inhibition (n = 9 eNpHR3.0+ DAT-Cre mice, two-sided paired t-test, t8 = 2.9, P = 0.02). The difference is still significant after removing the subject with the lowest value in the post-reward group (n = 8, t7 = 3.2, P = 0.01). The fractional change in lick probability for pre-reward inhibition was significantly less than zero (n = 9, two-sided paired t-test, t8 = −3.6, P = 0.007).
h. (Top) Viral expression and approximate position of optical fibers targeting M2. (Bottom) Fractional change in anticipatory lick probability caused by pre and post-reward inhibition (n = 9 eNpHR3.0+ C57Bl/6J mice, two-sided paired t-test, t8 = 4.8, P = 0.001). The fractional change in lick probability for pre-reward inhibition was significantly less than zero (two-sided paired t-test, t8 = −4.5, P = 0.002).
i. VTA and SNc DA neurons preferentially regulate conditioned movements via post-reward signaling. Bias factor between post- and pre-reward optogenetic inhibition for VTA (n = 18), SNc (n = 9), and M2 (n = 9). Both VTA and SNc have a significantly higher bias compared to M2, and the bias factor between VTA and SNc is similar (one-way ANOVA, F2,33 = 9.7, P = 0.0005). Post-hoc Tukey’s test: VTA vs SNc P = 0.6, VTA vs M2 P = 0.0003, SNc vs M2 P = 0.016. Data are expressed as mean ± SEM.
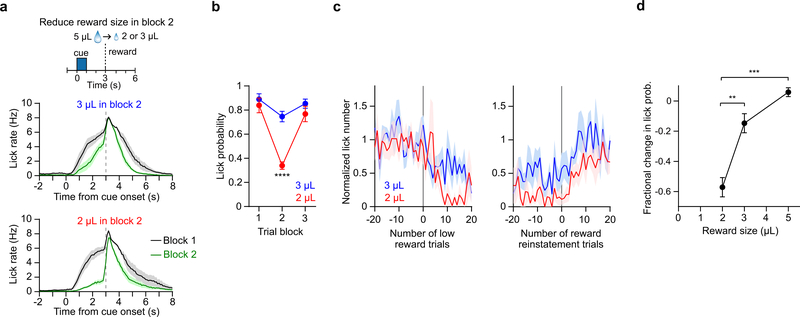
To determine whether the reduction in licking in the second block is consistent with a decreased valuation of the reward, we trained a separate group of mice on the task, and during the second block of trials, instead of optogenetically inhibiting DA neurons, we reduced the reward size from the original volume of 5 μL to 2 or 3 μL (n = 7 mice, Extended Data Fig. 3). This lowered the rate and probability of anticipatory licking, and the magnitude of the effect scaled with reward size. Furthermore, licking recovered after the reward was returned to the original level in the third block of trials. These results show that optogenetically inhibiting post-reward DA neuron activity is similar to reducing the effective value of the sweetened milk reward.
We also examined the effect of optogenetic inhibition on reward consumption in the 2 s period coinciding with the laser stimulus (Supplementary Fig. 1) 25. Although the consumption probability was not significantly altered, there was a reduction in consummatory lick number. However, anticipatory licking was significantly more impaired than consummatory licking. These findings suggest that post-reward DA inhibition impacts the reinforcement of conditioned responses that occur before reward presentation, but has comparatively little effect on movements that occur during the inhibition period.
Next, with the same animals exposed to post-reward optogenetic inhibition, in another session we tested the effect of inhibiting DA neurons in the period before reward, coinciding with the onset of anticipatory licking (Fig. 1d). According to the model that DA is involved in generating movements, inhibiting DA during this time period should strongly impair anticipatory licking performance. However, in contrast to post-reward inhibition, this manipulation appeared to have only a small effect on anticipatory licking, and on average neither the probability, number, nor timing of anticipatory licking were significantly different from controls (Fig. 1d, 1e, Extended Data Fig. 4a–4c). Directly comparing the fractional change in lick probability between the two inhibition conditions, we found a significantly greater behavioral impairment during post-reward DA inhibition (Fig. 1f, Extended Data Fig. 4d). As a control, YFP-expressing animals showed no significant difference in anticipatory licking between pre- and post-reward laser stimulation (Extended Data Fig. 4e).
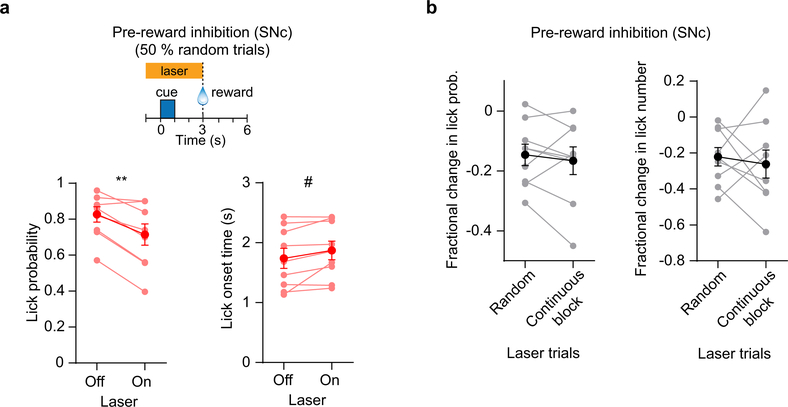
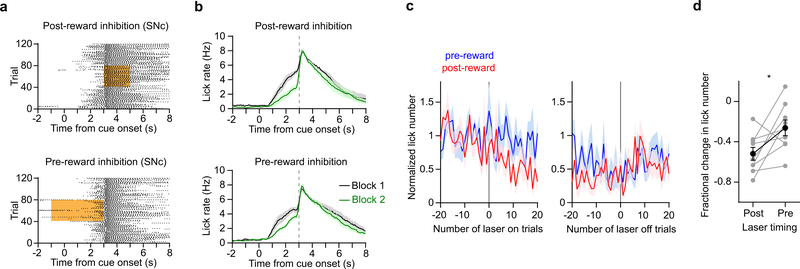
A number of studies suggest a functional distinction between DA neurons in the VTA and SNc, with the VTA primarily involved in reward processing and the SNc in movement generation 3, 17, 26–28. To test this, in a separate group of animals we injected the virus and implanted optical fibers to preferentially inhibit the lateral SNc (n = 9 eNpHR3.0+ mice). In these experiments, both pre- and post-reward DA inhibition appeared to reduce anticipatory licking (Fig. 1g). To confirm that pre-reward inhibition effects reflect a decreased ability to generate movements rather than a learning deficit that accumulates over successive trials, we performed pre-reward SNc DA inhibition on randomly assigned laser trials. Again, we found a lower licking probability on trials with the laser turned on, with an effect size statistically similar to that observed when presenting the laser in a continuous block of trials (Extended Data Fig. 5). But notably, as with the VTA, the effect of post-reward SNc DA inhibition still significantly outweighed that of pre-reward inhibition (Fig. 1g, Extended Data Fig. 6).
Since the combined VTA and SNc experiments targeted a relatively wide span of DA neurons along the medial-lateral (ML) direction, we searched for a relationship between histologically determined optical fiber coordinates and optogenetically induced behavioral changes (Supplementary Fig. 2). We found a significant correlation between the fractional change in anticipatory licking and mean ML position for the post- but not pre-reward laser condition, with animals that had more medially implanted fibers tending to show stronger behavioral effects. These results further suggest that SNc and VTA DA neurons have similar although not identical functions in this task. We also confirmed that the order in which the pre- and post-reward inhibition sessions were administered in these mice did not significantly influence the results (Supplementary Fig. 3).
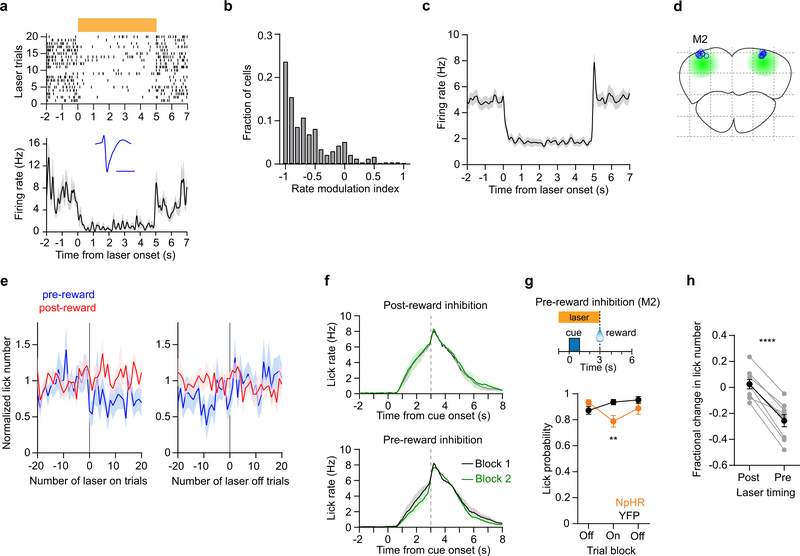
To place these findings into a broader context of understanding the brain circuits that mediate learning and movement, we tested whether there is another region whose primary role, in contrast to DA neurons, is confined to the pre-reward period. We performed pre- and post-reward optogenetic inhibition in the secondary motor cortex (M2), an area which is known to control licking (n = 9 wild type mice with eNpHR3.0 expressed under a CaMKIIa promoter) 29. In separate animals we confirmed that optical stimulation is capable of suppressing the spontaneous activity of cortical neurons (Extended Data Fig. 7a–7c). Pre-reward M2 inhibition significantly reduced anticipatory licking, and this effect was stronger than inhibition in the post-reward period (Fig. 1h, Extended Data Fig. 7d–7h). Taken together, there appear to be distinct time periods by which DA and motor cortical circuits preferentially regulate reward-conditioned movements (Fig. 1i). The most parsimonious explanation for these differential effects is that midbrain DA neurons are mainly involved in reinforcement learning, whereas M2 in directly generating movements. These functions are both essential for survival and highly complementary.
Similar optogenetic reduction of DA neuron firing in the pre- and post-reward period
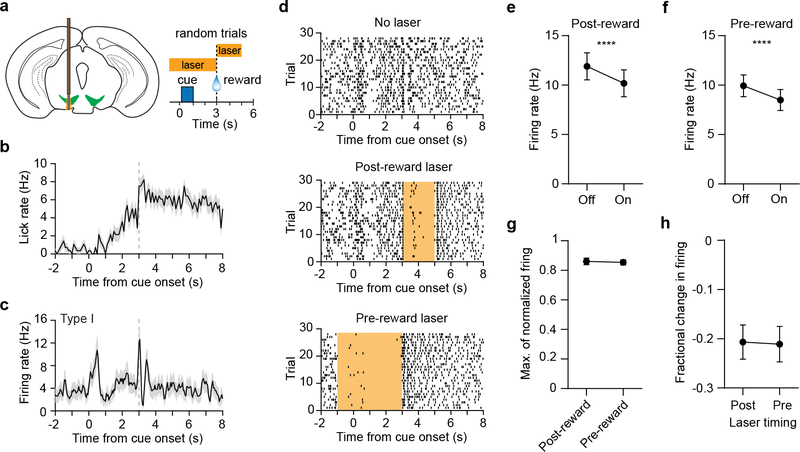
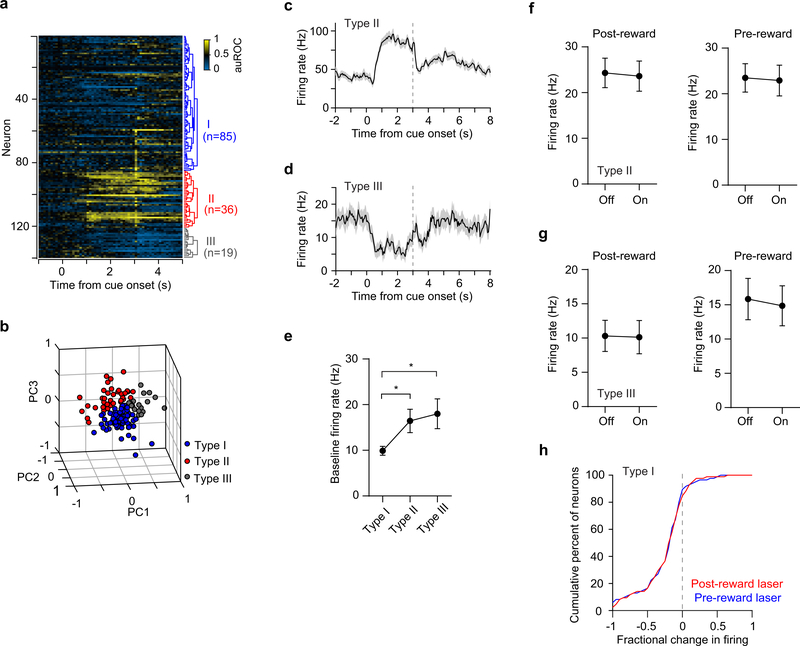
A potential concern is that since these animals were well-trained, DA neurons may be more strongly excited – and thus more difficult to effectively silence optogenetically – in the pre-reward period 8, 12. Since measuring optogenetically induced changes in spontaneous activity (Extended Data Fig. 1) may not predict how neural activity is altered during behavior, we directly examined the effect of optogenetic inhibition on task-evoked VTA activity. We simultaneously performed electrophysiological recordings and optogenetic DA neuron inhibition as mice performed anticipatory licking (Fig. 2a, 2b). In one third of randomly selected trials, the laser was turned on during either the pre- or post-reward period. We used a hierarchical clustering approach introduced in another study 24 to putatively distinguish DA neurons from other cell types, based on the time course of their firing rate on trials without laser (Fig. 2c, Extended Data Fig. 8a–8d). Among the three types of identified clusters, only cells resembling those in Type I (with a phasic excitation to the cue and/or reward) were previously found to represent DA neurons 24. This cluster had the lowest mean baseline firing (Extended Data Fig. 8e), and was the only cluster to show a significant reduction in mean pre- and post-reward evoked firing on trials with laser (Fig. 2d–2f, Extended Data Fig. 8f, 8g). This provides further evidence that only the Type I cluster contains a sizable fraction of eNpHR3.0+ DA neurons. Some Type I cells were almost completely silenced by the laser (Fig. 2d), but overall there was substantial variation in the level of suppression across this population (Extended Data Fig. 8h). We also found that on trials without laser, Type I cluster cells had similar peak levels of pre- and post-reward period activity (Fig. 2g). Finally, for these cells, the fractional change in firing caused by the laser during the pre- and post-reward period was statistically similar (Fig. 2h).
Fig. 2. Similar optogenetic reduction of DA neuron activity in the pre- and post-reward period.
a. (Left) Illustration of recording with a 64 electrode silicon microprobe during optogenetic inhibition of VTA DA neurons. (Right) Structure of the task during recordings. Trials consisted either of no laser, post-reward laser, or pre-reward laser (~33 % probability each, randomized order).
b. Mean lick rate versus time of one animal during recording, on laser-free trials (n = 28 trials).
c. Mean firing rate versus time of one Type I cluster cell (putative DA neuron) on laser-free trials (n = 28), recorded from the same animal as in (b).
d. Spike raster of the same neuron as in (c) on trials with no laser (top), post-reward laser (middle), and pre-reward laser (bottom). The orange bar indicates the timing of the laser.
e. The mean firing rate of Type I cells in the post-reward period was significantly reduced by application of post-reward laser (n = 85 cells, two-sided paired t-test, t84 = 5.7, P < 0.0001).
f. The mean firing rate of Type I cells in the pre-reward period was significantly reduced by application of pre-reward laser (n = 85, two-sided paired t-test, t84 = 4.4, P < 0.0001).
g. There was no significant difference in the mean of the maximum value of the normalized firing rate of Type I cells in the pre- and post-reward period (n = 85, two-sided paired t-test, t84 = 0.2, P = 0.84). Data represent trials with no laser.
h. There was no significant difference in the mean fractional change in firing rate of Type I cells by application of laser in the pre- and post-reward period (n = 85, two-sided paired t-test, t84 = 0.1, P = 0.91). Fractional change in post-reward firing rate: −20.7 ± 3.5 %, fractional change in pre-reward firing rate: −21.1 ± 3.6 %, mean ± SEM. Data are expressed as mean ± SEM.
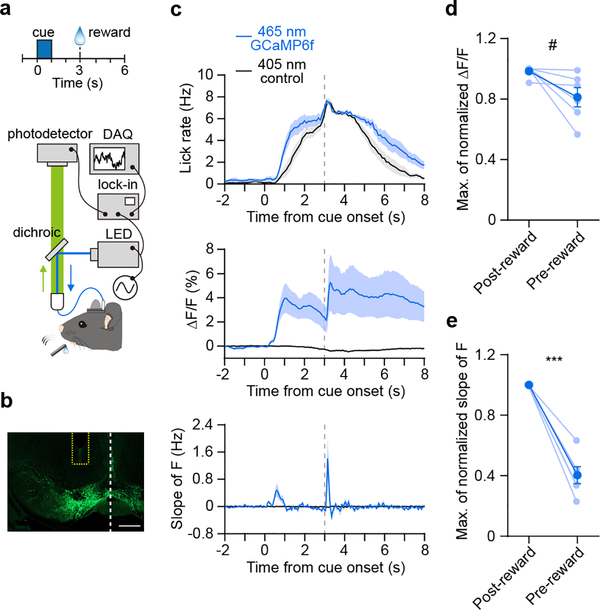
To confirm that DA neurons are not more strongly excited in the pre-reward period, we used fiber photometry 30 to measure calcium signaling in well-trained mice performing the task (n = 6 DAT-Cre mice targeting the VTA, Fig. 3a, 3b). In each recording we first measured 50 trials at 465 nm excitation tuned for GCaMP6f fluorescence, followed by 50 trials at 405 nm excitation to check for time-dependent changes in autofluorescence (Fig. 3c). In addition to using the autofluorescence signal as a control, we recorded at 465 nm excitation from a group of animals expressing GFP in the VTA, and found comparably low amplitude signals (n = 3 mice, Supplementary Fig. 4). GCaMP6f fluorescence signals showed an increase during both the pre-and post-reward period (Fig. 3c middle). On average, the maximum activity was higher in the post-reward period (Fig. 3d). We also examined the slope of the photometric signal, which has been found to have a more precise temporal relationship to spiking activity 31. The slope of the signal transiently increased during the cue and reward delivery time (Fig. 3c bottom), resembling the electrophysiological activity pattern of some putative DA neurons observed here (Fig. 2) as well as other studies 24. The maximum slope of the signal was significantly greater in the post-reward period (Fig. 3e). Thus, by both means of analyzing photometric data, on average DA neurons were not preferentially excited in the pre-reward period, in qualitative agreement with the electrophysiological measurements. Taken together, these data suggest that the stronger behavioral effect of post-reward DA neuron inhibition is neither due to higher cue-evoked activity, nor weaker suppression of cue-evoked firing by the laser.
Fig. 3. Fiber photometry measurements of VTA DA neuron activity.
a. (Top) Trial structure of the Pavlovian reward conditioning task used during the photometry measurements. (Bottom) Illustration of fiber photometry setup.
b. GCaMP6f viral expression and approximate position of the photometric optical fiber (dashed yellow line) targeting the lateral VTA (including medial SNc). Dashed white line indicates the midline. Scale bar: 0.5 mm.
c. (Top) Mean lick rate as a function of time (n = 6 DAT-Cre mice). (Middle) Mean fractional change in photometry signal as a function of time. (Bottom) Mean slope of the photometry signal as a function of time. Blue lines represent data collected with 465 nm excitation (GCaMP6f signal), and black lines represents data collected with 405 nm excitation (autofluorescence control signal).
d. Maximum value of the normalized fractional GCaMP6f fluorescence change in the pre-reward (0 – 3 s) and post-reward (3 – 5 s) period (n = 6 mice, two-sided paired t-test, t5 = 2.5, #P = 0.056).
e. Maximum value of the normalized slope of the GCaMP6f fluorescence signal in the pre- and post-reward period (n = 6 mice, two-sided paired t-test, t5 = 10.7, ***P = 0.0001). Data are expressed as mean ± SEM.
For comparison, we performed electrophysiological recordings to examine the relative amount of pre- and post-reward activity in M2 (n = 5 C57Bl/6J mice, Supplementary Fig. 5). As with DA neurons, while there were increases in both time periods, the maximum firing occurred after reward. Thus, there does not appear to be a clear correspondence between the relative magnitude of peak neural activity in the pre- and post-reward period, and the differential behavioral effects caused by inhibition of DA or M2 neurons.
Prolonged DA neuron inhibition does not compound behavioral effects
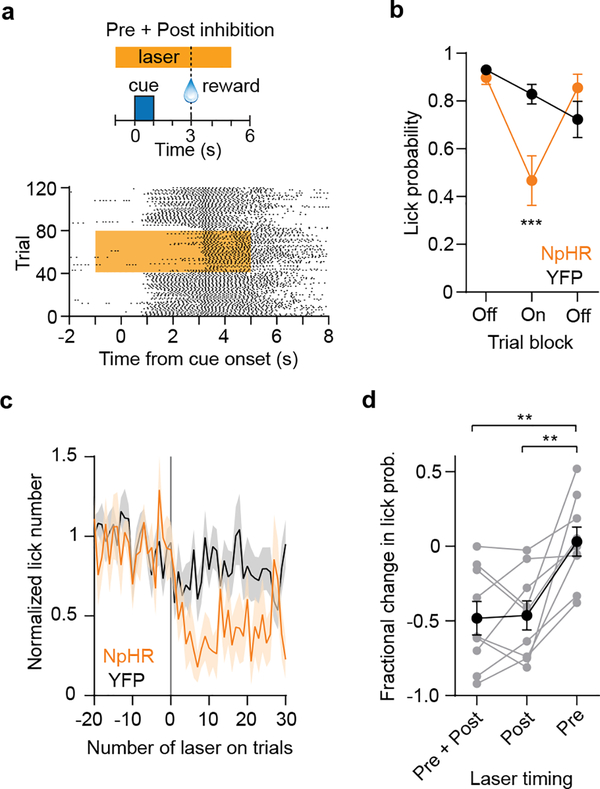
There is some evidence that longer duration pauses in DA activity may be less effective at altering behavior 32. This raises the potential concern that the differential behavioral effects we observed are due to the unequal laser duration in the two conditions. In addition, optogenetically inhibited neurons can display rebound excitation effects following abrupt cessation of the laser stimulus 32, as observed for some neurons recorded in the VTA (Fig. 2d, Extended Data Fig. 1b left). In the experiments with pre-reward DA neuron inhibition, the laser was abruptly terminated at the time of reward delivery, raising a further potential concern that this leads to spurious neural excitation, which may have counteracted the intended inhibitory effect. To address these issues, in a subset of animals used in Fig. 1 (n = 9 eNpHR3.0+ and 13 YFP+ mice targeting VTA) we delivered a prolonged laser stimulus spanning both the pre- and post-reward time period (continuous 6 s laser, Fig. 4a). This prolonged stimulus would delay the rebound excitation effect with respect to the reward time, allowing any contribution of pre-reward inhibition to be unmasked. We reasoned that if DA neuron activity in both the pre- and post-reward period is strongly required for anticipatory licking, then prolonged inhibition would produce a behavioral deficit that was greater than post-reward inhibition by itself. The prolonged stimulus led to a significant reduction in anticipatory licking (Fig. 4b, 4c). However, the magnitude of this effect was statistically similar to post-reward inhibition (Fig. 4d). These findings suggest that the differential effects of pre- and post-reward DA inhibition are neither caused by differences in laser duration, nor optogenetic rebound activity. Since prolonged DA neuron inhibition was only as effective as post-reward inhibition by itself, these results further demonstrate that the most behaviorally important time period for VTA DA neuron activity is after the time of reward delivery.
Fig. 4. Prolonged DA neuron inhibition does not compound behavioral effects.
a. (Top) Trial structure of the Pavlovian reward conditioning task, in which a prolonged laser stimulus to inhibit VTA DA neurons was presented for 6 s spanning both the pre- and post-reward period. (Bottom) Lick raster of a mouse expressing eNpHR3.0 in VTA DA neurons.
b. Inhibiting DA neurons in the Pre + Post period significantly reduced the probability of anticipatory licking in the laser block compared to controls (n = 9 eNpHR3.0+ and 13 YFP+ mice, two-way RM ANOVA, group effect: F1,20 = 1.8, P = 0.19, trial block effect: F2,40 = 16.8, P < 0.0001). Post-hoc Sidak’s test: ***P = 0.0002.
c. Mean number of anticipatory licks per animal (n = 9 eNpHR3.0+ and 13 YFP+ mice) as a function of trial number, for prolonged (Pre + Post) laser stimulation. Data are normalized to the mean lick count in the first trial block corresponding to laser off.
d. Fractional change in lick probability (n = 9 eNpHR3.0+ mice, one-way RM ANOVA, F = 15.7, P = 0.0004). Post-hoc Tukey’s test: Pre + Post vs Pre P = 0.002, Post vs Pre P = 0.009, Pre + Post vs Post P = 0.97. Data are expressed as mean ± SEM.
Post-reward DA signals control temporally specific cue-reward associations
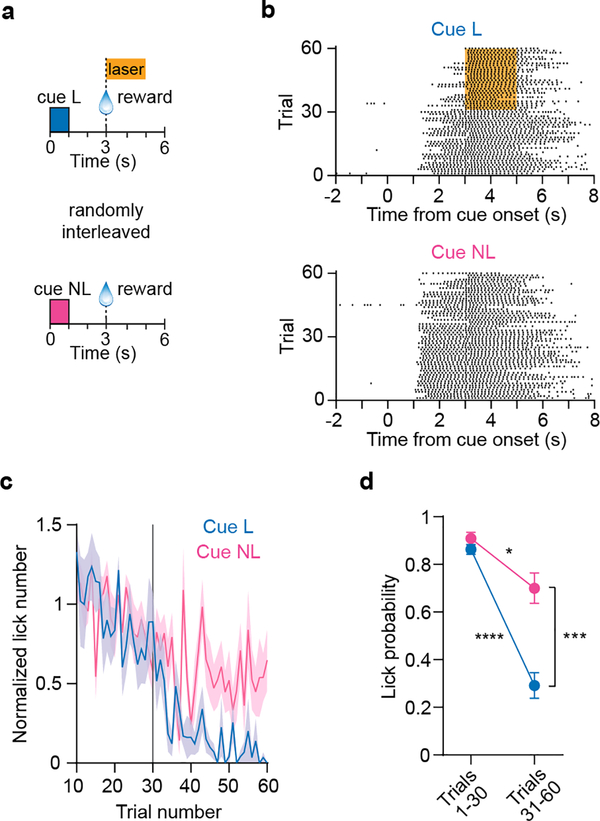
To distinguish whether inhibiting DA neurons during the post-reward period reduces the strength of specific cue-reward associations, or the motivational drive to generate anticipatory licking 14, 15, we trained another group of animals to associate two distinct olfactory cues with an identical type and size of reward (n = 8 eNpHR3.0+ mice targeting VTA). This led to anticipatory licking in response to both cues. During testing in well-trained animals, post-reward DA neuron inhibition was paired with only one of the cues (Fig. 5a). An effect on associative learning would preferentially impair performance on the laser-paired cue, whereas a general deficit in motivation would equally impact responding on both cues. We found that anticipatory licking was significantly more impaired in the laser-paired cue (Fig. 5b–5d). There was also a statistically significant decline in performance associated with the laser unpaired cue, suggesting a small response generalization effect 33. Despite this trend, post-reward DA signals appear to preferentially regulate the strength of associations with specific cues, consistent with a role in learning 34, 35.
Fig. 5. Post-reward DA signals control temporally specific cue-reward associations.
a. Trial structure of a dual cue-reward association task in which two distinct olfactory cues were associated with the same reward, leading to anticipatory licking in response to both cues. During optogenetic testing, well-trained animals received post-reward DA inhibition on a continuous block of trials with cue L (laser, 2 s duration on trials 31 – 60) but not cue NL (no laser). Cue L and NL trials were presented in the same session in random order.
b. Lick raster of a mouse in response to cue L and NL. Orange shaded area indicates duration of post-reward laser stimulus given after cue L.
c. Mean number of anticipatory licks per animal (n = 8 mice) as a function of trial number. Data are normalized to the mean lick count in the first trial block (trials 1 – 30). Cue L is paired with post-reward laser stimulation after trial 30 (grey line).
d. Inhibiting DA signals reduced anticipatory licking associated with cue L significantly more than cue NL (n = 8 eNpHR3.0+ mice, two-way RM ANOVA, cue effect: F1,7 = 24.6, P = 0.002, trial block effect: F1,7 = 86, P < 0.0001). Post-hoc Sidak’s test: *P = 0.032, ***P = 0.0006, ****P < 0.0001. There was no significant difference between cue L and NL licking in the first trial block (P = 0.96). Data are expressed as mean ± SEM.
Post-reward DA signals are sufficient to maintain conditioned responding during extinction
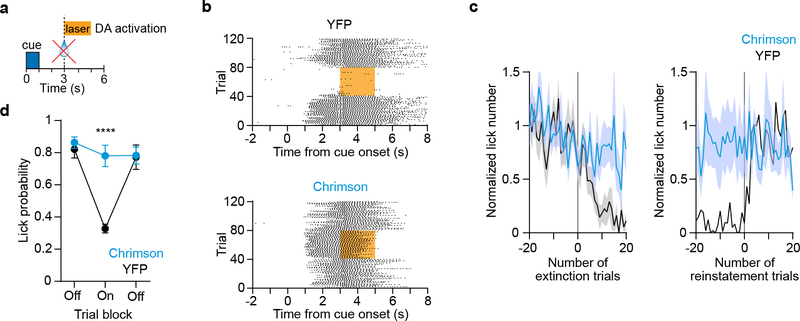
Next, we tested whether post-reward DA neuron activation is sufficient for maintaining conditioned licking responses 10. Mice were trained on the single cue version of the task, and then underwent an extinction test in the second of three trial blocks. During this test we substituted the physical reward (sweetened milk) with a continuous 2 s optical stimulus beginning at the time of expected milk reward (n = 10 Chrimson+ and 8 YFP+ mice targeting VTA, Fig. 6a). Control animals rapidly reduced their responding during extinction, and resumed licking shortly after milk reward reinstatement (Fig. 6b top, 6c). In contrast, activating DA neurons at the time of expected reward led to persistence of anticipatory licking, suggesting cue-reward associations remained mostly intact (Fig. 6b bottom, 6d, Extended Data Fig. 9). To determine whether this effect persists with more biologically relevant optical stimulation parameters 10, we performed experiments with pulsed laser stimuli in a separate group of mice (20 Hz square wave, 10 pulses, 10 ms pulse width), and found similar effects on behavior to those with continuous 2 s stimulation (n = 4 Chrimson+ mice, Extended Data Fig. 10). Thus, even brief (~0.5 s) activation of DA neurons was sufficient to maintain anticipatory licking. Taken together with the optogenetic inhibition experiments, post-reward DA signals appear to bidirectionally control conditioned movements by regulating the strength of stimulus-reward associations 10, 11
Fig. 6. Post-reward DA signals are sufficient to maintain conditioned responding during extinction.
a. Trial structure of a Pavlovian reward conditioning task with extinction, in which the physical reward (milk) was omitted and substituted for VTA DA neuron activation during the post-reward period (2 s laser duration on trials 41 – 80). Reward is given on all other trials.
b. (Top) Lick raster of a YFP+ control animal during the extinction test. Extinction was carried out on trials 41 – 80, which coincided with post-reward optical stimulation (orange shaded area). (Bottom) Lick raster of a Chrimson+ animal during the extinction test.
c. Mean number of anticipatory licks per animal (n = 10 Chrimson+ and 8 YFP+ mice) as a function of trial number. Data are normalized to the mean lick count in the first trial block (trials 1 – 40).
d. Activating DA neurons in the post-reward period during an extinction test maintained a significantly higher probability of anticipatory licking in the laser block compared to controls (n = 10 Chrimson+ and 8 YFP+ mice, two-way RM ANOVA, group effect: F1,16 = 7.7, P = 0.014, trial block effect: F2,32 = 26, P < 0.0001). Post-hoc Sidak’s test: ****P < 0.0001. Data are expressed as mean ± SEM.
Temporal dissection of the post-reward DA signal
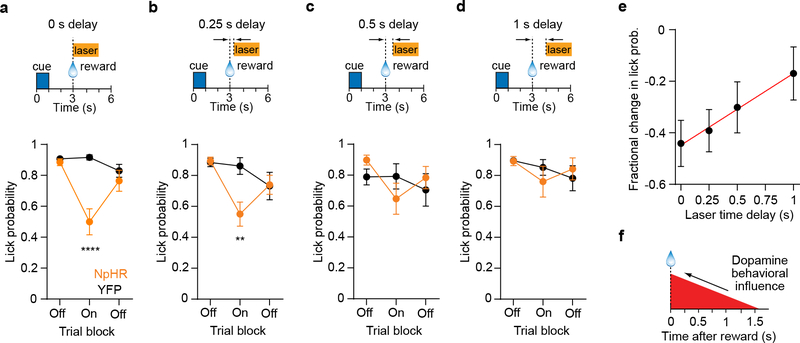
To further deconstruct the time scale for which post-reward DA signaling is necessary, across multiple test sessions, in a subset of animals used in Fig. 1, we parametrically delayed the timing of inhibitory optogenetic stimuli relative to the reward from 0 to 1 s (n = 10 eNpHR3.0+ and 11 YFP+ mice targeting VTA). We expected that when the laser onset time exceeded a certain critical timescale, behavioral performance would no longer be impaired 11. Consistent with this prediction, anticipatory licking probability was significantly reduced relative to controls for a delay of 0 and 0.25 s (Fig. 7a, 7b), but not 0.5 and 1 s (Fig. 7c, 7d). Thus the strongest contribution of DA signaling occurred within 0.25 s of reward delivery. To further characterize the temporal relationship between DA signaling and behavior, we represented the mean fractional change in licking probability as a function of laser delay time. This variable showed a linear time dependence, with an extrapolated time axis intercept of 1.6 s (Fig. 7e). Therefore, on average DA neuron activity appears to have a linearly decreasing effect on the strength of stimulus-reward associations as a function of elapsed time after reward (Fig. 7f).
Fig. 7. Temporal dissection of the post-reward DA signal.
a. (Top) Trial structure of Pavlovian conditioning task with post-reward VTA DA inhibition. The laser onset has a delay of 0 s, and is delivered on trials 41 – 80 (2 s duration). (Bottom) Corresponding anticipatory probability per trial block for eNpHR3.0+ (n = 10 mice) and YFP+ (n = 11 mice) groups. Two-way RM ANOVA, group effect: F1,19 = 10.7, P = 0.004, trial block effect: F2,38 = 12.6, P < 0.0001. Post-hoc Sidak’s test: ****P < 0.0001.
b. (Top) Same trial structure as (a) but the laser onset has a delay of 0.25 s. (Bottom) Anticipatory lick probability per trial block for eNpHR3.0+ (n = 10 mice) and YFP+ (n = 11 mice) groups. Two-way RM ANOVA, group effect: F1,19 = 2, P = 0.17, trial block effect: F2,38 = 9.4, P = 0.005. Post-hoc Sidak’s test: **P = 0.002.
c. (Top) Same trial structure as (a) but the laser onset has a delay of 0.5 s. (Bottom) Anticipatory lick probability per trial block for eNpHR3.0+ (n = 10 mice) and YFP+ (n = 11 mice) groups. Two-way RM ANOVA, group effect: F1,19 = 0.02, P = 0.88, trial block effect: F2,38 = 3.3, P = 0.048. One of the mice in the YFP+ group had a low lick probability (0.425) in the first trial block, and can therefore be considered an outlier. Removing this subject from the ANOVA test did not appreciably change the results (group effect: F1,18 = 0.01, P = 0.94, trial block effect: F2,36 = 4.2, P = 0.02).
d. (Top) Same trial structure as (a) but the laser onset has a delay of 1 s. (Bottom) Anticipatory lick probability per trial block for eNpHR3.0+ (n = 10) and YFP+ (n = 11) groups. Two-way RM ANOVA, group effect: F1,19 = 0.02, P = 0.89, trial block effect: F2,38 = 3.3, P = 0.047.
e. Mean fractional change in lick probability as a function of laser time delay (n = 10 eNpHR3.0+ mice). Red line represents the best line fit to the data. Pearson R = 0.99, P = 0.003. The time axis intercept of the line occurs at 1.6 s (95 % confidence intervals: 1.4 – 2 s).
f. Illustration of the critical time window that requires DA neuron activity for reinforcing cue-reward associations, derived from the results in (e). Data are expressed as mean ± SEM.
Discussion
This work addresses a longstanding question about the involvement of DA neurons in reward-conditioned movement, by showing they primarily influence the reinforcement rather than generation of conditioned responses 20. Importantly, our data do not dispute that the SNc, which is often implicated in motor function and movement disorders 36, has a role in generating movements 18 or selecting actions 37, as shown by the small but significant effect of pre-reward optogenetic inhibition. On the other hand, even for SNc DA neurons, post-reward inhibition produced the strongest behavioral changes. This implies that as a population these neurons are similar to the VTA in that they contribute more to the reinforcement rather than direct generation of conditioned movements. Therefore, our results support the view that there is considerable overlap in the function of VTA and SNc DA neurons 38–41. However, these findings do not rule out the presence of subpopulations of DA neurons, or their projections, with specialized roles in information processing and behavior 28, 42–45. Furthermore, we do not yet know whether our results generalize to behaviors other than Pavlovian anticipatory licking, such as instrumental responses or self-initiated locomotion 16. There may also be important differences between head-fixed and unrestrained animal behavior that were not addressed here.
We confirmed both electrophysiologically and photometrically that DA neurons were activated both pre- and post-reward, with photometric data even suggesting that excitation to rewards was stronger than to cues. These observations may be at odds with the classical description of DA RPE signaling, in which there is an inverse relationship between the pre- and post-reward response. This would lead to a diminishing reward response with more training 8, 12. Since animals in our study performed anticipatory licking with high probability (typically greater than 85 % in block 1), it seems unlikely that the large reward response was due to insufficient training. On the other hand, several studies show a strong reward response in trained animals 20, 22, 24, and one of these suggests that the pre- and post-reward DA signals evolve independently 20. Additionally, in our study we did not explicitly check for RPE coding, and thus cannot rule out that DA neurons represent additional or different information 16, 22, 46. Our results leave open the possibility that pre-reward DA signals are important for functions that were not studied here, such as salience 46, time perception 47, or second order conditioning 48.
In this work we also compared the effect of inhibiting DA neurons to inhibiting a cortical region involved in licking, revealing significant temporal differences in how these circuits regulate conditioned movements. Interestingly, we found that, like DA neurons, M2 neurons also showed increases in activity during both the pre- and post-reward period, with the peak in population-averaged signaling tending to occur after reward. While this does not imply that these regions represent identical information, it appears to signify that the time of peak neural activity does not necessarily predict when the peak behavioral contribution will occur.
The lack of a strong behavioral effect during pre-reward DA neuron inhibition appears inconsistent with another study, showing that optogenetically activating VTA DA neurons is able to confer motivational properties to cues, which drive conditioned approach behaviors 3. However, the other study relied on a conditioning procedure in which the cue partially overlapped in time with the optogenetic reinforcement. Therefore, it is not straightforward to draw parallels with the trace conditioning task used here. Second, the other study addressed the question of sufficiency through increase of function, while here, with the exception of Fig. 6 we focused on the problem of necessity through transient reduction of function experiments. The data therefore suggest that DA neurons may be sufficient under certain conditions 17, but to a lesser extent necessary, for generating movements. Because of floor effects in firing rate, positive changes in DA neuron activity can exceed the magnitude of negative changes, thereby placing different constraints on excitatory and inhibitory optogenetic experiments. Indeed, when another study performed a test for sufficiency using optogenetic stimulation that was matched to physiological levels of DA activity, they failed to produce movement effects 20.
Using electrophysiological recordings combined with optogenetic inhibition, we showed that on average, the activity of putative DA neurons during presentation of cues and rewards was only partially suppressed by laser stimulation (Fig. 2). This raises the possibility that the relatively weak effect of pre-reward DA neuron inhibition on behavior was due to incomplete silencing of activity in this time period. On the other hand, we found that in the same animals, a similar fractional level of reduction in post-reward DA signaling was capable of producing substantial deficits in anticipatory licking. Therefore, these results suggest that conditioned movements are significantly more sensitive to changes in post- rather than pre-reward DA signaling.
Previous studies have already indicated a temporally specific role of DA signaling in associative learning 10, 11, 34. Here we refined these observations by parametrically varying the time of DA neuron inhibition in the post-reward period. These experiments revealed that the effectiveness of DA neurons in regulating the strength of stimulus-reward associations decreases approximately linearly as a function of elapsed time after reward (Fig. 7e). Assuming that the linear relationship can be extrapolated further in time, we estimated the upper time bound for DA-mediated reinforcement learning to be around 1.6 s (Fig. 7f). This temporally restricted functional role appears to enable animals to selectively regulate the strength of associations between specific cues and rewards. This was further supported by experiments involving two cues (Fig. 5), which showed a selective reduction in conditioned responding to the cue associated with the optogenetically manipulated reward 35.
DA is thought to modulate the strength of associations by altering synaptic transmission at midbrain projections, such as the corticostriatal pathway 49. An in vitro study of structural plasticity in the striatum found a brief critical time scale (0.3 to 2 s), in which DA delivered after glutamatergic input led to dendritic spine enlargement 50. Thus, there is now complementary evidence pointing to a narrow time window on the order of 1 s for DA-mediated associative learning. Taken together, this work places significant time bounds on the role of DA neuron signaling in controlling classically conditioned movements. These findings have potentially important implications for interpreting the results of DA pharmacological, chemogenetic, and lesion studies, which often lack the temporal precision to resolve between pre- and post-reward signaling effects. Finally, this work underscores the need for approaches to dissect the role of brain circuit activity at specific time points during behavior 23.
Methods
Animals
Male heterozygous DAT-Cre mice (DATIREScre knock-in mice, stock no. 006660, The Jackson Laboratory) 51, 8–12 wks were used for optogenetic manipulation of dopaminergic neurons. The mice were maintained as heterozygous in a C57Bl/6J background (stock no. 000664, The Jackson Laboratory). For optogenetic manipulation of excitatory cortical neurons, male C57Bl/6J mice were used. Animals were kept on a 12 hr light cycle, and group housed until the stereotaxic surgery. All procedures were approved by the University of California, Los Angeles Chancellor’s Animal Research Committee.
Surgical procedures
Animals underwent a surgical procedure under aseptic conditions and isoflurane anesthesia on a stereotaxic apparatus (Model 1900, Kopf Instruments). The procedure involved attaching stainless steel head fixation bars on the skull, injecting adeno-associated virus (AAV), and fiber-optic implantation in the targeted region. AAV was obtained from the University of North Carolina Vector Core, and injected by pulled glass pipettes (Nanoject II, Drummond Scientific). For experiments involving optogenetic manipulation of DA neurons in DAT-Cre mice, 500 nL of either AAV5/EF1a-DIO-eNpHR3.0-eYFP 52, AAV5/Syn-Flex-ChrimsonR-tdTomato 53, AAV5/EF1a-DIO-eYFP(or mCherry) was bilaterally injected into the VTA (coordinates relative to bregma: 3.08 mm posterior, 1.0 mm lateral, 4.0 mm ventral) or lateral SNc (3.08 mm posterior, 1.55 mm lateral, 3.9 mm ventral). Viral constructs targeting the VTA were also expressed in areas of the medial SNc (Fig. 1f top, Supplementary Fig. 2). For experiments involving optogenetic manipulations of excitatory cortical neurons, 300 nL of AAV5/CaMKIIa-eNpHR3.0-eYFP or AAV5/CaMKIIa-eYFP was bilaterally injected in M2 (coordinates relative to bregma: 2.5 mm anterior, 1.5 mm lateral, 1.2 mm ventral). After viral injection, ferrule-coupled optical fibers (0.2 mm diameter, 0.22 NA, Thor Labs) were bilaterally implanted, terminating about 0.2 mm above the viral injection site. For experiments involving fiber photometry, 500 nL of AAVDJ/EF1a-DIO-GCaMP6f 54 or AAV5/Flex-GFP was unilaterally injected into the VTA (3.08 posterior, 0.8 mm lateral, 4.2 mm ventral). A low autofluorescence optical fiber (0.4 mm diameter, 0.48 NA, Doric Lenses) was implanted at the same coordinates. All animals were individually housed after surgery, and a daily carprofen injection (5 mg/kg, s.c.) was administered for the first three days post-operatively. Analgesics (ibuprofen) and antibiotics (amoxicillin) were administered in the drinking water for the first week post-operatively. The animals recovered for at least 2 wks before beginning habituation and behavioral conditioning (see Behavioral task).
Behavioral task
Mice were food restricted to maintain their weight at around 90 % of their baseline level, and given water ad libitum. Animals were initially habituated to the head fixation apparatus and to reliably consume uncued rewards (5 μL, 10 % sweetened condensed milk), which were delivered via actuation of an audible solenoid valve. The reward delivery and infrared lick detection port was located around 5 mm directly in front of the mouth, and animals had to extend their tongue out of the mouth to register as a lick. Subsequently, animals were trained on a Pavlovian reinforcement task using an olfactory cue, consisting of isoamyl acetate diluted 1:10 in mineral oil, and diluted another factor of 10 by mixing with clean air in an olfactometer (total air flow was 1.5 L/min). Each trial consisted of a conditioned stimulus (1 s odor), followed by a 2 s delay, and an unconditioned stimulus (reward). Daily training sessions involved 100 trials (25 ± 5 s intertrial interval), and animals were well-trained for 3 to 5 days before optogenetic testing, or beginning the dual cue-reward association task (Fig. 5). For the training on the dual cue-reward association task, another olfactory cue (citral, diluted 1:10 in mineral oil, 1 s duration) paired with an identical delay period and reward was introduced. The two types of cue-reward trials were presented together in the same sessions, in random order (60 trials of each cue type) for an additional 3 to 5 days before optogenetic testing, by which time animals licked equally to both cues.
Optogenetic testing
All optogenetic behavioral tests involved bilateral optical stimulation (589 nm, 10 mW power at each fiber output, MGL-F-589–100mW, CNI Laser). In all optogenetic behavioral tests experiments except the dual cue-reward association task (Fig. 5) and the random laser stimulation test (Extended Data Fig. 5), testing was comprised of three consecutive 40 trial blocks corresponding to laser ‘Off’ (block 1), ‘On’ (block 2), ‘Off’ (block 3) (occasionally, blocks contained 39 to 46 trials instead of exactly 40 trials). For the dual cue-reward association task, testing was comprised of two consecutive 30 trial blocks for each cue corresponding to laser ‘Off” (block 1) and ‘On’ (block 2). In the random laser stimulation test, instead of a block structure we introduced optical stimulation on 50 % of randomly chosen trials (100 trials total). For extinction tests (Fig. 6), optical stimulation was never given on the same trial as a milk reward. Several animals underwent multiple test sessions on separate days representing different laser stimulation conditions (e.g., pre-reward, post-reward with 0 s delay, post-reward with 0.25 s delay, post-reward with 0.5 s delay, post-reward with 1 s delay, and pre + post; each condition was tested at most once per animal). A subset of the VTA-targeted animals used in Fig. 1 were also used for experiments in Fig. 4 (n = 9 eNpHR3.0+ and 13 YFP+ mice), and Fig. 7 (n = 9 eNpHR3.0+ and 11 YFP+ mice). To minimize any bias in behavior from the preceding sessions, the order of different laser stimulation conditions in Fig. 1, 4, and 7 was pseudo-randomized.
Reward size reduction test
We examined the effect of reducing the reward size in a separate group of mice which did not receive viral injections or optical fiber implants. Mice were first trained to lick on the Pavlovian conditioning task using the standard reward volume of 5 μL. We then carried out two test sessions, in which the reward was reduced to 2 or 3 μL in the second trial block. The order of the 2 and 3 μL sessions was pseudo-randomized.
Immunohistochemistry
Mice were anaesthetized and transcardially perfused with 24 °C phosphate-buffered saline (pH 7.3) and ice-cold paraformaldehyde. Brains were placed in paraformaldehyde overnight, and were cut as coronal sections with a thickness of 100 μm on a vibratome. Sections were blocked using normal serum, then incubated overnight at 4 °C with chicken anti-GFP (ab13970, Abcam) as the primary antibody (1:1000 dilution). After washing three times with PBS, the sections were incubated at 4 °C with Alexa Fluor 488–conjugated donkey antibody to chicken IgG (703–545-155, Jackson ImmunoResearch) as the secondary antibody (1:200 dilution) for 4 hrs. Sections were mounted using tissue mounting medium, and imaged under a confocal or epifluorescence microscope.
Behavioral data analysis
Anticipatory licking was defined as a bout of licking that began 0 – 3 s after cue onset (i.e., before reward delivery). Trials in which spontaneous licking occurred up to 1 s prior to cue onset were not counted as anticipatory lick trials. Consummatory licking probability was defined as the fraction of trials in which mice licked within 2 s of reward delivery, coinciding with the duration of the post-reward laser stimulus. For a test session to be included in the analysis, the anticipatory lick probability in block 1 had to exceed 0.6 for DA inhibition with eNpHR3.0, and 0.55 for DA activation with Chrimson. Animals that did not meet these pre-established performance criteria during the training phase were excluded from analysis. This ensured that on each test session, animals had a consistent starting level of anticipatory licking performance in block 1 prior to block 2 with laser stimulation. The fractional change in lick probability or number per animal was calculated from the expression:
For the fractional change in lick probability, L1 and L2 represent the fraction of anticipatory lick trials in blocks 1 and 2, respectively. For the fractional change in lick number, L1 and L2 represent the mean number of licks per trial occurring within 0 – 3 s of cue onset in blocks 1 and 2, respectively. The bias factor was calculated from the expression:
Positive and negative bias factor values indicate a greater effect of post- or pre-reward inhibition, respectively.
Electrophysiology
To confirm that optical stimulation suppresses neuronal firing, in another set of animals we virally expressed eNphR3.0 in VTA DA neurons or M2 excitatory neurons (see Surgical Procedures), without implanting a permanent optical fiber. After 3 wks we performed a second surgical procedure under isoflurane anesthesia to drill a small rectangular craniotomy over the region of interest. After animals awoke, they were head-fixed, and we inserted a 64 or 256 electrode silicon microprobe attached to an optical fiber 55 in the region of interest (Extended Data Fig. 1). Recordings were carried out at 25 kHz sampling rate using a commercial multichannel data acquisition (DAQ) system (C3316 and C3004, Intan Technologies). For recordings of spontaneous firing in the absence of behavior (Extended Data Fig. 1, 7a–7c), we delivered pulses of light (10 mW output from the fiber tip, 5 s continuous laser duration, 20 or 40 trials, 25 – 35 s intertrial interval). For recordings in the VTA during behavior and optogenetic inhibition (Fig. 2, Extended Data Fig. 8), we presented a total of about 90 trials, approximately one third with no laser, one third with laser in the pre-reward period, and one third with laser in the post-reward period, with the trial type order randomized. Recordings in M2 during behavior were carried out with a 256 electrode silicon microprobe. Prior to insertion the shafts of the probe were coated with fluorescent dye (DiD, Thermo Fisher Scientific). Spike sorting was carried out using open-source Kilosort software 56. For analysis of optogenetically induced changes in spontaneous firing, the rate modulation index was calculated as the ratio:
where Rlaser and Rbaseline respectively represent the average number of spikes in the 5 s laser period, and a 5 s baseline period immediately preceding the laser stimulus. For analysis of optogenetically induced changes in task-evoked firing, we first identified putative DA neurons by examining the temporal profile of neural responses on laser-free trials using methods introduced by Cohen et al. 24. DA neuron identification involved calculating the area under the receiver operating characteristic (auROC) curve in time steps of 100 ms. Values less than or greater than 0.5 respectively indicate a decrease or increase in firing relative to a 1 s baseline period prior to cue presentation. This was followed by PCA using singular value decomposition of the auROC time series, and agglomerative hierarchical clustering of the first three PC values. This yielded three clusters, which were named Type I, II, III to qualitatively match the three types reported by Cohen et al. 24. Only the Type I cluster (with units frequently showing phasic responses to cues and/or rewards) was previously found to contain DA neurons. Type II cells tended to show sustained excitation, while Type III showed sustained inhibition (Extended Data Fig. 8a). The fractional change in firing of Type I cells with laser delivered in the pre- or post-reward period was calculated as:
where Ron represents the mean firing rate on trials with laser, and Roff represents the mean firing rate on trials without laser. To compare the maximum activity in the pre- and post-reward period, the time series of each cell’s firing rate in steps of 50 ms was first normalized by the maximum value measured between 0 – 5 s from cue onset.
Fiber photometry
Photometry was carried out in well-trained mice using lock-in measurement 30. The optical fiber implant was coupled via a fiber patch cord to a four port connectorized fluorescence mini cube (FMC4_AE(405)_E(460–490)_F(500–550)_S, Doric Lenses), with two excitation ports (460 – 490 nm for GCaMP6f fluorescence and 405 nm for autofluorescence), and a detection port in the 500 – 550 nm band. Optical excitation was provided by 465 and 405 nm LEDs sinusoidally oscillated from 10 – 100 μW at 211 Hz, the emitted signal was detected by a low noise femtowatt photoreceiver (Model 2151, Newport), connected to a lock-in amplifier (SR810, Stanford Research Systems). The demodulated signal was sampled at 25 kHz by a DAQ (Intan Technologies). During recording in each animal, the first set 50 trials of behavior was collected at 465 nm excitation, and a second set of 50 trials was collected in the same session at 405 nm excitation. Animals performed anticipatory licking in both sets of trials, though performance was reduced slightly in the second set (Fig. 3c top). Offline analysis involved downsampling the signal to 1,000 Hz, and then to 20 Hz. The fractional change in fluorescence was calculated with respect to the average baseline signal in a 5 s baseline period prior to the cue. The slope was calculated by applying the Matlab diff function to the downsampled data and dividing by the time bin size (0.05 s), with the resulting values having units of inverse time (Hz). The fluorescence signal at 465 nm excitation exceeded the 405 nm control signal (Fig. 3c middle and bottom), and we did not apply any correction factor to the GCaMP6f signal to adjust for autofluorescence. To compare the maximum activity in the pre- and post-reward period, the signal from each animal was first normalized by the maximum value measured between 0 – 8 s from cue onset.
Statistics
Statistical analysis was carried out with standard functions in Matlab (Mathworks) and Prism (Graphpad Software). Data collection and analysis were not performed blind to the conditions of the experiments. No statistical methods were used to pre-determine sample sizes but our sample sizes are similar to those reported in previous publications 3, 18. The sample size, type of test, and p-values are indicated in the figure legends. Data distribution was assumed to be normal but this was not formally tested. T-tests were always two-sided. One-way ordinary or repeated measures (RM) analysis of variance (ANOVA) was followed by Tukey’s post-hoc test for multiple comparisons. Two-way RM ANOVA was followed by Sidak’s post-hoc test for multiple comparisons. The p-value of Pearson correlations was calculated with the Matlab corrcoef function. All data and error bars represent the mean and standard error of the mean (SEM). In all figures, the convention is # P < 0.06, * P < 0.05, ** P < 0.01, *** P < 0.001, **** P < 0.0001. Additional information can be found in the Life Sciences Reporting Summary.
Data availability
The data that support the findings of this study are available from the corresponding author upon request. The numerical data shown in the figures are provided as Source Data files.
Code availability
Custom Matlab code for analysis of behavior and neural activity is available from the corresponding author upon request.
Extended Data
Extended Data Fig. 1: Optogenetic inhibition of spontaneous activity in the VTA, in the absence of behavior.
(A) (Top) Illustration of recording with a 64 electrode silicon microprobe during optogenetic inhibition of VTA DA neurons. (Bottom) Silicon microprobe with attached optical fiber under bright field and laser illumination. Scale bars: 0.2 mm.
(B) Spike raster (top) and mean firing rate versus time (bottom) of two VTA neurons in response to optogenetic inhibition. Orange bar indicates the duration of the laser stimulus. Insets show the spike waveform of each unit in blue (scale bar: 1 ms). Note the rebound excitation effect by the left unit.
(C) Firing rate modulation index distribution of 142 VTA neurons from 4 mice in response to optogenetic inhibition. The mean value was significantly less than zero (two-sided paired t-test, t141 = −5.6, P < 0.0001). Data are expressed as mean ± SEM.
Extended Data Fig. 2: Effect of post-reward VTA DA neuron inhibition on anticipatory licking.
a (Left) Trial structure of Pavlovian conditioning task with post-reward VTA DA inhibition. (Right) Mean lick rate versus time for NpHR3.0 (n = 18) and YFP (n = 14) expressing animals undergoing post-reward inhibition. Black and green lines represent block 1 (trials 1 – 40, laser off) and block 2 (trials 41 – 80, laser on), respectively.
b (Left) During post-reward inhibition, anticipatory lick number was significantly reduced in the laser block compared to controls (n = 18 eNpHR3.0+ and 14 YFP+ mice, two-way RM ANOVA, group effect: F1,30 = 2.4, P = 0.13, trial block effect: F2,60 = 24.8, P < 0.0001). Post-hoc Sidak’s test: **P = 0.003. (Right) Anticipatory lick onset time was not significantly altered in the laser block relative to controls (two-way RM ANOVA, group effect: F1,30 = 0.0001, P = 0.99, trial block effect: F2,60 = 9.2, P = 0.0003).
c Mean number of anticipatory licks per animal (n = 18 eNpHR3.0+ and 14 YFP+ mice) as a function of trial number, for post-reward laser stimulation. Data are normalized to the mean lick count in the first trial block corresponding to laser off. Data are aligned to the start of the third trial block. Data are expressed as mean ± SEM.
Extended Data Fig. 3: Reward size reduction resembles post-reward DA neuron inhibition.
a (Top) Schematic illustration the test using reduced reward size. The reward was reduced from 5 μL in block 1 to 2 or 3 μL in block 2, then reinstated to 5 μL in block 3. (Middle and bottom) Mean lick rate versus time for a reduced reward of 2 and 3 μL (n = 7 mice). Black and green lines represent trial blocks 1 and 2, respectively
b. Anticipatory lick probability in each of the three trial blocks for the two reduced reward conditions (n = 7 mice, two-way RM ANOVA, reward size effect: F1,6 = 34.2, P = 0.001, trial block effect: F2,12 = 27, P < 0.0001. Post-hoc Sidak’s test: ****P < 0.0001.
c. Mean normalized number of anticipatory licks per animal as a function of trial number for the two reduced reward size conditions. Left plot shows data aligned to the start of block 2, and right plot shows data aligned to the start of block 3.
d. Fractional change in anticipatory licking probability as a function of reward size in block 2 (n = 7 mice, one-way RM ANOVA, F = 37.6, P < 0.0001). Post-hoc Tukey’s test: 2 vs 3 μL P = 0.002, 2 vs 5 μL P = 0.0004, 3 vs 5 μL P = 0.09. Data are expressed as mean ± SEM.
Extended Data Fig. 4: Comparison of pre and post-reward VTA DA neuron inhibition on behavior.
a. (Left) Trial structure of Pavlovian conditioning task with pre-reward VTA DA inhibition. (Right) Mean lick rate versus time for NpHR3.0 (n = 18) and YFP (n = 14) expressing animals undergoing pre-reward inhibition. Black and green lines represent trial blocks 1 and 2, respectively.
b. (Left) Anticipatory lick number in each of the three trial blocks during pre-reward inhibition (n = 18 eNpHR3.0+ and 14 YFP+ mice, two-way RM ANOVA, group effect: F1,30 = 0.005, P = 0.94, trial block effect: F2,60 = 23.3, P < 0.0001). (Right) Anticipatory lick onset time in each of the three trial blocks during pre-reward inhibition (two-way RM ANOVA, group effect: F1,30 = 0.1, P = 0.73, trial block effect: F2,60 = 30.1, P < 0.0001).
c. Mean normalized number of anticipatory licks per animal as a function of trial number during pre-reward VTA DA inhibition (n = 7 mice). Left plot shows data aligned to the start of block 2, and right plot shows data aligned to the start of block 3.
d. The fractional change in anticipatory lick number was significantly more reduced by post-reward VTA DA inhibition (n = 18 eNpHR3.0+ mice, two-sided paired t-test, t17 = 5.6, ****P < 0.0001).
e. Control experiments with YFP expression. (Left) Fractional change in anticipatory lick probability caused by pre- and post-reward inhibition (n = 14 YFP+ mice, two-sided paired t-test, t13 = 0.9, P = 0.37). (Right) Fractional change in anticipatory lick number caused by pre- and post-reward inhibition (two-sided paired t-test, t13 = 1.9, P = 0.074). Data are expressed as mean ± SEM.
Extended Data Fig. 5: Effect of SNc DA neuron inhibition with random laser trial schedule.
a. (Top) Trial structure of a Pavlovian reward conditioning task, in which pre-reward laser stimulation was given to SNc DA neurons on random trials (50 %) rather than in a continuous block of trials as with other experiments in this study. (Bottom left) The probability of generating anticipatory licks was significantly reduced on trials with laser compared to laser off trials (n = 9 eNpHR3.0+ mice, two-sided paired t-test, t8 = 4.7, **P = 0.002). (Bottom right) The mean anticipatory lick onset time was increased on trials with laser (n = 9 eNpHR3.0+ mice, two-sided paired t-test, t8 = 2.3, #P = 0.051).
b. Comparison of random trial versus continuous 40 trial block SNc DA neuron inhibition in the pre-reward period. (Left) Anticipatory lick probability (n = 9 eNpHR3.0+ mice, two-sided paired t-test, t8 = 0.7, P = 0.52). (Right) Anticipatory lick number (n = 9 eNpHR3.0+ mice, two-sided paired t-test, t8 = 0.5, P = 0.64). Data are expressed as mean ± SEM.
Extended Data Fig. 6: Comparison of pre and post-reward SNc DA neuron inhibition on behavior.
a. (Top) Lick raster of a mouse during post-reward SNc DA inhibition. (Bottom) Lick raster of the same mouse during pre-reward SNc DA inhibition. Orange shaded area indicates timing of the laser stimulus given on trials 41 – 80.
b. Mean lick rate versus time on sessions with post-reward (top) and pre-reward (bottom) SNc DA neuron inhibition (n = 9 eNpHR3.0+ mice). Black and green lines represent trial blocks 1 and 2, respectively.
c. Mean normalized number of anticipatory licks per animal as a function of trial number during pre-reward (blue) and post-reward (red) SNc DA inhibition (n = 9 eNpHR3.0+ mice). Left plot shows data aligned to the start of block 2, and right plot shows data aligned to the start of block 3.
d. The fractional change in anticipatory lick number was significantly more reduced by post-reward SNc DA inhibition (n = 9 eNpHR3.0+ mice, two-sided paired t-test, t8 = 2.6, *P = 0.03). Data are expressed as mean ± SEM.
Extended Data Fig. 7: Optogenetic inhibition of M2 excitatory neurons and behavioral effects.
a. Spike raster (top) and mean spontaneous firing rate versus time (bottom) of an M2 neuron in response to optogenetic inhibition, in the absence of behavior. Orange bar indicates the duration of the laser stimulus. Inset shows the corresponding spike waveform in blue (scale bar: 1 ms).
b. Firing rate modulation index distribution of 232 M2 neurons from 3 mice in response to optogenetic inhibition. The mean value was significantly less than zero (two-sided paired t-test, t231 = −19.8, P < 0.0001).
c. Mean firing rate versus time of all M2 units during optogenetic inhibition (n = 232). d. Histologically determined optical fiber tracks for the 9 eNpHR3.0+ mice targeting M2 for behavioral experiments in Fig. 1. Grid lines are spaced 1 mm apart.
e. Mean normalized number of anticipatory licks per animal as a function of trial number during pre-reward (blue) and post-reward (red) M2 inhibition (n = 9 eNpHR3.0+ mice). Left plot shows data aligned to the start of block 2, and right plot shows data aligned to the start of block 3.
f. Mean lick rate versus time on sessions with post-reward (top) and pre-reward (bottom) M2 neuron inhibition (n = 9 eNpHR3.0+ mice). Black and green lines represent trial blocks 1 and 2, respectively.
g. (Top) Trial structure of the Pavlovian reward conditioning task with pre-reward inhibition in M2. Orange bar indicates the timing of the laser. (Bottom) Inhibiting M2 excitatory neurons in the pre-reward period significantly reduced the anticipatory lick probability relative to controls (n = 9 eNpHR3.0+ and 9 YFP+ mice, two-way RM ANOVA, group effect: F1,16 = 1.6, P = 0.23, trial block effect: F2,32 = 4, P = 0.03). Post-hoc Sidak’s test: **P = 0.009.
h. The fractional change in anticipatory lick number was significantly more reduced by pre-reward M2 inhibition (n = 9 eNpHR3.0+ mice, two-sided paired t-test, t8 = 9.9, ****P < 0.0001). Data are expressed as mean ± SEM.
Extended Data Fig. 8: Electrophysiological recordings during optogenetic DA neuron inhibition in behaving mice.
a. auROC time series plots of 140 cells recorded from 5 mice, after hierarchical clustering yielded three types of clusters. There were 85 Type I cells (putative DA neurons), 36 Type II cells, and 19 Type III cells.
b. First three principal components of each cell’s auROC, color-coded by cluster type.
c. Mean firing rate versus time of one Type II cluster cell on laser-free trials (n = 28 trials).
d. Mean firing rate versus time of one Type III cluster cell on laser-free trials (n = 28 trials).
e. Mean baseline firing rate of cells in each type of cluster (n = 85 Type I, 36 Type II, 19 Type III, one-way ANOVA, F2,137 = 6.2, P = 0.003). Post-hoc Tukey’s test: Type I vs II P = 0.02, Type I vs III P = 0.02, Type II vs III P = 0.89.
f. (Left) The mean firing rate of Type II cells in the post-reward period was not significantly reduced by application of post-reward laser (n = 36 cells, two-sided paired t-test, t35 = 1.6, P = 0.12). (Right) The mean firing rate of Type II cells in the pre-reward period was not significantly reduced by application of pre-reward laser (n = 36 cells, two-sided paired t-test, t35 = 0.7, P = 0.52).
g. (Left) The mean firing rate of Type III cells in the post-reward period was not significantly reduced by application of post-reward laser (n = 19 cells, two-sided paired t-test, t18 = 0.4, P = 0.68). (Right) The mean firing rate of Type III cells in the pre-reward period was not significantly reduced by application of pre-reward laser (n = 19 cells, two-sided paired t-test, t18 = 1.4, P = 0.17).
h. Cumulative distribution of the fractional change in pre- and post-reward firing caused by the laser, for Type I cluster cells. Data are expressed as mean ± SEM.
Extended Data Fig. 9: Behavioral effect of VTA DA neuron activation during reward extinction.
a. (Top) Trial structure of a Pavlovian reward conditioning task with extinction, in which the physical reward (milk) reward was omitted and substituted for VTA DA neuron activation during the post-reward period (2 s continuous laser duration on trials 41 – 80). Reward was given on all other trials. (Bottom) Histologically determined optical fiber tracks for the 10 Chrimson+ mice targeting the VTA for behavioral experiments in Fig. 6. Grid lines are spaced 1 mm apart.
b. Mean lick rate versus time for YFP (n = 8, top) and Chrimson (n = 10, bottom) expressing animals undergoing reward extinction with 2 s continuous laser stimulation. Black and green lines represent trial blocks 1 and 2, respectively.
c. (Left) Activating VTA DA neurons during extinction maintains a higher number of anticipatory licks in the laser block compared to controls (n = 10 Chrimson+ and 8 YFP+ mice, two-way RM ANOVA, group effect: F1,16 = 0.1, P = 0.79, trial block effect: F2,32 = 18.3, P < 0.0001). Post-hoc Sidak’s test: *P = 0.036. (Right) Activating VTA DA neurons during extinction does not have a significant effect on anticipatory lick onset time compared to controls (two-way RM ANOVA, group effect: F1,16 = 0.4, P = 0.52, trial block effect: F2,32 = 6.5, P = 0.004). Data are expressed as mean ± SEM.
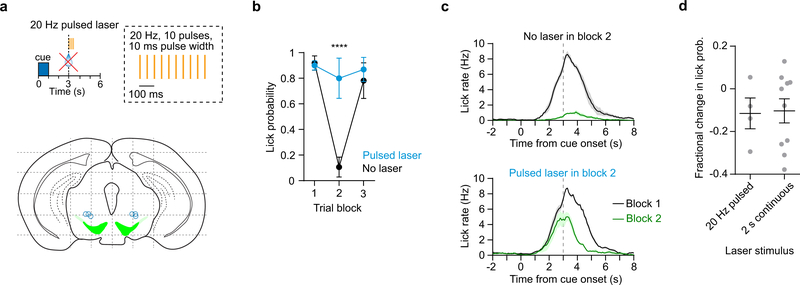
Extended Data Fig. 10: Similar effect of pulsed and continuous laser stimulation during reward extinction.
a. (Top) Illustration of the pulsed laser stimulation (as opposed to 2 s continuous used in Fig. 6) protocol used to activate DA neurons during reward extinction. (Bottom) Histologically determined optical fiber tracks for the 4 Chrimson+ mice targeting the VTA. Grid lines are spaced 1 mm apart.
b. Anticipatory lick probability in each of the three trial blocks on extinction sessions with laser (blue) and without laser (black) (n = 4 Chrimson+ mice, two-way RM ANOVA, group effect: F1,3 = 30.2, P = 0.01, trial block effect: F2,6 = 40.9, P = 0.0003. Post-hoc Sidak’s test: ****P < 0.0001.
c. Mean lick rate versus time for Chrimson expressing animals undergoing reward extinction on extinction sessions without laser (top) and with pulsed laser stimulation (bottom) (n = 4 mice). Black and green lines represent trial blocks 1 and 2, respectively.
d. Fractional change in anticipatory lick probability during reward extinction experiments with 2 s continuous (n = 10 mice) and 20 Hz pulsed laser (n = 4 mice). There is no significant difference between these groups (two-sided unpaired t-test, t12 = 0.1, P = 0.91). Data are expressed as mean ± SEM.
Supplementary Material
Acknowledgments
We thank C.D. Fiorillo for valuable discussions, T.J. Davidson for technical assistance with photometry, and the investigators who shared resources including viruses for optogenetics and calcium imaging, as well as DAT-Cre mice. S.C.M. was supported by NIH grants NS100050, NS096994, DA042739, DA005010, and NSF NeuroNex Award 1707408.
Footnotes
Competing interests: The authors declare no competing interests.
References
- 1.Fanselow MS & Wassum KM The Origins and Organization of Vertebrate Pavlovian Conditioning. Cold Spring Harbor perspectives in biology 8, a021717 (2016). [DOI] [PMC free article] [PubMed] [Google Scholar]
- 2.Schultz W Updating dopamine reward signals. Curr Opin Neurobiol 23, 229–238 (2013). [DOI] [PMC free article] [PubMed] [Google Scholar]
- 3.Saunders BT, Richard JM, Margolis EB & Janak PH Dopamine neurons create Pavlovian conditioned stimuli with circuit-defined motivational properties. Nat Neurosci 21, 1072–1083 (2018). [DOI] [PMC free article] [PubMed] [Google Scholar]
- 4.Everitt BJ & Robbins TW Neural systems of reinforcement for drug addiction: from actions to habits to compulsion. Nat Neurosci 8, 1481–1489 (2005). [DOI] [PubMed] [Google Scholar]
- 5.Leventhal DK, Stoetzner C, Abraham R, Pettibone J, DeMarco K & Berke JD Dissociable effects of dopamine on learning and performance within sensorimotor striatum. Basal Ganglia 4, 43–54 (2014). [DOI] [PMC free article] [PubMed] [Google Scholar]
- 6.Berke JD What does dopamine mean? Nat Neurosci 21, 787–793 (2018). [DOI] [PMC free article] [PubMed] [Google Scholar]
- 7.Wickens J Striatal dopamine in motor activation and reward-mediated learning: steps towards a unifying model. J Neural Transm Gen Sect 80, 9–31 (1990). [DOI] [PubMed] [Google Scholar]
- 8.Schultz W, Dayan P & Montague PR A neural substrate of prediction and reward. Science 275, 1593–1599 (1997). [DOI] [PubMed] [Google Scholar]
- 9.Glimcher PW Understanding dopamine and reinforcement learning: the dopamine reward prediction error hypothesis. Proc Natl Acad Sci U S A 108 Suppl 3, 15647–15654 (2011). [DOI] [PMC free article] [PubMed] [Google Scholar]
- 10.Steinberg EE, Keiflin R, Boivin JR, Witten IB, Deisseroth K & Janak PH A causal link between prediction errors, dopamine neurons and learning. Nat Neurosci 16, 966–973 (2013). [DOI] [PMC free article] [PubMed] [Google Scholar]
- 11.Chang CY, Esber GR, Marrero-Garcia Y, Yau HJ, Bonci A & Schoenbaum G Brief optogenetic inhibition of dopamine neurons mimics endogenous negative reward prediction errors. Nat Neurosci 19, 111–116 (2016). [DOI] [PMC free article] [PubMed] [Google Scholar]
- 12.Day JJ, Roitman MF, Wightman RM & Carelli RM Associative learning mediates dynamic shifts in dopamine signaling in the nucleus accumbens. Nat Neurosci 10, 1020–1028 (2007). [DOI] [PubMed] [Google Scholar]
- 13.Hamid AA, Pettibone JR, Mabrouk OS, Hetrick VL, Schmidt R, Vander Weele CM, Kennedy RT, Aragona BJ & Berke JD Mesolimbic dopamine signals the value of work. Nat Neurosci 19, 117–126 (2016). [DOI] [PMC free article] [PubMed] [Google Scholar]
- 14.Wise RA Dopamine, learning and motivation. Nat Rev Neurosci 5, 483–494 (2004). [DOI] [PubMed] [Google Scholar]
- 15.Berridge KC & Robinson TE What is the role of dopamine in reward: hedonic impact, reward learning, or incentive salience? Brain research. Brain research reviews 28, 309–369 (1998). [DOI] [PubMed] [Google Scholar]
- 16.Dodson PD, Dreyer JK, Jennings KA, Syed EC, Wade-Martins R, Cragg SJ, Bolam JP & Magill PJ Representation of spontaneous movement by dopaminergic neurons is cell-type selective and disrupted in parkinsonism. Proc Natl Acad Sci U S A 113, E2180–2188 (2016). [DOI] [PMC free article] [PubMed] [Google Scholar]
- 17.Howe MW & Dombeck DA Rapid signalling in distinct dopaminergic axons during locomotion and reward. Nature 535, 505–510 (2016). [DOI] [PMC free article] [PubMed] [Google Scholar]
- 18.da Silva JA, Tecuapetla F, Paixao V & Costa RM Dopamine neuron activity before action initiation gates and invigorates future movements. Nature 554, 244–248 (2018). [DOI] [PubMed] [Google Scholar]
- 19.Barter JW, Li S, Lu D, Bartholomew RA, Rossi MA, Shoemaker CT, Salas-Meza D, Gaidis E & Yin HH Beyond reward prediction errors: the role of dopamine in movement kinematics. Front Integr Neurosci 9, 39 (2015). [DOI] [PMC free article] [PubMed] [Google Scholar]
- 20.Coddington LT & Dudman JT The timing of action determines reward prediction signals in identified midbrain dopamine neurons. Nat Neurosci 21, 1563–1573 (2018). [DOI] [PMC free article] [PubMed] [Google Scholar]
- 21.Syed EC, Grima LL, Magill PJ, Bogacz R, Brown P & Walton ME Action initiation shapes mesolimbic dopamine encoding of future rewards. Nat Neurosci 19, 34–36 (2016). [DOI] [PMC free article] [PubMed] [Google Scholar]
- 22.Engelhard B, Finkelstein J, Cox J, Fleming W, Jang HJ, Ornelas S, Koay SA, Thiberge SY, Daw ND, Tank DW & Witten IB Specialized coding of sensory, motor and cognitive variables in VTA dopamine neurons. Nature (2019). [DOI] [PMC free article] [PubMed] [Google Scholar]
- 23.Zhu Y, Nachtrab G, Keyes PC, Allen WE, Luo L & Chen X Dynamic salience processing in paraventricular thalamus gates associative learning. Science 362, 423–429 (2018). [DOI] [PMC free article] [PubMed] [Google Scholar]
- 24.Cohen JY, Haesler S, Vong L, Lowell BB & Uchida N Neuron-type-specific signals for reward and punishment in the ventral tegmental area. Nature 482, 85–88 (2012). [DOI] [PMC free article] [PubMed] [Google Scholar]
- 25.van Zessen R, Phillips JL, Budygin EA & Stuber GD Activation of VTA GABA neurons disrupts reward consumption. Neuron 73, 1184–1194 (2012). [DOI] [PMC free article] [PubMed] [Google Scholar]
- 26.Xiao C, Cho JR, Zhou C, Treweek JB, Chan K, McKinney SL, Yang B & Gradinaru V Cholinergic Mesopontine Signals Govern Locomotion and Reward through Dissociable Midbrain Pathways. Neuron 90, 333–347 (2016). [DOI] [PMC free article] [PubMed] [Google Scholar]
- 27.Kim HF, Ghazizadeh A & Hikosaka O Dopamine Neurons Encoding Long-Term Memory of Object Value for Habitual Behavior. Cell 163, 1165–1175 (2015). [DOI] [PMC free article] [PubMed] [Google Scholar]
- 28.Parker NF, Cameron CM, Taliaferro JP, Lee J, Choi JY, Davidson TJ, Daw ND & Witten IB Reward and choice encoding in terminals of midbrain dopamine neurons depends on striatal target. Nat Neurosci 19, 845–854 (2016). [DOI] [PMC free article] [PubMed] [Google Scholar]
- 29.Komiyama T, Sato TR, O’Connor DH, Zhang YX, Huber D, Hooks BM, Gabitto M & Svoboda K Learning-related fine-scale specificity imaged in motor cortex circuits of behaving mice. Nature 464, 1182–1186 (2010). [DOI] [PubMed] [Google Scholar]
- 30.Gunaydin LA, Grosenick L, Finkelstein JC, Kauvar IV, Fenno LE, Adhikari A, Lammel S, Mirzabekov JJ, Airan RD, Zalocusky KA, Tye KM, Anikeeva P, Malenka RC & Deisseroth K Natural neural projection dynamics underlying social behavior. Cell 157, 1535–1551 (2014). [DOI] [PMC free article] [PubMed] [Google Scholar]
- 31.Markowitz JE, Gillis WF, Beron CC, Neufeld SQ, Robertson K, Bhagat ND, Peterson RE, Peterson E, Hyun M, Linderman SW, Sabatini BL & Datta SR The Striatum Organizes 3D Behavior via Moment-to-Moment Action Selection. Cell 174, 44–58 e17 (2018). [DOI] [PMC free article] [PubMed] [Google Scholar]
- 32.Chang CY, Gardner MPH, Conroy JC, Whitaker LR & Schoenbaum G Brief, But Not Prolonged, Pauses in the Firing of Midbrain Dopamine Neurons Are Sufficient to Produce a Conditioned Inhibitor. J Neurosci 38, 8822–8830 (2018). [DOI] [PMC free article] [PubMed] [Google Scholar]
- 33.Waelti P, Dickinson A & Schultz W Dopamine responses comply with basic assumptions of formal learning theory. Nature 412, 43–48 (2001). [DOI] [PubMed] [Google Scholar]
- 34.Sharpe MJ, Chang CY, Liu MA, Batchelor HM, Mueller LE, Jones JL, Niv Y & Schoenbaum G Dopamine transients are sufficient and necessary for acquisition of model-based associations. Nat Neurosci 20, 735–742 (2017). [DOI] [PMC free article] [PubMed] [Google Scholar]
- 35.Fischbach S & Janak PH Decreases in Cued Reward Seeking After Reward-Paired Inhibition of Mesolimbic Dopamine. Neuroscience 412, 259–269 (2019). [DOI] [PMC free article] [PubMed] [Google Scholar]
- 36.Albin RL, Young AB & Penney JB The functional anatomy of basal ganglia disorders. Trends in neurosciences 12, 366–375 (1989). [DOI] [PubMed] [Google Scholar]
- 37.Howard CD, Li H, Geddes CE & Jin X Dynamic Nigrostriatal Dopamine Biases Action Selection. Neuron 93, 1436–1450 e1438 (2017). [DOI] [PMC free article] [PubMed] [Google Scholar]
- 38.Ilango A, Kesner AJ, Keller KL, Stuber GD, Bonci A & Ikemoto S Similar roles of substantia nigra and ventral tegmental dopamine neurons in reward and aversion. J Neurosci 34, 817–822 (2014). [DOI] [PMC free article] [PubMed] [Google Scholar]
- 39.Wise RA Roles for nigrostriatal--not just mesocorticolimbic--dopamine in reward and addiction. Trends in neurosciences 32, 517–524 (2009). [DOI] [PMC free article] [PubMed] [Google Scholar]
- 40.Tian J, Huang R, Cohen JY, Osakada F, Kobak D, Machens CK, Callaway EM, Uchida N & Watabe-Uchida M Distributed and Mixed Information in Monosynaptic Inputs to Dopamine Neurons. Neuron 91, 1374–1389 (2016). [DOI] [PMC free article] [PubMed] [Google Scholar]
- 41.Liljeholm M & O’Doherty JP Contributions of the striatum to learning, motivation, and performance: an associative account. Trends in cognitive sciences 16, 467–475 (2012). [DOI] [PMC free article] [PubMed] [Google Scholar]
- 42.de Jong JW, Afjei SA, Pollak Dorocic I, Peck JR, Liu C, Kim CK, Tian L, Deisseroth K & Lammel S A Neural Circuit Mechanism for Encoding Aversive Stimuli in the Mesolimbic Dopamine System. Neuron 101, 133–151 e137 (2019). [DOI] [PMC free article] [PubMed] [Google Scholar]
- 43.Lerner TN, Shilyansky C, Davidson TJ, Evans KE, Beier KT, Zalocusky KA, Crow AK, Malenka RC, Luo L, Tomer R & Deisseroth K Intact-Brain Analyses Reveal Distinct Information Carried by SNc Dopamine Subcircuits. Cell 162, 635–647 (2015). [DOI] [PMC free article] [PubMed] [Google Scholar]
- 44.Lammel S, Ion DI, Roeper J & Malenka RC Projection-specific modulation of dopamine neuron synapses by aversive and rewarding stimuli. Neuron 70, 855–862 (2011). [DOI] [PMC free article] [PubMed] [Google Scholar]
- 45.Menegas W, Akiti K, Amo R, Uchida N & Watabe-Uchida M Dopamine neurons projecting to the posterior striatum reinforce avoidance of threatening stimuli. Nat Neurosci 21, 1421–1430 (2018). [DOI] [PMC free article] [PubMed] [Google Scholar]
- 46.Bromberg-Martin ES, Matsumoto M & Hikosaka O Dopamine in motivational control: rewarding, aversive, and alerting. Neuron 68, 815–834 (2010). [DOI] [PMC free article] [PubMed] [Google Scholar]
- 47.Soares S, Atallah BV & Paton JJ Midbrain dopamine neurons control judgment of time. Science 354, 1273–1277 (2016). [DOI] [PubMed] [Google Scholar]
- 48.Maes EJ, Sharpe MJ, Gardner MPH, Chang CY, Schoenbaum G & Iordanova MD Causal evidence supporting the proposal that dopamine transients function as a temporal difference prediction error. bioRxiv (2019). [DOI] [PMC free article] [PubMed] [Google Scholar]
- 49.Reynolds JN, Hyland BI & Wickens JR A cellular mechanism of reward-related learning. Nature 413, 67–70 (2001). [DOI] [PubMed] [Google Scholar]
- 50.Yagishita S, Hayashi-Takagi A, Ellis-Davies GC, Urakubo H, Ishii S & Kasai H A critical time window for dopamine actions on the structural plasticity of dendritic spines. Science 345, 1616–1620 (2014). [DOI] [PMC free article] [PubMed] [Google Scholar]
Methods-only references
- 51.Backman CM, Malik N, Zhang Y, Shan L, Grinberg A, Hoffer BJ, Westphal H & Tomac AC Characterization of a mouse strain expressing Cre recombinase from the 3’ untranslated region of the dopamine transporter locus. Genesis 44, 383–390 (2006). [DOI] [PubMed] [Google Scholar]
- 52.Gradinaru V, Zhang F, Ramakrishnan C, Mattis J, Prakash R, Diester I, Goshen I, Thompson KR & Deisseroth K Molecular and cellular approaches for diversifying and extending optogenetics. Cell 141, 154–165 (2010). [DOI] [PMC free article] [PubMed] [Google Scholar]
- 53.Klapoetke NC et al. Independent optical excitation of distinct neural populations. Nature methods 11, 338–346 (2014). [DOI] [PMC free article] [PubMed] [Google Scholar]
- 54.Chen TW, Wardill TJ, Sun Y, Pulver SR, Renninger SL, Baohan A, Schreiter ER, Kerr RA, Orger MB, Jayaraman V, Looger LL, Svoboda K & Kim DS Ultrasensitive fluorescent proteins for imaging neuronal activity. Nature 499, 295–300 (2013). [DOI] [PMC free article] [PubMed] [Google Scholar]
- 55.Yang L, Lee K, Villagracia J & Masmanidis SC Open source silicon microprobes for high throughput neural recording. J Neural Eng (2019). [DOI] [PMC free article] [PubMed] [Google Scholar]
- 56.Pachitariu M, Steinmetz N, Kadir S, Carandini M & Harris KD Kilosort: realtime spike-sorting for extracellular electrophysiology with hundreds of channels. bioRxiv (2016). [Google Scholar]
Associated Data
This section collects any data citations, data availability statements, or supplementary materials included in this article.
Supplementary Materials
Data Availability Statement
The data that support the findings of this study are available from the corresponding author upon request. The numerical data shown in the figures are provided as Source Data files.


