Abstract
Background:
Post-prandial and oral glucose tolerance test-related hypoglycemia is common in cystic fibrosis (CF); however, the underlying mechanisms are unclear.
Methods:
To understand the relationship of hypoglycemia with meal-related glucose excursion and insulin secretion, we analyzed plasma glucose, insulin, C-peptide, glucagon and incretins obtained during standardized mixed-meal tolerance tests (MMTT) in non-diabetic adolescents and young adults with pancreatic insufficient CF (PI-CF).
Results:
Hypoglycemia, defined as glucose <70mg/dL, occurred in 9/34 subjects at 150 (range:120–210) minutes following initial meal ingestion. Hypoglycemia[+] and hypoglycemia[−] groups did not differ in gender, age, lung function, HbA1c, or BMI. While 11/14 hypoglycemia[−] individuals displayed normal glucose tolerance (NGT), only 2/9 hypoglycemia[+] had NGT. Peak glucose was higher in hypoglycemia[+] vs hypoglycemia[−]. Compared to hypoglycemia[−] NGT, hypoglycemia[+] exhibited lower early-phase insulin secretion (ISR-AUC0–30min). ISR-AUC120–180min was not different in hypoglycemia[+] vs hypoglycemia[−] with abnormal glucose tolerance (AGT); however, glucose-AUC120–180min was lower in hypoglycemia[+] vs hypoglycemia[−] AGT. After adjusting for glucose-AUC, hypoglycemia[+] subjects tended to have higher ISR-AUC120–180min than hypoglycemia[–] AGT. Glucagon concentration did not differ between groups. Lower GLP-1-AUC30 min and AUC180min and higher GIP-AUC30min were present in hypoglycemia[+] individuals.
Conclusion:
Hypoglycemia is common in PI-CF following MMTT and is associated with early glucose dysregulation (higher peak glucose), more impaired early-phase insulin secretion (lower ISR-AUC30min), and possibly late compensatory hyperinsulinemia. Further study is required to understand whether absence of glucagon difference in the hypoglycemia[+] individuals signals counterregulatory impairment, to delineate the role of incretins in hypoglycemia, and to determine the relationship of hypoglycemia to emergence of CFRD.
Keywords: Cystic Fibrosis, Hypoglycemia, Glucose Tolerance, Insulin Secretion, Pancreatic Insufficiency
Background:
Cystic Fibrosis related diabetes (CFRD) is a highly clinically relevant CF complication associated with worse pulmonary function, increased pulmonary exacerbation rates, greater prevalence of important sputum pathogens, poorer nutritional status, and greater mortality[1–4]. While initially considered solely a byproduct of collateral damage of the cystic and fibrotic changes of the exocrine pancreas, leading to reduced β-cell mass, more recent data suggest that inflammatory-mediated β-cell dysfunction, inherent islet defects as well as abnormalities in incretin secretion and insulin sensitivity all may play a role in the pathogenesis of CFRD[5–7]. One potentially paradoxical, but nonetheless, clinically important manifestation of these defects is the post-prandial hypoglycemia that is commonly reported in CF.
Hypoglycemia, defined in some studies as a plasma or serum glucose <60mg/dL, has been reported in 6 to 15% of patients with CF in response to a standard 2-hour oral glucose tolerance test (OGTT) and in 45% of patients with CF undergoing an extended 3-hour OGTT[8–11]. CF patients also report hypoglycemia after extended duration of fasting, intense exercise, and following meals with a high carbohydrate load [12]. A recent systematic review in CF highlighted the need for further research into hypoglycemia and recommended harmonization of hypoglycemia criteria by defining hypoglycemia as glucose <70mg/dL and serious hypoglycemia at glucose <54mg/dL[13].
While hypoglycemia has been associated with higher hospitalization rates and lower weight[13], its underlying mechanism and relationship to CFRD onset remain poorly defined. Recent reports have suggested that, as a group, individuals with pancreatic insufficient (PI) and pancreatic sufficient (PS) CF who become hypoglycemic in the 2 hours following OGTT do not progress more rapidly to CFRD than those without hypoglycemia [14, 15]. Importantly, these studies included individuals with impaired glucose tolerance who are expected to transition to CFRD at an increased rate and did not specifically identify indeterminate glucose tolerance (defined as an elevated 1-hour OGTT glucose, with a normal 2-hour glucose), perhaps confounding the results. Indeterminate glucose tolerance is common in CF, and 1-hour glucose as low as 155mg/dL during OGTT is associated with more impaired early phase insulin secretion and risk of CFRD development over the subsequent 5–6 years[16–18].
The overall hypothesis of this work is that post-prandial hypoglycemia is a manifestation of early derangements in glucose homeostasis and insulin secretion and may be a harbinger of CFRD. In this secondary data analysis of insulin secretion across the spectrum of glucose abnormalities in CF[5, 17], we test the hypothesis that non-diabetic individuals with meal-related hypoglycemia demonstrate higher peak plasma glucose, worse early phase insulin secretion, and increased, compensatory later insulin secretion. Confirmation of these hypotheses would provide initial evidence that post-prandial hypoglycemia is an early marker of glucose intolerance and a risk factor of the emergence of CFRD. We also explore a potential role for glucagon and incretins in MMTT-related hypoglycemia.
Methods:
Individuals age ≥16 years with CF diagnosed by sweat test and subsequent CFTR mutation analysis and PI defined by need for enzyme replacement therapy based on clinical symptoms and/or fecal elastase <200ug/g were recruited for a study of insulin and incretin secretion [5, 17]. As previously described [5, 17], participants underwent 75-g OGTT[8] with fasting, 1- and 2-hour glucose samples with routine clinical care within 3 months of study participation[8]. Based on these results, subjects were categorized as having normal glucose tolerance (NGT) for 1-hour glucose <155 mg/dL (8.6 mmol/L) and 2-hour glucose <140 mg/dL (7.8 mmol/L); abnormal glucose tolerance (AGT) for 1-hour glucose ≥155 mg/dL or 2-hour glucose ≥140 and <200 mg/dL (11.1mmol/L); subjects identified as having diabetes based on a 2-hour glucose ≥200 mg/dL were excluded. Criteria for AGT were chosen based on prior studies associating a 1-hour glucose value >155mg/dL with impaired β-cell secretory capacity and risk of progression to diabetes in individuals with and without CF [17, 19–21].
Exclusion criteria included acute illness with change in antibiotic regimen or use of glucocorticoids within 4 weeks of the study, diagnosis of CFRD, history of lung or liver transplant, liver or kidney dysfunction, nursing or lactating women. This study was approved by the Institutional Review Boards of the University of Pennsylvania (Penn) and Children’s Hospital of Philadelphia (CHOP). Consent and assent (determined by age) were obtained from all subjects. Mixed-meal tolerance testing (MMTT) was performed at the Penn-CHOP Center for Human Phenomic Science as previously described [5, 17].
Full details of the MMTT have previously been published [5, 17]. After a 12-hour overnight fast, participants consumed an 820kcal breakfast comprised of 47% carbohydrate, 40% fat and 13% protein [22] along with their otherwise prescribed pancreatic enzyme replacement therapy. Blood samples were collected via indwelling intravenous line at −10, −1, 10, 15, 20, 30 and every subsequent 30 minutes until 240 minutes relative to meal ingestion.
Biochemical analysis
Plasma glucose was measured using an automated glucose analyzer (YSI 2300; Yellow Springs Instruments, Yellow Springs, OH). Additional samples were collected and stored as described [17]. Plasma insulin, C-peptide, and glucagon[23] were measured in duplicate by double antibody radioimmunoassays while active glucagon-like peptide 1 (GLP-1) and total gastric inhibitory polypeptide (GIP) were measured in duplicate by ELISA (Millipore, Billerica, Massachusetts).
Calculations
Insulin secretory rates (ISRs) were calculated using the oral C-Peptide minimal model as described by Breda et al [24] and incorporating C-peptide kinetics as estimated using the two-compartment model [25]. Model parameter estimation was performed using in WinSAAM software 3.0.8 (University of Pennsylvania, New Bolton Center, Kennett Square, Pennsylvania). Incremental areas under the curve (AUCs) for glucose, ISRs, and incretins were calculated.
Statistical Analyses
Data are reported as mean and standard deviation, unless otherwise noted. Hypoglycemia was defined as plasma glucose <70mg/dL during MMTT, based upon the standard definition of the American Diabetes Association and Endocrine Society and recommendations by Armaghanian et al [13, 26] and used to assign participants to exposure groups for analysis. Categorical variables were compared using Chi2. Depending upon data normality, continuous variables were compared using Student’s T-test or Mann-Whitney U test. Linear regression was performed to explore ISR AUC differences adjusted for glucose AUC. Significance was considered at P ≤ 0.05 (two-tailed). All statistical analyses were performed in STATA 15 software (StataCorp LP, College Station, Texas).
Results:
Thirty-four non-diabetic individuals with PI-CF (50% female, aged 25±8.7 years) were evaluated: 13 NGT and 21 AGT, defined based on clinical care OGTT within the preceding 3 months. Subjects were grouped based on the presence or absence of hypoglycemia. Hypoglycemia occurred in 9 subjects, 2 of whom had NGT and 7 of whom had AGT at a median of 150 (range 120–210) minutes following the meal. No significant between-group differences in gender, age, HbA1c, fasting plasma glucose, height-z, BMI-z, or lung function were found (Table 1). Only one subject (hypoglycemia [–], AGT) was on modulator therapy at the time of this study.
Table 1.
Demographics of Participants with and without Hypoglycemia during MMTT
| Hypoglycemia [−] | Hypoglycemia [+] | p-value | |||
|---|---|---|---|---|---|
| NGT (n=11) | AGT (n=14) | Total (n=25) | (n=9) | ||
| Female, n (%) | 5 (45) | 6 (43) | 11 (44) | 6 (67) | 0.24 |
| Age | 21.5 (16–50) | 25.6 (18–42) | 23.8 (16–50) | 27.3 (16–44) | 0.34 |
| HbA1c, % | 5.5 (4.7–6.2) | 5.4 (4.8–6.4) | 5.4 (4.7–6.4) | 5.6 (5.3–6.3) | 0.11 |
| Fasting Glucose, mg/dL | 79 (64–90) | 91 (73–104) | 85 (64–104) | 82 (77–93) | 0.27 |
| OGTT 1-hour Glucose, mg/dL | 126 (96–154) | 189 (129–253) | 161 (96–253) | 181 (121–260) | 0.23 |
| OGTT 2-hour Glucose, mg/dL | 88 (66–116) | 118 (34–178) | 105 (34–178) | 132 (87–196) | 0.18 |
| Height-z | −0.25 (− 1.3 – 1.1) | −0.35 (− 2.6 – 1.9) | −0.3 (− 2.6 – 1.9) | −0.3 (− 1.3 – 1.2) | 0.98 |
| BMI-z | 0.3 (−1.2 – 1.8) | −0.05 (−2.3–1.8) | 0.1 (−2.3 – 1.8) | 0.34 (−0.2 – 0.7) | 0.55 |
| FEV1-% Predicted | 87 (58–113) | 77 (51–112) | 81.7 (51–113) (n=24) | 79.3 (54–104) | 0.61 |
| Genotype, n (%) with 1 delF508 | 8 (73) | 13 (93) | 21 (84) | 9 (100) | 0.21 |
| Genotype, n (%) with 2 delF508 | 3 (27) | 10 (71) | 13 (52) | 4 (44) | 0.71 |
Continuous data expressed as mean (min-max). Of note, 1 subject is missing pulmonary function testing. Statistical analyses were performed between the Hypoglycemia [−] and Hypoglycemia [+] groups with p-values reported. No group differences were detected. FEV1= forced expiratory volume in 1 second.
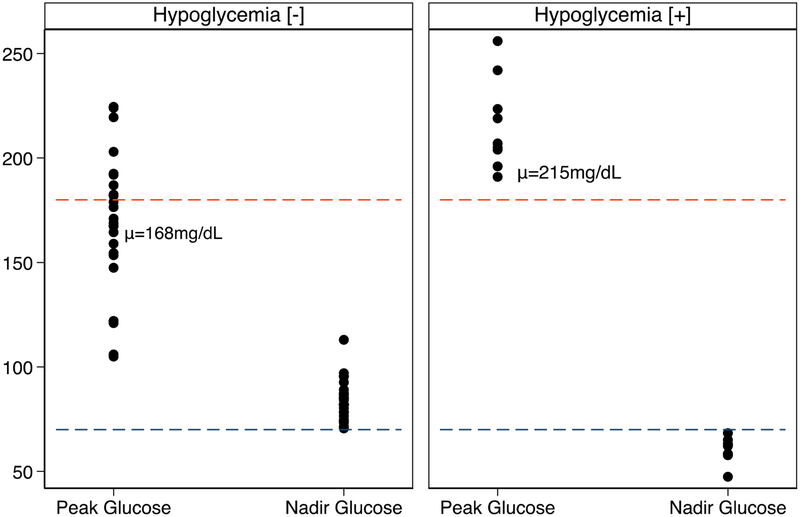
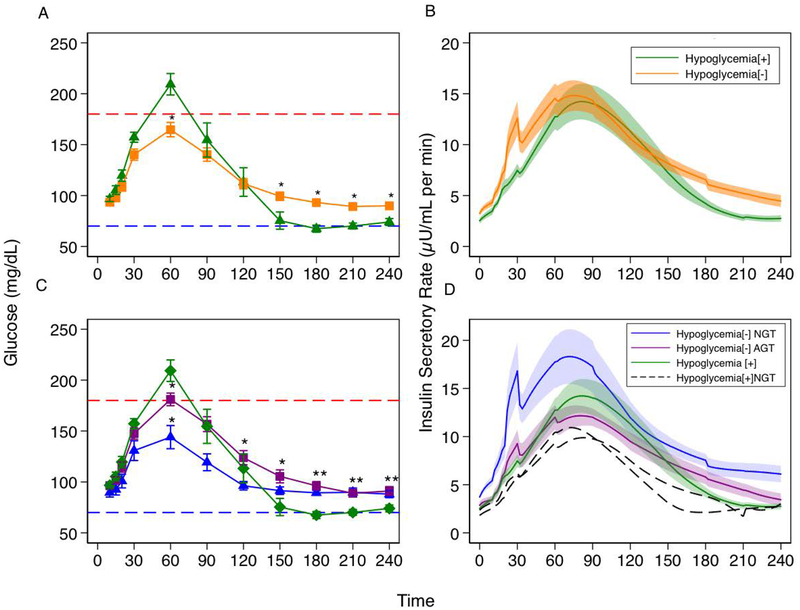
Peak plasma glucose in response to the mixed meal was higher in the hypoglycemia[+] group (215±21 vs 168±33 mg/dL, p<0.01), (Figure 1, 2A). Neither time to peak plasma glucose (61±24 vs 63±10 minutes, p=0.45) nor time to glucose nadir (185±39 vs 180±34 minutes, p=0.61) was different between groups (Figure 2A). Early-phase ISR-AUC15–45 min was lower in the hypoglycemia [+] group compared to the NGT hypoglycemia [–] group (67±24 vs 151±114μU/mL, p=0.03) (Figure 2D). This finding was maintained with adjustment for glucose AUC30 min (p=0.03). The two hypoglycemia [+] NGT subjects had ISR-AUC15–45min of 48 μU/mL and 49 μU/mL, respectively (Figure 2D).
Figure 1:
(Left) Peak plasma glucose and glucose nadir for hypoglycemia [−] subjects. (Right) Peak plasma glucose and glucose nadir for hypoglycemia [+] subjects. Peak plasma glucose was higher in the hypoglycemia [+] group (215±21 vs 168±33 mg/dL, p<0.01) and glucose nadir was lower in the hypoglycemia [+] group (60±6 vs 84±9 mg/dL, p<0.01). Red dashed line represents plasma glucose of 180mg/dL and blue dashed line represents plasma glucose of 70mg/dL.
Figure 2:
A) Plasma glucose (mg/dL) following MMTT in hypoglycemia [+] vs hypoglycemia [−] groups. B) Insulin secretory rate (μU/mL per min) in response to MMTT. Early phase insulin secretion is blunted in hypoglycemia [+] vs hypoglycemia [−](p=0.03). C) Plasma glucose (mg/dL) following MMTT. Hypoglycemia [+] subjects have higher plasma glucose at 60 minutes (p=0.004). but declines in glucose through 120 to 180 minutes of testing unlike NGT subjects whose blood glucose values stabilize at 120 minutes. Accordingly, glucose AUC120–180 min was lower in the hypoglycemia [+] group (p= 0.015). D) Insulin secretory rate (μU/mL per min) in response to MMTT. Significant blunting of early phase insulin secretion is demonstrated in both hypoglycemia [−] AGT (purple) and hypoglycemia [+] (green) groups. Black dashed lines represent the Insulin secretory rates (μU/mL per min) for the 2 NGT-hypoglycemia [+] subjects. These subjects demonstrate loss of early phase insulin secretion despite normal glucose tolerance. After adjusting for glucose AUC over this interval, hypoglycemia [+] tended to have higher late insulin secretion than hypoglycemia [−] AGT (p=0.1).
Markers indicate mean value at that time point while bars indicate standard error of the mean. Black dashed lines are absolute insulin secretory rate for each of the two NGT-hypoglycemia [+] subjects. Red dashed line represents plasma glucose of 180mg/dL and blue dashed line represents plasma glucose of 70mg/dL. * indicates p-value <0.05 for that group’s glucose value compared with the hypoglycemia [+] group.
While peak insulin was similar between groups (58±34μU/mL vs 65±53μU/mL, p=0.86), timing of peak plasma insulin was more likely to occur after 60 minutes in participants with hypoglycemia (48% vs 89%, p=0.03). Moreover, ISR-AUC120–180 min was not different in those who experienced hypoglycemia compared to those with AGT (295±196 vs 278±16 μU/mL, p=0.82). Important to note, however, glucose AUC120–180 min was lower in the hypoglycemia[+] group (−7851±288mg·min/dL vs 7501±115 mg·min/dL, p=0.015) (Figure 2A, C). After adjusting for glucose AUC over this interval, those with hypoglycemia tended to have higher late insulin secretion (p=0.1).
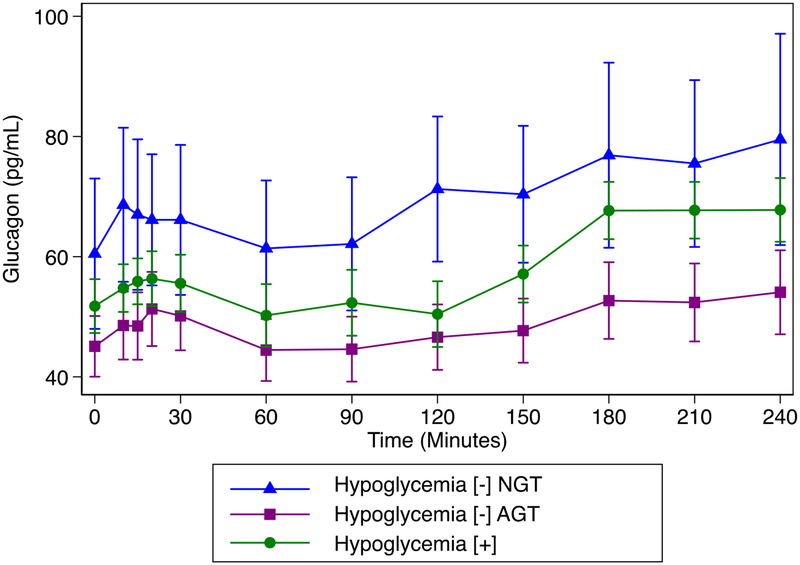
Despite differences in glucose, no differences in glucagon at 120, 150 or 180 minutes were identified (Figure 3).
Figure 3:
Glucagon concentration over time by group. No difference in glucagon between hypoglycemia [+] and hypoglycemia [−] NGT were found (p> 0.18 for all times), despite differences in plasma glucose.
Due to the differences in glucose tolerance between subjects with and without hypoglycemia, a second analysis was limited to participants with AGT. This restricted analysis similarly identified higher peak glucose in the hypoglycemia[+] vs hypoglycemia[−] groups (221+21 vs 184+24 mg/dL, p=0.002) but no other differences in peak insulin, time of peak insulin, ISR, or glucagon AUC (data not shown).
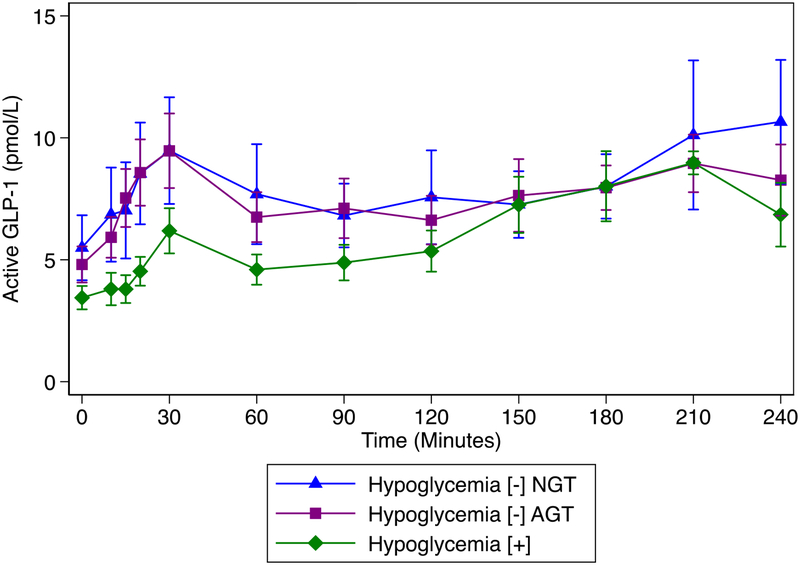
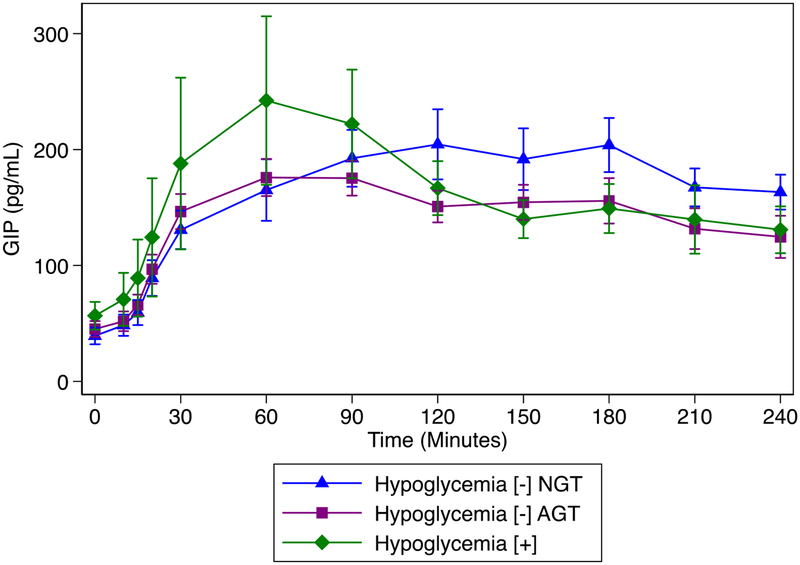
Exploratory analyses of incretins revealed significantly lower GLP-1 AUC 30 min and GLP-1 AUC 180 min in hypoglycemia [+] compared to either hypoglycemia [–] group (Figure 4, supplemental table). Meanwhile, GIP AUC 30 min was significantly higher in the hypoglycemia [+] group; however, GIP AUC 180 min was not different between groups (Figure 5, supplemental table).
Figure 4:
GLP-1 concentration over time by group: significantly lower GLP-1 AUC 30 min and GLP-1 AUC 180 min in hypoglycemia [+] compared to either hypoglycemia [−] group (supplemental table).
Figure 5:
GIP concentration over time by group: significantly higher in the hypoglycemia [+] group; however, GIP AUC 180 min was not different between group (supplemental table).
Discussion:
This study demonstrated that meal-related hypoglycemia is common in PI-CF. This post-prandial hypoglycemia was associated with early glucose dysregulation, loss of early-phase insulin secretion, and the suggestion of later, but overly robust, compensatory insulin secretion. Subjects that experienced hypoglycemia in this study tended to have abnormal glucose tolerance on their preceding clinical OGTT and had significantly higher peak plasma glucose during the mixed meal. Indeed, insulin secretion was 1) dysregulated in the hypoglycemia [+] group compared to that of adults with normal glucose tolerance without hypoglycemia and 2) not different to that of adults with abnormal glucose tolerance without hypoglycemia. While the hypoglycemia[+] group demonstrated a preserved later phase insulin secretion, this insulin secretion is likely inappropriate considering the lower concomitant glucose concentrations. These data, in conjunction with the blunted early phase insulin secretion in the two “NGT” hypoglycemia[+] subjects, while observational and limited by number, suggest that hypoglycemia may occur during the progression from NGT to CFRD.
Despite evidence that OGTTs extended to 3 hours identify higher rates of hypoglycemia[11], recent studies of PI and PS-CF individuals have restricted their examinations to the 2-hour OGTT data and concluded, based on observations of lower insulin concentrations in those with hypoglycemia, that insulin dysregulation does not govern hypoglycemia [12]. In contrast, our data suggest that individuals with hypoglycemia [+] tend to have higher insulin secretion in the late post-prandial period when accounting for their lower glucose levels. Thus, our data support the hypothesis that this insulin secretion is inappropriately elevated in the context of hypoglycemia.
These findings are also consistent with the ferret model of CF which demonstrates the reduced first-phase insulin secretion (2-min response to glucose stimulation) with significantly higher later plasma insulin levels (30, 60, 120 min) that fail to decrease with decreasing plasma glucose [27]. These ferrets, by one to two months of life, tended toward abnormal glucose regulation and CFRD [27], suggesting again that hypoglycemia may be a marker of future CFRD development.
Defining subsets of patients with CF at risk for insulin secretion abnormalities is clinically relevant. Given that the islets of PS individuals can be relatively spared from the collateral damage from the exocrine pancreas, the hypoglycemia they experience may be more akin to that observed in up to 5.5% of the normal population[28]. Thus, two different etiologies of hypoglycemia are plausible: one functional in nature and a second, pathologic form related to insulin secretion defects and possibly to impaired counterregulatory responses we report here in subjects with PI-CF. Interestingly, in our study, no hypoglycemia [+] subjects but four hypoglycemia [–] subjects experienced hypoglycemia during their preceding 2 hour OGTT, while hypoglycemia tended to occur ~2.5 hours after meal ingestion. This suggests the absence of hypoglycemia during the standard 2-hour OGTT does not exclude the potential for 1) OGTT-related hypoglycemia occurring after the conclusion of the 2-hour test or 2) meal-related hypoglycemia. These varying mechanisms, inclusion of PS participants, and use of OGTT instead of MMTT may explain Armaghanian’s results that patient-reported hypoglycemia in daily living did not coincide with hypoglycemia or higher insulin levels on 2-hour OGTT[12]. Nevertheless, our data suggest that patients with PI-CF who have elevated peak glucose followed by hypoglycemia have β-cell secretory impairment.
By means of exploration, we also analyzed glucagon, GIP and GLP-1 concentrations between groups. We found that glucagon concentrations did not differ between groups despite differences in plasma glucose. Patients with CF have lower alpha-cell secretion at baseline[5] and could plausibly have glucagon secretion defects mediating hypoglycemia; however, the interpretation of these data is complicated by the lack of “normative” glucagon data during post-prandial hypoglycemia. Nonetheless, the absence of a compensatory increase in glucagon at the time of hypoglycemia may be considered inappropriate. The direct role of incretins in meal-related hypoglycemia in PI-CF cannot be easily delineated with the current data. The best available model for incretin-associated hypoglycemia is fundoplication-related late dumping syndrome which is characterized by overly robust GLP-1 secretion, hyperinsulinemia, and ultimately, postprandial hypoglycemia [29]. In contrast, hypoglycemia[+] individuals with PI-CF displayed lower early GLP-1 secretion but higher GIP. As incretin-based therapies receive increasing attention in CF, the role of incretins in the hypoglycemia of CF may become clearer.
Strengths of this study include the frequency of blood sampling, the ability to model insulin secretory rate, and the use of mixed meal tolerance testing to better replicate the hypoglycemia seen in free living conditions. While this pilot study implicates early dysregulated insulin secretion in the postprandial hypoglycemia that occurs in CF, the number of participants was limited. Of 9 subjects with hypoglycemia, only 2 were hypoglycemia [+] NGT, limiting our ability to make comparisons for this group. Additionally, our understanding of glucose, insulin and incretin response to MMTT may be confounded by maldigestion and disruption of the enteroinsular axis in the setting of pancreatic exocrine insufficiency. Finally, concerns have arisen regarding inability to detect glucagon suppression with certain assays. The radioimmunoassay used here is sensitive and has been used successfully in prior studies, to detect glucagon suppression compared to other methodologies [23]. Nonetheless, limitations of glucagon assays should be acknowledged.
Larger scale, longitudinal, studies are needed to create a more robust understanding of the underlying pathophysiologic mechanisms and the risk of progression to CFRD. We suggest that extending the duration of oral glucose tolerance testing beyond the standard clinical 2-hour exam may be useful to evaluate subjects with delayed hypoglycemia while limiting the complex nutrient exposure and potential disease specific differences in disposal introduced by the MMTT.
In conclusion, these data have highlighted the early β-cell secretory defect that is present in individuals with hypoglycemia in the setting of pancreatic insufficient CF and that results in high peak plasma glucose and potential compensatory hyperinsulinemia. Earlier studies did not consider early glucose abnormalities and may have prematurely reassured that hypoglycemia was not a precursor to CFRD. More fully understanding these processes as well as the contributions of alpha-cell damage and incretin abnormalities is crucial for informing treatment strategies and delineating the contribution of early glucose derangements to subsequent risk of CFRD. Of additional clinical relevance, patients should be cautioned to eat at the conclusion of annual OGTTs to minimize development of hypoglycemia. Patients should be queried for symptoms of post-prandial hypoglycemia. Whether dietary modifications such as limiting ingestion of high glycemic index foods and simple sugars influences the occurrence of hypoglycemia requires formal study.
Supplementary Material
Highlights:
Post-prandial hypoglycemia is common in Pancreatic Insufficient Cystic Fibrosis (PI-CF)
Hypoglycemia [+] exhibit impaired early phase insulin secretion and higher peak glucose
Hypoglycemia [+] individuals also tended to have late compensatory hyperinsulinemia
ACKNOWLEDGEMENTS:
We would like to thank the CF subjects for their participation; the nursing and dietary staff of the Penn and CHOP Clinical & Translational Research Centers for their subject care and technical assistance; Russel Localio, PhD of the University of Pennsylvania Department of Biostatistics, Epidemiology and Informatics for assistance with statistical analyses; Heather Collins, PhD of the University of Pennsylvania Diabetes Research Center for performance of the radioimmunoassays; Samir Sayed of the Children’s Hospital of Philadelphia Translational Core Laboratory for performance of the enzyme-linked immunosorbent assays; and Huong-Lan Nguyen of the Human Metabolism Resource of the University of Pennsylvania Institute for Diabetes, Obesity & Metabolism for laboratory assistance.
FUNDING: This work was supported by grants from the Cystic Fibrosis Foundation (to A.K., M.R.R. and M.J.K.), Public Health Services Research Grants R01 DK97830 (to A.K. and M.R.R), UL1 TR000003 (Penn and CHOP Clinical & Translational Research Centers), P30 DK19525 (University of Pennsylvania Diabetes Research Center), and K23 DK107937 (to S.S.), and the Human Metabolism Resource of the University of Pennsylvania Institute for Diabetes, Obesity & Metabolism.
Abbreviations:
- CFRD
Cystic Fibrosis-Related Diabetes
- PG
Plasma Glucose
- OGTT
Oral Glucose Tolerance Test
- MMTT
Mixed Meal Tolerance Test
- NGT
Normal Glucose Tolerance
- AGT
Abnormal Glucose Tolerance
Footnotes
Publisher's Disclaimer: This is a PDF file of an unedited manuscript that has been accepted for publication. As a service to our customers we are providing this early version of the manuscript. The manuscript will undergo copyediting, typesetting, and review of the resulting proof before it is published in its final citable form. Please note that during the production process errors may be discovered which could affect the content, and all legal disclaimers that apply to the journal pertain.
CONFLICTS OF INTEREST: The authors have no conflicts of interest directly related to this study. Dr. De Leon has a patent issued for exendin-(9–39) as a method for treating post-prandial hypoglycemia.
References
- 1.Milla CE, Warwick WJ, and Moran A, Trends in Pulmonary Function in Patients with Cystic Fibrosis Correlate with the Degree of Glucose Intolerance at Baseline. American Journal of Respiratory and Critical Care Medicine, 2000. 162(3): p. 891–895. [DOI] [PubMed] [Google Scholar]
- 2.Marshall BC, et al. , Epidemiology of cystic fibrosis-related diabetes. The Journal of Pediatrics, 2005. 146(5): p. 681–687. [DOI] [PubMed] [Google Scholar]
- 3.Koch C, et al. , Presence of cystic fibrosis-related diabetes mellitus is tightly linked to poor lung function in patients with cystic fibrosis: Data from the European Epidemiologic Registry of Cystic Fibrosis. Pediatric Pulmonology, 2001. 32(5): p. 343–350. [DOI] [PubMed] [Google Scholar]
- 4.Lanng S, et al. , Influence of the development of diabetes mellitus on clinical status in patients with cystic fibrosis. European Journal of Pediatrics, 1992. 151(9): p. 684–7. [DOI] [PubMed] [Google Scholar]
- 5.Sheikh S, et al. , Reduced β-Cell Secretory Capacity in Pancreatic-Insufficient, but Not Pancreatic-Sufficient, Cystic Fibrosis Despite Normal Glucose Tolerance. Diabetes, 2017. 66(1): p. 134–144. [DOI] [PMC free article] [PubMed] [Google Scholar]
- 6.Holl RW, et al. , Reduced pancreatic insulin release and reduced peripheral insulin sensitivity contribute to hyperglycaemia in cystic fibrosis. European Journal of Pediatrics, 1995. 154(5): p. 356–361. [PubMed] [Google Scholar]
- 7.Hart NJ, et al. , Cystic fibrosis-related diabetes is caused by islet loss and inflammation. JCI Insight, 2018. 3(8). [DOI] [PMC free article] [PubMed] [Google Scholar]
- 8.Kelly A and Moran A, Update on cystic fibrosis-related diabetes. Journal of Cystic Fibrosis, 2013. 12(4): p. 318–331. [DOI] [PubMed] [Google Scholar]
- 9.Battezzati A, et al. , Spontaneous hypoglycemia in patients with cystic fibrosis. European Journal of Endocrinology, 2007. 156(3): p. 369–376. [DOI] [PubMed] [Google Scholar]
- 10.Haliloglu B, et al. , Hypoglycemia is common in children with cystic fibrosis and seen predominantly in females. Pediatric Diabetes, 2016. [DOI] [PubMed] [Google Scholar]
- 11.Hirsch IB, et al. , Hypoglycemia in adults with cystic fibrosis during oral glucose tolerance testing. Diabetes Care, 2013. 36(8): p. e121–122. [DOI] [PMC free article] [PubMed] [Google Scholar]
- 12.Armaghanian N, et al. , Hypoglycaemia in cystic fibrosis: An analysis of a single centre adult cystic fibrosis clinic. J Cyst Fibros, 2018. 17(4): p. 542–547. [DOI] [PubMed] [Google Scholar]
- 13.Armaghanian N, et al. , Hypoglycaemia in cystic fibrosis in the absence of diabetes: A systematic review. Journal of Cystic Fibrosis: Official Journal of the European Cystic Fibrosis Society, 2016. 15(3): p. 274–284. [DOI] [PubMed] [Google Scholar]
- 14.Radike K, et al. , Prognostic Relevance of Hypoglycemia Following an Oral Glucose Challenge for Cystic Fibrosis–Related Diabetes. Diabetes Care, 2011. 34(4): p. e43. [DOI] [PMC free article] [PubMed] [Google Scholar]
- 15.Mannik LA, et al. , Prevalence of hypoglycemia during oral glucose tolerance testing in adults with cystic fibrosis and risk of developing cystic fibrosis-related diabetes. J Cyst Fibros, 2018. 17(4): p. 536–541. [DOI] [PubMed] [Google Scholar]
- 16.Sheikh S, et al. , Elevation of one hour plasma glucose during oral glucose tolerance testing. Pediatric Pulmonology, 2015. 50(10): p. 963–969. [DOI] [PMC free article] [PubMed] [Google Scholar]
- 17.Nyirjesy SC, et al. , beta-Cell secretory defects are present in pancreatic insufficient cystic fibrosis with 1-hour oral glucose tolerance test glucose >/=155 mg/dL. Pediatr Diabetes, 2018. 19(7): p. 1173–1182. [DOI] [PMC free article] [PubMed] [Google Scholar]
- 18.Ode KL, et al. , Oral glucose tolerance testing in children with cystic fibrosis. Pediatr Diabetes, 2010. 11(7): p. 487–92. [DOI] [PMC free article] [PubMed] [Google Scholar]
- 19.Bergman M, et al. , One-hour post-load plasma glucose level during the OGTT predicts dysglycemia: Observations from the 24year follow-up of the Israel Study of Glucose Intolerance, Obesity and Hypertension. Diabetes Res Clin Pract, 2016. 120: p. 221–8. [DOI] [PubMed] [Google Scholar]
- 20.Pareek M, et al. , Enhanced Predictive Capability of a 1-Hour Oral Glucose Tolerance Test: A Prospective Population-Based Cohort Study. Diabetes Care, 2018. 41(1): p. 171–177. [DOI] [PubMed] [Google Scholar]
- 21.Bianchi C, et al. , Elevated 1-hour postload plasma glucose levels identify subjects with normal glucose tolerance but impaired beta-cell function, insulin resistance, and worse cardiovascular risk profile: the GENFIEV study. J Clin Endocrinol Metab, 2013. 98(5): p. 2100–5. [DOI] [PubMed] [Google Scholar]
- 22.Vollmer K, et al. , Predictors of incretin concentrations in subjects with normal, impaired, and diabetic glucose tolerance. Diabetes, 2008. 57(3): p. 678–87. [DOI] [PubMed] [Google Scholar]
- 23.Bak MJ, et al. , Specificity and sensitivity of commercially available assays for glucagon and oxyntomodulin measurement in humans. Eur J Endocrinol, 2014. 170(4): p. 529–38. [DOI] [PubMed] [Google Scholar]
- 24.Breda E, et al. , Oral glucose tolerance test minimal model indexes of beta-cell function and insulin sensitivity. Diabetes, 2001. 50(1): p. 150–8. [DOI] [PubMed] [Google Scholar]
- 25.Van Cauter E, et al. , Estimation of insulin secretion rates from C-peptide levels. Comparison of individual and standard kinetic parameters for C-peptide clearance. Diabetes, 1992. 41(3): p. 368–77. [DOI] [PubMed] [Google Scholar]
- 26.Seaquist ER, et al. , Hypoglycemia and diabetes: a report of a workgroup of the American Diabetes Association and the Endocrine Society. Diabetes Care, 2013. 36(5): p. 1384–95. [DOI] [PMC free article] [PubMed] [Google Scholar]
- 27.Olivier AK, et al. , Abnormal endocrine pancreas function at birth in cystic fibrosis ferrets. The Journal of Clinical Investigation, 2012. 122(10): p. 3755–3768. [DOI] [PMC free article] [PubMed] [Google Scholar]
- 28.Parekh S, et al. , Clinical characteristics of people experiencing biochemical hypoglycaemia during an oral glucose tolerance test: Cross-sectional analyses from a UK multi-ethnic population. Diabetes Research and Clinical Practice, 2014. 104(3): p. 427–434. [DOI] [PubMed] [Google Scholar]
- 29.Palladino AA, et al. , Increased glucagon-like peptide-1 secretion and postprandial hypoglycemia in children after Nissen fundoplication. J Clin Endocrinol Metab, 2009. 94(1): p. 39–44. [DOI] [PMC free article] [PubMed] [Google Scholar]
Associated Data
This section collects any data citations, data availability statements, or supplementary materials included in this article.


