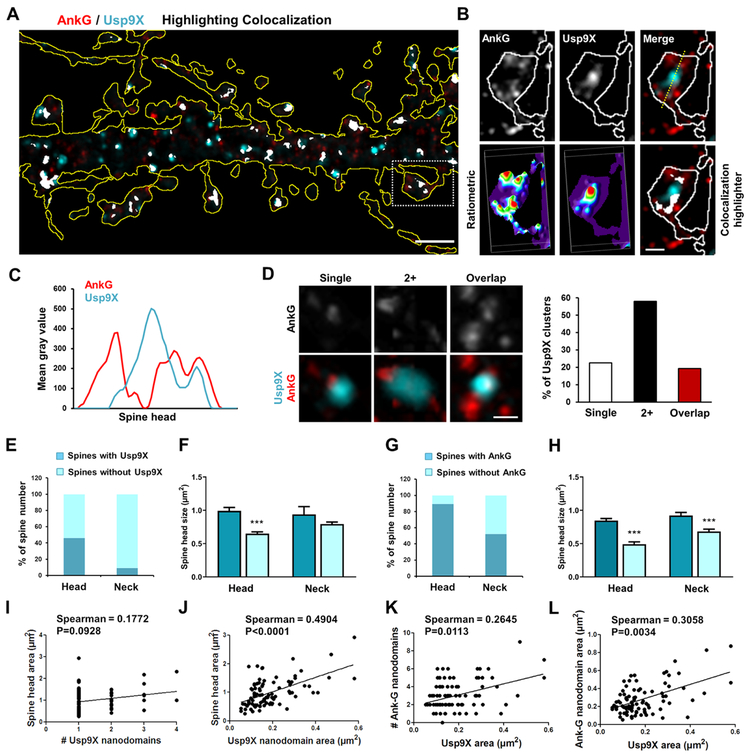
Figure 2.
Super-resolution imaging of spatial organization of ankyrin-G and Usp9X relationship with spine architecture. (A) SIM image of ankyrin-G and Usp9X immunofluorescence in a dendritic region outlined by tRFP expression; scale bar, 2 μm. (B) High-resolution image of boxed spine in (A). Lower panels: ratiometric images and colocalization (white). Scale bar, 1 μm. (C) Line scan through spine head. (D) Representative spatial relationships between ankyrin-G and Usp9X within individual spine heads. Scale bar = 0.25 μm. Quantification shows the percentage of spines with each distribution. (E-H) The fraction of spines having Usp9X or ankyrin-G nanodomains in the head or neck. Spine head size related to the presence or absence of Usp9X or ankyrin-G nanodomains in the head or neck. Total 198 spines were analyzed from 6 neurons. ***p < 0.001; One-way ANOVA was followed by Bonferroni post-tests. Data are represented as mean ± SEM. (I-L) Correlation plots of spine head areas, number and size of ankyrin-G nanodomains/spine with number and area of Usp9X nanodomains/spine from (E-H). Two-tailed spearman tests were performed. See also Figure S2.

