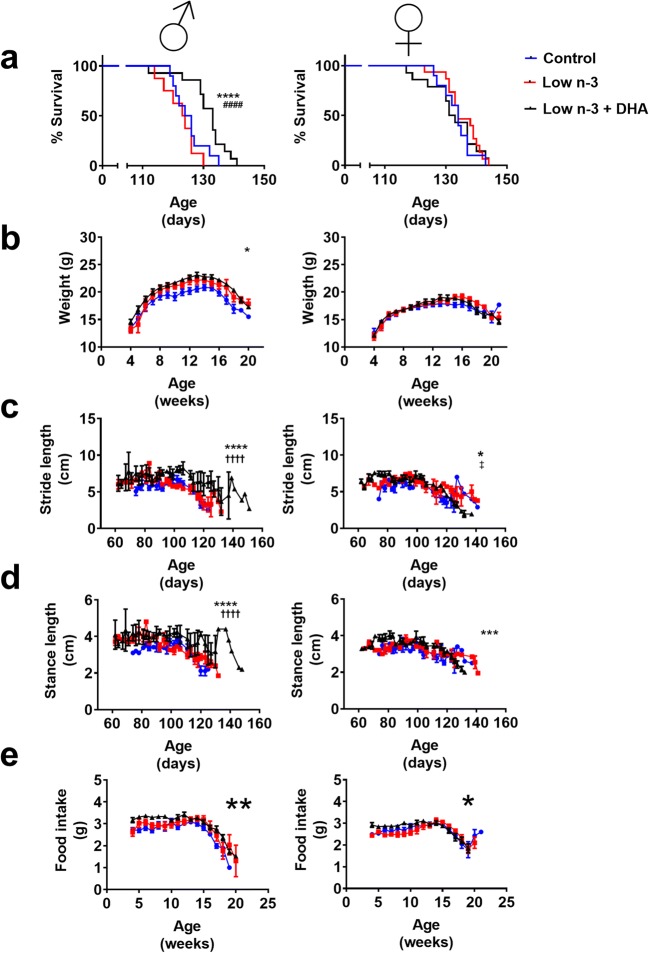
Fig. 1.
DHA dietary supplementation increases the survival of G93A male mice. DHA supplementation increases percent survival in males (a) but not in females. Growth curves also show diet-induced differences in males (b), though age at the maximum weight is not altered. Disease evolution, as measured by loss of stride (c) and stance (d) lengths, and daily food intake (e), also indicates the protective effect of dietary DHA supplementation in males, but not in females. Percent survival in (a) was estimated by Kaplan–Meyer analyses. Two-way ANOVA with repeated measures was employed for (b), (c), (d), and (e). In the case of (b), in males, this analyses showed a p = 0.0119 for diet effect and p < 0.0001 for age effect, and diet and age interaction is not significant; for females, p = 0.6278 for diet effect, p < 0.0001 for age effect; but in this case, age and diet interaction being significant, p = 0.0046. For (c), in males, diet effect showed a p = 0.031, age effect p = 0.0007, and age and diet interaction was not significant; for females, diet effect showed a p = 0.22, with age effect p < 0.0001, and age and diet interaction with p = 0.037. For (d), in males, age effect was p = 0.01 with diet p = 0.13 and interaction between age and diet p = 0.21; for females, age effect was p = 0.0011, diet factor p = 0.15, and interaction between age and diet p = 0.027. For (e), in males, this analyses showed a p = 0.0011 for diet effect, p < 0.0001 for age effect, and p = 0.048 for diet and age interaction; for females, a p = 0.1395 for diet effect, p < 0.0001 for age effect, and age and diet interaction being significant, p < 0.0001. In all cases, matching between individuals was effective (p < 0.0001). Error bars represent ± S.E.M. ****p < 0.0001, ***p < 0.001, and *p < 0.05 in control versus low-n-3 + DHA diet comparisons, whereas ††††p < 0.0001 in low-n-3 versus low-n-3 + DHA diet comparisons and ‡p < 0.05 in control versus low-n-3 diet groups in post hoc multiple comparisons

