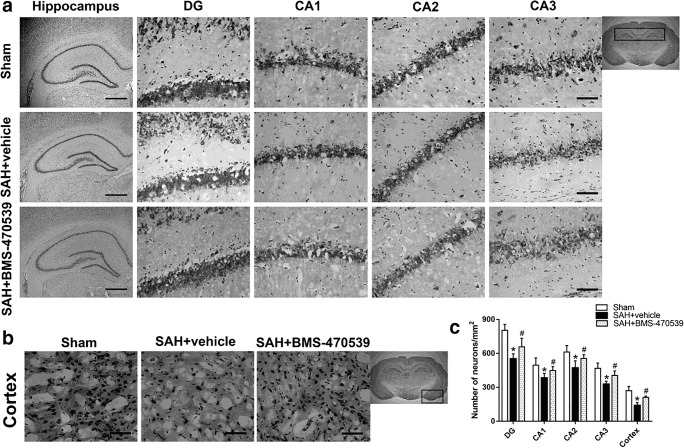
Fig. 5.
Nissl staining of hippocampus and cerebral cortex demonstrating reduced injury in BMS-470539 treated rats. (A) DG, CA1, CA2, and CA3 areas of hippocampus. (B) Cerebral cortex. Scale bar =200 μm (general) and 50 μm (regions). (C) The quantitative analysis of Nissl staining. N = 4 for each group. Data of Nissl staining are shown as mean ± SD and compared by one-way ANOVA followed by the Tukey post hoc test. *p<0.05 versus sham, #p<0.05 versus SAH + vehicle.

