Abstract
Increased Connexin43 hemichannel opening is associated with inflammasome pathway activation and inflammation in a range of pathologies including ocular disorders, such as age-related macular degeneration (AMD) and diabetic retinopathy (DR). In this study, the effect on retinal function and morphology of clinically safe doses of orally delivered tonabersat, a small molecule connexin hemichannel blocker, was investigated in the light-damaged retina animal model of dry AMD and in a spontaneous rat model of DR. Clinical parameters (fundus imaging, optical coherence tomography (OCT), and electroretinography) and inflammatory markers (immunohistochemistry for Iba-1 microglial marker, astrocyte marker glial fibrillary acidic protein, and Connexin43 protein expression) were assessed. Tonabersat treatment reduced inflammation in the retina in parallel with preservation of retinal photoreceptor function when assessed up to 3 months post light damage in the dry AMD model. In the DR model, clinical signs, including the presence of aneurysms confirmed using Evans blue dye perfusion, were reduced after daily tonabersat treatment for 2 weeks. Inflammation was also reduced and retinal electrical function restored. Tonabersat regulates assembly of the inflammasome (NLRP3) through Connexin43 hemichannel block, with the potential to reduce inflammation, restore vascular integrity and improve anatomical along with some functional outcomes in retinal disease.
Electronic supplementary material
The online version of this article (10.1007/s13311-019-00786-5) contains supplementary material, which is available to authorized users.
Key Words: Macular degeneration, diabetic retinopathy, tonabersat, inflammasome, retina, choroid, Connexin43, inflammation
Introduction
Tonabersat, a novel benzopyran compound (cis-6-acetyl-4S-(3-chloro-4-fluoro-benzoylamino)-3,4-dihydro-2,2-dimethyl-2H-benzo [b]pyrane-3 S-ol (SB-220453), was originally clinically evaluated for the treatment of migraine [1]. A previous study had indicated that neuronal-glial Connexin26 gap junctions might play a role in cortical spreading depression associated with migraine [2, 3], with tonabersat said to reduce Connexin26 protein expression [4–6]. Controlled clinical trials showed that the compound is well tolerated with no significant safety concerns [3, 7]. Clinical evaluations included monitoring of blood pressure and heart rate [3, 8]. Clinical studies did not progress beyond phase 2 for the migraine indication. However, it was recently discovered that tonabersat is a Connexin43 hemichannel blocker, with attributes similar to those of a well-characterized and specific hemichannel blocking Connexin43 mimetic peptide, Peptide5 [9].
Connexin43 is overexpressed and Connexin43 hemichannels in the cell membrane open prematurely under pathological conditions [10–13]. Connexin hemichannels have consequently been termed “pathologic pores” and play a key role in the assembly of the inflammasome (NLRP3) [14]. The trigger is ATP release via the pathologic pore, resulting in ATP moving into the extracellular space acting as an inflammasome signal 2 activator [13]. In the eye, Connexin43 hemichannel block has been demonstrated to reduce inflammation and improve functional outcomes in both short- and long-term animal models of ocular disease [9, 15–21] and a reduction in Connexin43 protein levels in human ocular surface burns [22]. Connexin43 hemichannel block is a potential therapeutic target, acting upstream of current treatment modalities and enabling treatment at an earlier stage, including for dry age-related macular degeneration (AMD) and diabetic retinopathy (DR) [23, 24].
The current investigation was undertaken to assess blocking Connexin43 hemichannels with orally delivered tonabersat as a potential treatment for chronic retinal disease, using the well-characterized bright light damage preclinical model of retinal degeneration reflecting many aspects of dry AMD [17, 19, 25–27] and a novel, spontaneous rat DR model which accurately reflects the early stages of the human condition. This orally administered novel upstream treatment would offer a favorable alternative to current intraocular injection therapies, especially when treating bilateral eye disease. We sought to determine whether oral tonabersat would improve both functional and structural outcomes seen in electroretinogram (ERG) recordings and retinal optical coherence tomography (OCT). Inflammation was assessed using immunohistochemical labelling for commonly used retinal inflammatory markers, glial fibrillary acidic protein (GFAP; astrocytosis and Müller cell activation), Iba-1 (microglia immunoreactivity), and Connexin43.
Inflammation plays a significant role in the development of the pathogenesis of AMD and retinal degeneration [28, 29]. Here we show that orally administered tonabersat improved clinical signs in animal models of both DR and dry AMD with reduced inflammation leading to significantly improved functional and structural outcomes. Furthermore, the data demonstrated that reducing the perpetuated inflammasome-mediated inflammation in established chronic disease leads to significant rescue of retinal function.
Methods
Retina Light Damage Model of Dry Age-Related Macular Degeneration
The intense light damage (LD) model was described in our previous studies [17, 19, 25, 27]. It was selected as it allows direct comparison with our previously published work on this and other drugs [9, 17, 19]. The model demonstrates pathological factors of AMD (oxidative stress and inflammation) and allows for measurable endpoints (including electrical function of the retina). The disadvantage of this model is that, like in other rodent models, drusen do not develop. All experimental procedures were approved by the University of Auckland Animal Ethics Committee, approval no. 001462 and comply with the Association for Research in Vision and Ophthalmology (ARVO) statement for the use of animals in eye research. Six- to 8-week-old albino Sprague Dawley (SD) rats (200-250 g; male or female) were used. Adult SD rats were exposed to continuous bright light for 24 h, consistently starting at 9:00 am to minimize possible time-of-day variability. Light exposure was to two animals at a time to prevent rats from taking cover using each other as a shield. The LD protocol and intervention was repeated until the number of individuals for each dose group was obtained (n = 7 per group). The light luminance was 2700 lx, generated using fluorescent lamps (Philips Master TLD 18W/965; Koninklijke Philips Electronics N.V., China) directly above the animal cages. The lamps were cool and emitted broadband light, from 380 to 760 nm wavelength, with the average intensity at the top of the cage being 120 W/m2. Animals were free to move within the cage with access to food and water ad libidum. Baseline ERG readings and OCT images were collected prior to the light damage. After light exposure, animals were returned to normal light-dark cycle conditions (12 h light, 174 lx and 12 h darkness, < 62 lx) for 24 h, 1 week or 2 weeks (and for one group 3 months).
Tonabersat Treatment of Light-Damaged Rats
LD rats were randomly assigned to low, middle or high dose of tonabersat (n = 7 per group). The mixture of tonabersat in peanut butter was prepared fresh for each experiment. Three oral tonabersat doses were tested (n = 7 per group) with follow-up to 2 weeks post-injury, and the highest dose group then split with three animals taken for histological analysis, and four animals followed to 3 months post-injury. There was a ten-animal vehicle only control group. Rats that were kept for 3 months were maintained in separate cages for drug- or vehicle-treated animals, but were kept under the same light conditions. Tonabersat was fed to animals in peanut butter at 0.26 mg/kg (on average 0.08 mg delivered, estimated circulating concentration 10 μM), 0.8 mg/kg (average of 0.24 mg delivered; 30 μM circulating) or 2.4 mg/kg (on average 0.72 mg delivered; 90 μM circulating) based broadly upon previous human trial dosing levels [2, 30, 31]. Animals were fed immediately before the light exposure period; those which did not consume the drug were excluded from the study (n = 29 drug and vehicle-treated animals). The treatment groups were known to the investigator at the time of treatment, but groups were then randomized prior to statistical comparison which meant that analysis was conducted without the knowledge of which were treated or control animals.
In summary, adult rats were dark-adapted overnight and the ERG data collected. Animals were fed the vehicle or tonabersat before intense light exposure. Two weeks later animals were again assessed with ERG and OCT and tissue collection proceeded immediately after, except for four rats in the high-dose group that were under experimentation for 3 more months.
Hyperglycemic Rat Diabetic Retinopathy Model
A spontaneously hyperglycemic strain of SD rats, which developed clinical signs of diabetic retinopathy within 4 weeks of birth, were identified and isolated within the Vernon Jansen Animal Research Unit, Faculty of Medical and Health Sciences at the University of Auckland. The identification of these rats presenting with hyperglycemia and microaneurysms provided an opportunity to treat a complex, chronic disease model and assess the treatment effect based upon objective, measurable endpoints, despite lacking precise information on the etiology of the disease. Inbreeding was carried out over three generations and eyes were screened for abnormalities between 4 and 8 weeks of age. Additional information about these rats is presented as supplementary information. Glucose levels were tested in non-fasting rats [32] using a Freestyle Optium Glucometer (Abbott Laboratories Ltd., UK) and Freestyle Optium glucose strips.
Ten rats per group were selected (10 normal SD and 10 hyperglycemic) grown to 5 weeks of age and assessed using OCT and ERG. The hyperglycemic rat group was then split into two subgroups of five, with one subgroup fed tonabersat once daily for 14 days during weeks 6 to 7 at a low dose level of 0.28 mg/kg in peanut butter, with the other subgroup fed peanut butter only. All animals were assessed again using ERG and OCT at 8 weeks of age before euthanizing animals and removing the eyes for immunohistochemical analysis. Data groups were randomized prior to the statistical comparison.
In summary, normal SD and hyperglycemic rats were analyzed with OCT and ERG at 5 weeks of age; the hyperglycemic rats were then split into two groups and fed the vehicle or tonabersat for 14 days during weeks 6 and 7 of age. At week 8, animals were again assessed with ERG and OCT and tissues collected for immunohistochemical analysis.
Evans Blue Dye Assessment of Vessel Leak
To investigate whether micro- and macroaneurysms in the hyperglycemic rat retinas (observed using OCT) reflect sites of vessel leak, rats were perfused at the age of 3 months with Evans Blue dye as previously described [33]. Briefly, Evans Blue dye (30 mg/ml; Sigma-Aldrich, USA) was dissolved in normal saline and filtered. The dye was delivered as an injection into the rat-tail vein of normal SD and hyperglycemic rats at 45 mg/kg and allowed to circulate for 2 h. Eyes were enucleated although rats were under deep anesthesia and an intracardial injection of 3 M KCl was then administered rapidly to euthanize the animals. The posterior segment cups were fixed whole in 4% paraformaldehyde for 30 min and the retinas removed and laid flat. Evans Blue was excited at 559 nm wavelength and visualized by its red fluorescence emission using Olympus FluoView FV1000 (Olympus Corporation, Tokyo, Japan).
Electroretinogram Recording
The procedure was performed as described previously [34]. Essentially, SD rats were dark-adapted overnight for 12–14 h before the ERG recording. For the dry AMD model, the ERG baseline was recorded for all groups before LD and at time points after LD (24 h, 1 week, 2 weeks, and 3 months post intense light). For the DR model, ERGs were recorded at 5 weeks of age to compare normal SD and hyperglycemic rat retinal function. Tonabersat-treated and vehicle control hyperglycemic rats were assessed again at 8 weeks of age. After dark adaptation, rats were anesthetized by an intraperitoneal injection of a combination of ketamine (75 mg/kg, Parnell Technologies, New Zealand) and domitor (0.5 mg/kg, Pfizer, New Zealand). A dim red light generated by a light-emitting diode (λmax = 650 nm) was used during manipulations of dark-adapted animals. The corneas were maintained hydrated with 1% carboxymethylcellulose sodium (Celluvisc, Allergan, USA) during ERG recording. Right and left eye ERGs were recorded using gold ring electrodes (Roland Consult Stasche & Finger GmbH, Germany). A U-shaped active electrode was kept in contact with the center of the cornea. A V-shaped inactive electrode was hooked around the front teeth and in contact with the wet tongue. Normal body temperature was maintained to avoid temperature-driven ERG amplitude fluctuation by placing animals on a 37 °C heated pad.
Full-field ERG responses were elicited by a twin-flash (0.8 ms inter-stimulus interval) generated from a photographic flash unit (Nikon SB900 flash, Japan), via a Ganzfeld sphere. An integrating sphere approximately 650 mm in diameter and painted white internally was used to reflect the flash light onto the entire retina. The flash intensity range was from − 2.9 to 2.1 log cd.s/m2 and was attenuated using neutral density filters (Kodak Wratten, Eastman Kodak, USA), to obtain light intensities of − 3.9, − 2.9, − 1.9, 0.1, 1.1, 1.6, 1.8, and 2.1 log cd.s/m2. The flash intensity was calibrated using an IL1700 research radiometer (UV Process Supply Inc., USA). This study utilized a twin-flash paradigm for the isolation of rod and cone pathways. Paired flashes of identical luminous energy were triggered from the flash unit. The rod and cone mixed responses were recorded after the initial flash, and the response from the second flash was recorded and represents the function from the cones only. The rod PIII response was derived through digital subtraction of the cone response from the initial mixed response. The PIII component of the ERG is a direct reflection of rod photocurrent and the slope of the a-wave is more appropriately interpreted by taking into account the information about the photocurrent of rods after fitting their response to a computational model. For that, ERG data at the highest light level is fitted with a model of rod response assuming an initially linear rise of response amplitude with intensity, followed by saturation to reveal the PII (the bipolar cell component) and PIII (the photoreceptor component). Through this rod PII and PIII isolation, we can confirm that a-wave and b-wave ERG data correspond to alterations in both cone and rod pathways. The oscillatory potentials (OPs) are another way of investigating inner retinal function. OPs were isolated by subtracting the raw b-wave from the rod PII [35]. The summed amplitude of OPs 2, 3, and 4 were analyzed.
Recordings were performed in a Faraday cage to reduce electrical noise. The results of ERG signals were amplified 1000 times by a Dual Bio Amp (AD Instruments, Australia) and waveforms were recorded using Scope software (AD Instruments, New Zealand) and analyzed using published algorithms of the amplitudes of a-wave and b-wave of each eye [19, 34]. To achieve 80% power, and with an alpha value of 5%, we determined that the ERG studies need a sample size of 5.
Optical Coherence Tomography
Spectral domain optical coherence tomography (SD-OCT; Micron IV; Phoenix Research Laboratories, USA) was employed to obtain information on in vivo retinal layer morphology. OCTs were executed immediately after ERG recordings had been taken, with the animals still under anesthesia and with pupils dilated using 1% Tropicamide (Bausch & Lomb New Zealand Ltd., New Zealand) [19]. Rats were placed on a 37 °C heating pad to maintain body temperature and to prevent the development of cold cataracts. Eyes were covered with Poly Gel (containing 3 mg/g Carbomer; Alcon Laboratories Pty Ltd., Australia) and the retina was imaged by contacting the OCT lens to the gel. StreamPix 6 software, version 7.2.4.2 (Phoenix Research Laboratories, USA) was used for image acquisition. The SD-OCT horizontal line B-scan had 2-μm axial resolution and consisted of 1024 pixels per A-scan. Ten B-scans acquired 2 mm from the optic nerve in the dorsal retina were taken and averaged. Images were analyzed using InSight software, version 1.1.5207 (Phoenix Research Laboratories, USA). Choroidal layer thickness was measured from the hyper-reflective Bruch’s membrane to the choroidal-scleral interface. Outer nuclear layer (ONL) thickness was measured from the outer limiting membrane (OLM) to the outer plexiform layer (OPL) interface.
Tissue Collection and Processing
At the end of the final OCT recording, rats was deeply anesthetized using a combination of ketamine (75 mg/kg, Parnell Technologies, New Zealand) and domitor (0.5 mg/kg, Pfizer, New Zealand). Animals were perfused transcardially with saline for 2–3 min followed by 30 min perfusion with 4% paraformaldehyde in a 0.1 M phosphate buffer, pH 7.4 (PB). Eyes were dissected from the orbit and the eyecups further immersion fixed in 4% paraformaldehyde, 30 min before washing in PB. Tissues were then cryo-protected by taking them through 10% and 20% sucrose/PB solutions at room temperature for 30 min each, before soaking in 30% sucrose/PB at 4 °C overnight. Tissue were then embedded in optimum cutting temperature compound (Sakura Finetek, Torrance, USA) for cryosectioning (16-μm section thickness) in the vertical plane using a Leica CM3050 S cryostat (Leica, Germany). Sections were collected on Superfrost Plus slides (Labserv, New Zealand) for immunohistochemical labelling. For the DR animals, we also collected spleen, pancreas, liver, heart, and kidneys from randomly selected vehicle-injected animals (see supplementary information).
Immunohistochemical Labelling of Tissue Sections
Frozen tissue sections were air-dried at room temperature for 10–15 min and washed with 0.1 M PB. Sections were encircled with a PAP pen (Invitrogen, New Zealand) to form incubation wells and blocked with 6% normal goat serum or donkey serum (Invitrogen, USA), 1% bovine serum albumin (BSA), and 0.5% Triton X-100 in 0.1 M PB for 1 h at room temperature. Primary antibodies included rabbit anti-Connexin43 (1:1000, Cat C6219, Sigma-Aldrich, USA), mouse anti-Iba-1 expressed specifically by microglial cells (ionized calcium-binding adapter molecule 1, 1:250, Cat Ab5076, Abcam, USA), and mouse anti-GFAP for astocytes and activated Müller cells (1:1000, Cat C9205, Sigma-Aldrich, USA) antibodies. Sections were incubated with primary antibody overnight at room temperature and then washed four times for 15 min each in 0.1 M PB. The secondary antibody, goat anti-rabbit or goat anti-mouse conjugated with Alexa Fluor 488 or Alexa Fluor 594 (Invitrogen, Australia), was diluted at 1:500 and applied for 2–3 h in the dark at room temperature. The slides were then washed thoroughly with 0.1 M PB and cell nuclei stained with DAPI (1:1000; Sigma-Aldrich, USA) before cover slipping with anti-fading medium (Citifluor Ltd., UK). Coverslips were sealed with nail polish. Sections were imaged using an Olympus FluoView FV1000 confocal laser scanning microscope fitted with 405, 473, and 559 nm wavelength excitation lasers (Olympus Corporation, Japan).
Statistical Analysis
Graphing and statistical analyses were performed using GraphPad Prism 5 (GraphPad Software, USA). All data is presented as the mean ± the standard error of the mean (SEM). Functional and morphological data were compared using analysis of variance (ANOVA) with an alpha value of 0.05. A two-way ANOVA followed by a Bonferroni post-hoc test was used in the ERG response analysis to compare the effect of stimulus intensity. A one-way ANOVA followed by Tukey’s test was used in the ERG response at the intensity of 2.1 log cd.s/m2 in control and LD animals and also in the OCT data analysis. Statistical analysis of rod PII and PIII was performed using an unpaired t test with a Welch’s correction, assuming the distribution of means across samples was normal as in our previous studies [17, 19].
Results
Effect of Tonabersat on the Bright Light Damage Model of Retinal Degeneration
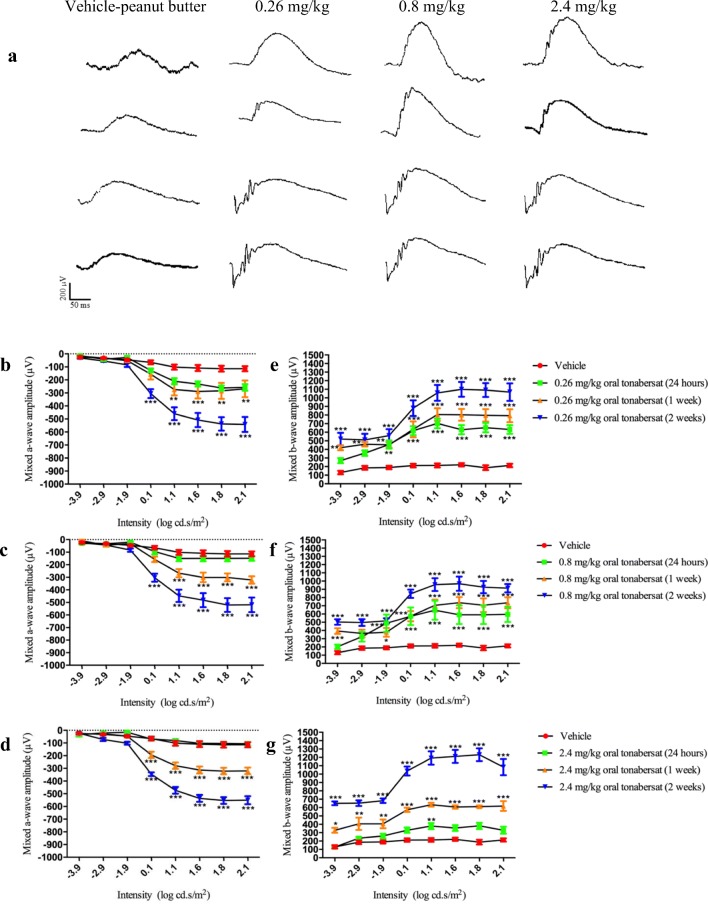
Mixed a-wave ERG data, plotted for the range of light intensities tested, results in a negative deflection, increasing with flash intensity from lower to mid-range levels. The mixed b-wave ERG response is a positive deflection and is consistent for most flash intensities. Following 24 h of light exposure, ERG responses of the SD rats were significantly attenuated with a maximum a-wave amplitude of − 100 μV. ERG data are shown in Fig. 1 for the vehicle fed group of animals at 2 weeks post-injury and for each of the three treatment doses at 24 h, 1 week, and 2 weeks post light damage. At 24 h post light exposure, there were no differences between the vehicle control group and any of the three tonabersat dose groups (Fig. 1). However, significant improvements in mixed a-wave amplitude in both 0.26 mg/kg and 0.8 mg/kg treated animals compared to the light-damaged control group were seen at 1-week post-treatment (p < 0.01; Fig. 1b-c) and at a wider range of intensities: 0.1–2.1 log cd.s/m2, in the 2.4 mg/kg treatment group (p < 0.001; Fig. 1d). By 2 weeks post-treatment all three doses of oral tonabersat trialed gave a significant recovery in mixed a-wave amplitude (p < 0.001, Fig. 1b-d) at intensities 0.1–2.1 log cd.s/m2. These animals had an almost 500 μV improvement in ERG a-wave at the highest intensity employed over the vehicle-treated LD group (p < 0.001; Fig. 1b-d), with treatment causing recovery of the ERG function only slightly less than the SD rat average of about − 600 μV.
Fig. 1.
Raw ERG waveforms for vehicle or drug-treated animals (a). Effects of vehicle and tonabersat on mixed a-wave and b-wave amplitude of the ERG using 0.26 mg/kg (b, e), 0.8 mg/kg (c, f), and 2.4 mg/kg (d, g) tonabersat. Vehicle data shown is at 2 weeks post-injury; in these animals, there is no recovery of ERG function. Statistical analysis was performed using a two-way ANOVA and a Bonferroni post hoc test. Significant values are indicated with asterisks: *p < 0.05; **p < 0.01; ***p < 0.001
There was significant improvement in mixed b-wave function for 0.26 and 0.8 mg/kg tonabersat-treated groups 24 h after treatment (Fig. 1e-f), not seen in the high dose treatment group (Fig. 1g). However, an overt improvement in inner retinal function was seen as increased mixed b-wave amplitude throughout all stimulus intensities by 1 and 2 weeks post-treatment for all three doses of tonabersat (Fig. 1e-g). The highest dose of tonabersat, 2.4 mg/kg, showed the highest improvement (on average 1200 μV) which is in the normal range for undamaged SD rats in the absolute amplitude of the b-wave [36]. For 0.26 and 0.8 mg/kg, there was an improvement (on average 1000 μV) in the absolute amplitude of the b-wave. Nonetheless, at the end of the 2-week recovery period, all tonabersat-treated animal mixed a-wave and mixed b-wave functions were within the range of variance for normal, undamaged SD rats [36].
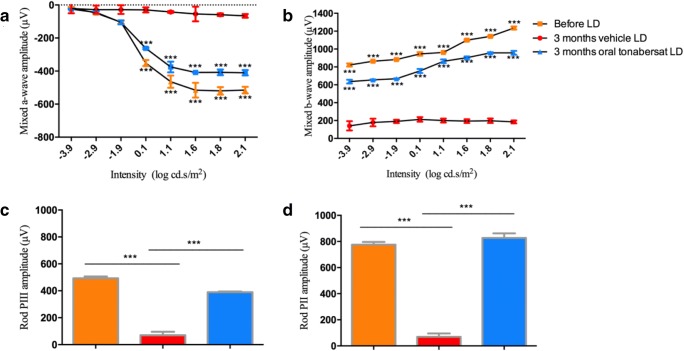
A cohort of 4 animals treated with the highest dose of oral tonabersat (2.4 mg/kg) was maintained for 3 months under normal breeding and food access conditions. The benefit of the single orally administered tonabersat dose was maintained long term. The ERG a-wave and b-wave wavelength amplitudes in the original 7 treated animals assessed at 2 weeks following oral tonabersat (2.4 mg/kg) were only slightly lower compared to the cohort of 4 treated animals taken through and assessed 3 months after orally administered tonabersat. In the a-wave, there was an improvement in photoreceptor function exceeding 400 μV and in the b-wave, the amplitude exceeded 800 μV compared with vehicle-treated controls (Fig. 2a, b). In the PIII rod and PII rod response, there was no change 3 months after oral tonabersat treatment compared to before LD, suggesting that tonabersat treatment had completely preserved photoreceptor function. In contrast, changes in rod PIII and rod PII amplitudes were significantly reduced in the vehicle only-treated LD group at 3 months (p < 0.001; Fig. 2c, d).
Fig. 2.
Effect of vehicle and 2.4 mg/kg of tonabersat on mixed a-wave (a) and b-wave (b) amplitude on the ERG 3 months post-treatment of light-damaged rats. The rod PIII (c) and PII (d) analysis shows untreated animals have significantly reduced amplitudes compared to their amplitude prior to light damage. Treated animals have maintained retinal function, matching the controls for Rod PII and only slightly lower for Rod PIII. All average data are expressed as mean ± SEM. Statistical analysis was performed using a two-way ANOVA and a Bonferroni post hoc test of the a- and b-wave values. Statistical analysis of rod PII and PIII was performed using an unpaired t test with a Welch’s correction. Significant values are indicated with asterisks: ***p < 0.001. LD = light damage
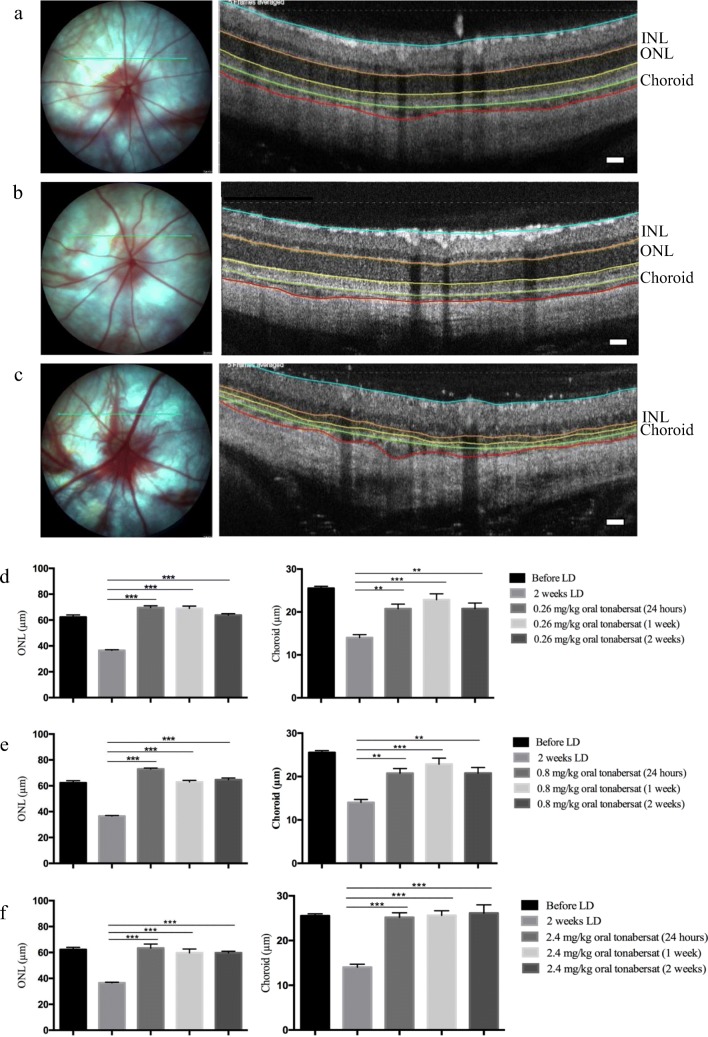
Analysis of retinal layers and choroidal thickness was conducted using OCT scans at 24 h, 1 week, and 2 weeks post-injury. Figure 3 shows the typical appearance of the fundus and OCT scans for a normal adult SD rat, a vehicle-treated light-damaged rat and a 2.4 mg/kg tonabersat-treated animal 2 weeks after LD (Fig. 3a-c). There was significant thinning of both the retina and choroid in vehicle-treated animals evident at the 2-week time point compared to the same eyes prior to LD (p < 0.001; Fig. 3a, b). The loss of retinal thickness was primarily owing to thinning of the ONL. However, all three doses of oral tonabersat significantly preserved both retinal and choroidal thickness, with no thinning detected at any of the post-treatment time points (24 h, 1 week, and 2 weeks) investigated (Fig. 3d-f).
Fig. 3.
Effect of oral delivery of tonabersat on the light-damaged rat retinal and choroidal thickness. Fundus and OCT images of normal SD rats (a), 2.4 mg/kg tonabersat-treated animals 2 weeks after LD (b), and vehicle-treated LD rats (c). The green line on the fundus image represents the scan location of the adjacent cross-sectional OCT image. The colored lines on the OCT images highlight the inner limiting membrane (cyanin), the OPL (orange), the ONL (orange to yellow), the choroid (green to red). Quantification shows that both the ONL and choroid are thinner by 2 weeks post LD in vehicle-treated animals compared to normal (pre-light exposure). Treated animals for each of the three tonabersat doses used did not show any thinning in the ONL or choroid at any of the time points analyzed, 24 h, 1 week, and 2 weeks post LD (rows d-f). Although there was some thinning at the lowest and middle dose, it was not significant. ** = p < 0.01; *** = p < 0.001. Scale bar = 100 μm
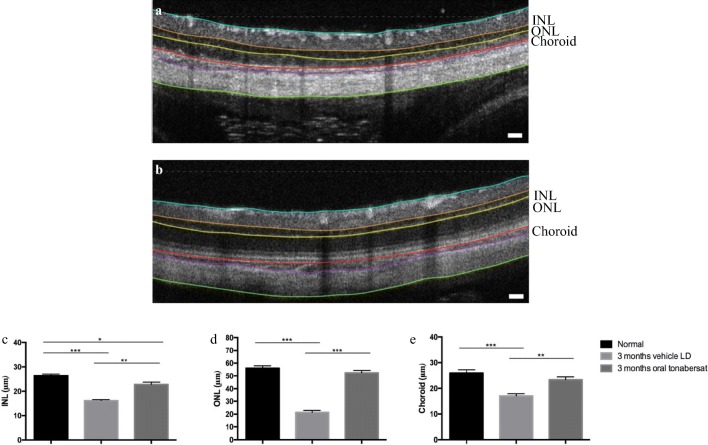
OCT analysis 3 months post-treatment following 2.4 mg/kg orally administered tonabersat showed both the retinal and choroidal thicknesses were significantly preserved compared to the vehicle treatment group (p < 0.001; Fig. 4a-b). Retinal thinning was evident in both the inner nuclear layer (INL; Fig. 4c) and ONL (Fig. 4d) layers in vehicle-treated animals but there was no difference in ONL thickness in oral tonabersat-treated animals compared to the same animals prior to the LD procedure. The thickness of the INL in the 3 months oral tonabersat-treated group was slightly reduced compared to the same animals imaged prior to the LD procedure (p < 0.05). The vehicle-treated rats showed significant INL thinning compared to the same retinas prior to the LD procedure (p < 0.001). There was no difference in choroidal thickness between oral tonabersat-treated rats at 3 months and the same rats assessed prior to the LD procedure (Fig. 4e). In contrast, vehicle-treated LD rats assessed at 3 months post-injury had significant thinning of the choroid (p < 0.001).
Fig. 4.
Effect of vehicle (a) or tonabersat treatment (2.4 mg/kg) 3 months after LD (b). Representative OCT images show significant thinning in the vehicle-treated animals, with thinning evident especially in the INL, ONL, and choroid. The colored lines on the OCT images highlight the inner limiting membrane (cyanin), the INL (orange to yellow), the ONL (yellow to red), the choroid (red to purple), and the sclera (purple to green). Measurements of the INL, ONL and choroid thickness are shown in c-e for retinas prior to injury, vehicle treated animals at 3 months post LD, and tonabersat-treated animals 3 months post LD. Data are expressed as mean ± SEM. Significant values in comparison with the vehicle LD group are indicated with asterisks: *p < 0.05; **p < 0.01; ***p < 0.001. LD = light damage. Scale bar = 100 μm
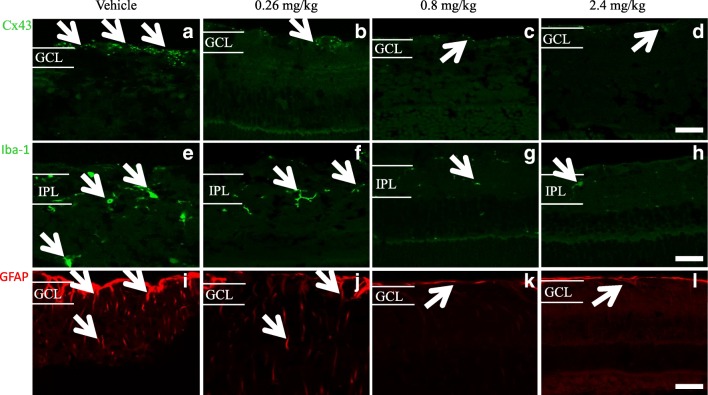
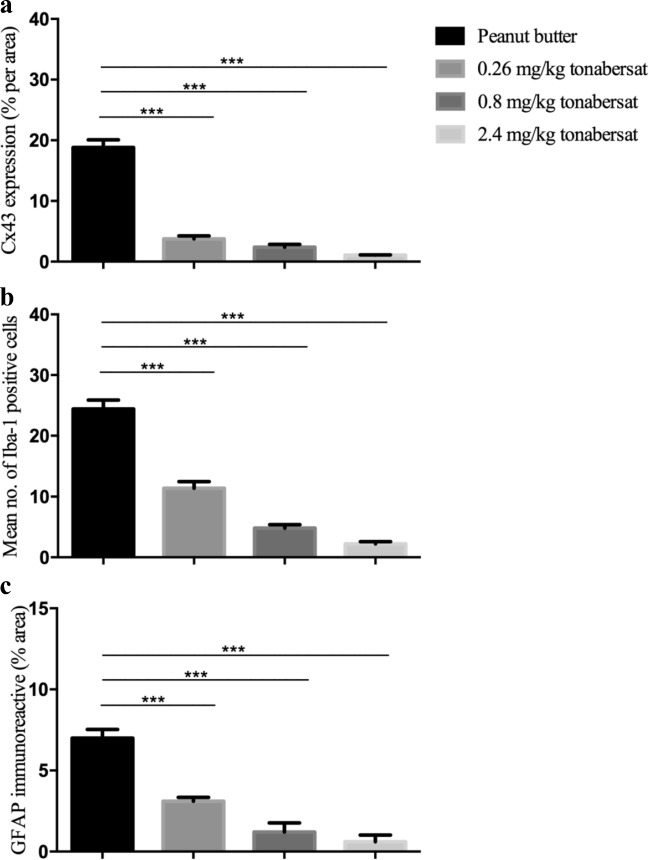
Following final ERG and OCT assessments, eyes were removed and the posterior segment of the eyes containing the retina and the attached RPE-choroid-sclera assessed using immunohistochemical labelling of GFAP to investigate the extent of gliosis (astrocytosis), Iba-1 to determine the microglia immunoreactivity pre- and post-treatment, and Connexin43. Compared to vehicle-treated rats (Fig. 5a), tonabersat-treated rats showed less Connexin43 immunoreactivity in the retina at all three tonabersat doses used (Figs. 5b-d). Iba-1 immuno-labeled cells were less active compared to vehicle treatment (Fig. 5e) in the inner plexiform layer (IPL) of the retina in the drug-treated groups (Fig. 5f-h). A slightly higher level of Iba-1 reactivity was seen in the 0.26 mg/kg treated rats. GFAP immunoreactivity did not increase in the retina of 0.8 mg/kg tonabersat (Fig. 5k) and 2.4 mg/kg tonabersat (Fig. 5l) compared to vehicle (Fig. 5i) treated rats. In the 0.26 mg/kg dosed animals, there was a slight increase in GFAP labelling (Fig. 5j) but this was significantly less than that seen in vehicle-treated rats. Image quantification showed significantly less GFAP, Connexin43, and Iba-1 levels in all tonabersat-treated groups compared with the vehicle controls (p < 0.001) (Fig. 6a-c), with a tendency to dose response (higher doses more effective at maintaining normal levels of these retinal inflammation markers).
Fig. 5.
Immunohistochemical analysis of the effects of the three concentrations of oral tonabersat on LD rats. Orally treated rats showed less Connexin43 immunoreactivity in the retina for all three dose levels (b-d) compared to the vehicle group (a). Iba-1 immunolabeled cells showed low activation (sprouting) in the IPL of the retina of tonabersat-treated rats for all three doses (f-h) compared to vehicle-treated rats (e) although a slight increase in Iba-1 reactivity in the lowest 0.26 mg/kg oral dose was evident. GFAP immunoreactivity did not increase in the retina of 0.8 mg/kg tonabersat (k) and 2.4 mg/kg tonabersat (l) as compared to vehicle rats (i). In the lowest 0.26 mg/kg oral dose group, there was slightly increased GFAP labelling but this was still less expression than for the vehicle alone group (j). Abbreviation: GCL, ganglion cell layer; IPL, inner plexiform layer. Scale bar, 50 μm
Fig. 6.
Quantification of Connexin43 expression (a), mean number of Iba-1 activated cells (b) and GFAP immunoreactive area (c) in each of the three oral tonabersat dose treated animals compared with vehicle alone of LD rats. Analysis revealed significantly less upregulation of GFAP and Connexin43 in all three tonabersat-treated groups compared with vehicle (p < 0.001) (a-b). Quantification of the Iba-1 positive cells revealed a significantly reduced number of active microglia in all three tonabersat-treated groups compared with vehicle (p < 0.001) (c). Statistical analysis was conducted using one-way ANOVA, followed by Tukey’s multiple comparisons test. Significant values in comparison with results from the untreated group are indicated with asterisks: *p < 0.05; **p < 0.01; ***p < 0.001
Effect of Tonabersat on the Hyperglycemic Rat with Diabetic Retinopathy
The average body weight of control SD rats was 185 ± 1.1 g at 4 weeks of age, 198.2 ± 0.8 g at 6 weeks, and 217.5 ± 1.3 g at 8 weeks. The hyperglycemic rats had a lower body weight with 172.5 ± 2.5 g at 4 weeks of age, 179.6 ± 2.1 g at 6 weeks, and 183.1 ± 1.8 g at 8 weeks. The difference between all three age groups compared to age matched normal SD rats was statistically significant (t test, p < 0.001). Blood glucose readings in normal SD rats ranged from 4.9 to 7.4 mmol/L (average 6.07 mmol/L with no significant difference between age groups); in the hyperglycemic rats, glucose levels were 14.0–21.0 mmol/L with the average being 16.85 ± 0.63 mmol/L at 4 weeks, 15.43 ± 0.79 mmol/L at 6 weeks, and 16.54 ± 0.65 mmol/L at 8 weeks, the level of hyperglycemia remaining consistent from a young age. The difference between hyperglycemic rats of all three age groups and normal SD rats was statistically significant (t test, p < 0.001).
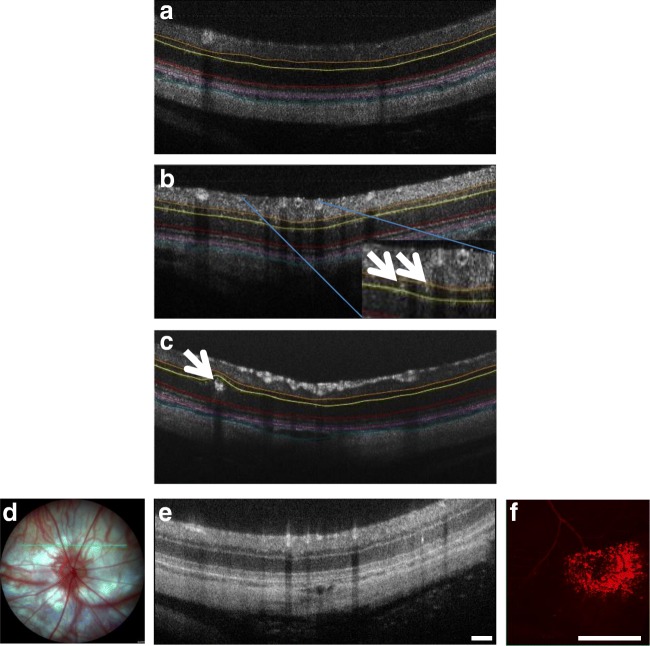
Slit lamp examination of the anterior segment (cornea, lens) of hyperglycemic rats at 4 weeks of age did not reveal any obvious macroscopic differences compared to normal SD rats from which this strain was derived. The cornea, lens, and iris appeared to be identical to normal SD rats, and there were no signs of diabetic cataract or neovascularization. However, OCT of the hyperglycemic rats revealed an average of 5–8 hyper-reflective spots per eye (based upon 7 evenly spaced OCT scans across the retina and therefore an underestimate for the whole eye), but no more than 1–2 in normal SD rats. The hyper-reflective spots appeared to be microaneurysms (20–30-μm diameter) and macroaneurysms (140–160 μm) (Fig. 7b, c) and they were located specifically in the INL and ONL. There were no significant changes in retinal or choroidal thickness, although the choroid appeared to be slightly reduced in thickness in animals with aneurysms. Evans blue dye perfusion confirmed blood vessel leakage at sites of the aneurysms mapped using OCT (Fig. 7f).
Fig. 7.
Representative OCT images of the hyperglycemic rats showing an average of 5–8 hyper-reflective spots per eye (based upon 7 evenly spaced OCT scans across the retina and therefore an underestimate for the whole eye), but none in normal SD rats (a). The hyper-reflective spots appeared to be microaneurysms (less than 20-μm diameter; arrows in b) and macroaneurysms (140–160 μm; arrow in c) and they were located specifically in the INL and ONL. The colored lines on the OCT images highlight the INL (orange to yellow), the ONL (yellow to red), the choroid (purple to cyanin). Evans Blue dye perfusion confirmed blood vessel leakage at sites of the aneurysms mapped using OCT. The green line on the fundus image (d) shows in which location the OCT scan (e) was taken. The hyper-reflective spot (arrow) is a microaneurysm. The rats were injected with Evans Blue and the retina was then removed and imaged in that region revealing a region of vessel leak (f). Leakage was not associated with all microaneurysms but blood vessel leakage was consistently seen in four hyperglycemic rats with microaneurysms. Scale bar = 100 μm
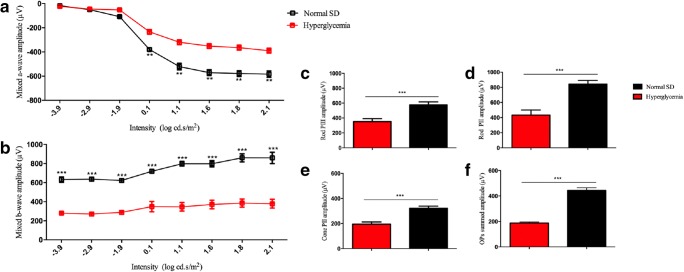
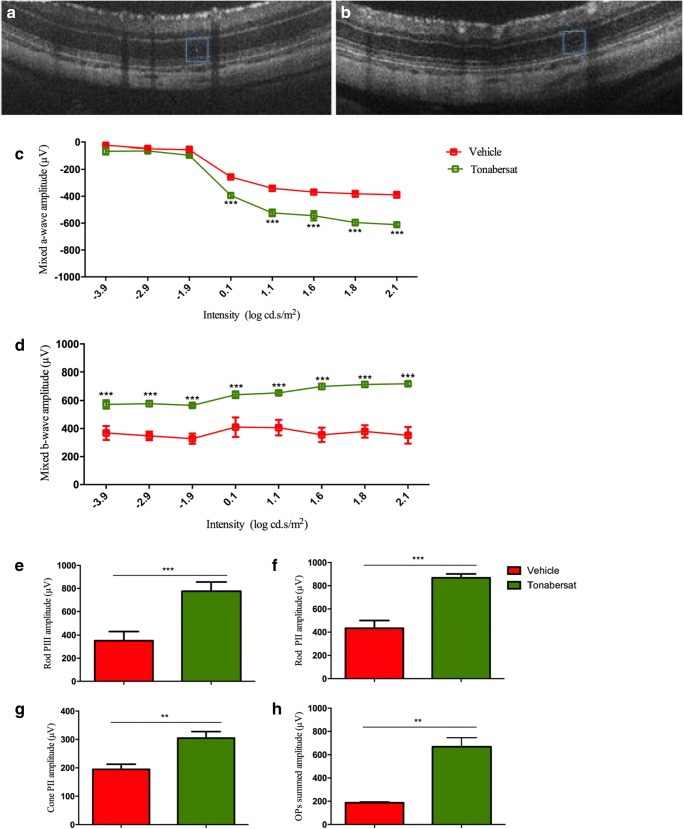
To determine whether the aneurysms affected retinal function, ERG analysis was carried out at 5 weeks of age to compare hyperglycemic rats retinal function with that of normal SD rats. Representative ERG waveforms are shown in Fig. 8a, b. The average mixed a-wave amplitude was significantly reduced in hyperglycemic rats compared with normal SD rats for intensities 0.1–2.1 log cd.s/m2 (p < 0.01), with normal SD rats measuring − 630 μV at the highest intensity, compared to − 370 μV in the hyperglycemic diabetic rat retina. Mixed ERG b-wave amplitude was also significantly reduced in hyperglycemic rats for intensities − 3.9–2.1 log cd.s/m2 (p < 0.001), with normal SD rats showing a maximum intensity of 800 μV but only 400 μV in diabetic animals. There was no difference between a-wave and b-wave implicit times. Further analysis revealed amplitudes were significantly reduced in the hyperglycemic rats for rod PIII (p < 0.001), PII (p < 0.001), cone PII (p < 0.001) responses, and for Oscillatory Potentials (OPs) summed amplitude (p < 0.001) (Fig. 8c-f). There were no significant changes in rod PIII sensitivity or rod PII, cone PII, and OPs summed implicit times.
Fig. 8.
ERG analysis of hyperglycemic retina function 5 weeks after birth compared with normal SD rats from which the hyperglycemic strain was derived. Representative ERG mixed a- and b- waveforms are shown in a, b. The average mixed a-wave amplitude was significantly reduced in hyperglycemic rats compared to normal SD rats. Mixed b-wave amplitude was also significantly reduced in hyperglycemic rats, with normal SD rats. Breakdown analysis shows amplitudes were significantly reduced in the hyperglycemic rats for rod PIII (c), PII (d), cone PII (e) responses and for OPs compared with the control group (f). Statistical analysis was conducted using one-way ANOVA, followed by Tukey’s multiple comparisons test. Significant values in comparison with normal SD are indicated with asterisks: *p < 0.05; **p < 0.01; ***p < 0.001. OP = oscillatory potentials
For the tonabersat DR treatment arm, 10 hyperglycemic rats grown to week 5 were split into two equal groups with one group fed tonabersat once daily for 14 days from weeks 5 to 7 at a low dose level of 0.28 mg/kg. At week 8, there was no difference in body weight between treated and untreated hyperglycemic rats, and no significant difference in retinal layer thickness (INL or ONL) or the thickness of the choroid. However, there were differences in the number and size of microaneurysms after treatment (Fig. 9a, b). Retinal function had significantly recovered in drug-treated hyperglycemic rats compared to vehicle-injected hyperglycemic rats (Fig. 9c). In treated animals, mixed ERG a-wave was significantly higher at intensities 0.1–2.1 cd.s/m2 (p < 0.001), maximum intensity − 630 μV compared to − 370 μV in untreated animals at 8 week, and closely matching undamaged control SD rat levels (Fig. 8a). Similarly, mixed b-wave signals had significantly recovered in the tonabersat-treated animals for all intensities (p < 0.001), with maximum intensity of 700 μV compared to only 400 μV at this time point in the untreated controls (Fig. 9d), and again had recovered to near normal SD rat mixed b-wave values (Fig. 9c). Implicit times were not different. Further analysis revealed that treated hyperglycemic rats had significantly recovered rod PIII (p < 0.001), PII (p < 0.001), cone PII (p < 0.01), and summed OPs (p < 0.01) amplitudes (Fig. 9e-h). There was no difference in implicit times between pre- and post-treatments.
Fig. 9.
OCT and ERG analysis of hyperglycemic rat retinal structure and function at 8 weeks (at the lowest dose used, 0.28 mg/kg) once daily for 14 days (weeks 5–7) compared with vehicle-treated animals. (a) A hyper-reflective spot that is barely visible after treatment (b). ERG had significantly recovered in treated hyperglycemic rats compared with vehicle-treated rats, whereas untreated rats had deteriorated further from week 5 to 8. In treated animals, mixed a-wave was significantly higher compared to vehicle-treated animals at 8 week (c). Similarly, mixed b-wave had significantly recovered in the tonabersat-treated animals for all intensities, compared to vehicle control group (d). Further analysis revealed that treated hyperglycemic rats had significantly recovered rod PIII (e), PII (f), cone PII (g), and summed OPs (h) amplitudes. Statistical analysis was conducted using one-way ANOVA, followed by Tukey’s multiple comparisons test. Significant values in comparison with vehicle treatment are indicated with asterisks: *p < 0.05; **p < 0.01; ***p < 0.001. OP = oscillatory potentials. Scale bar = 100 μm
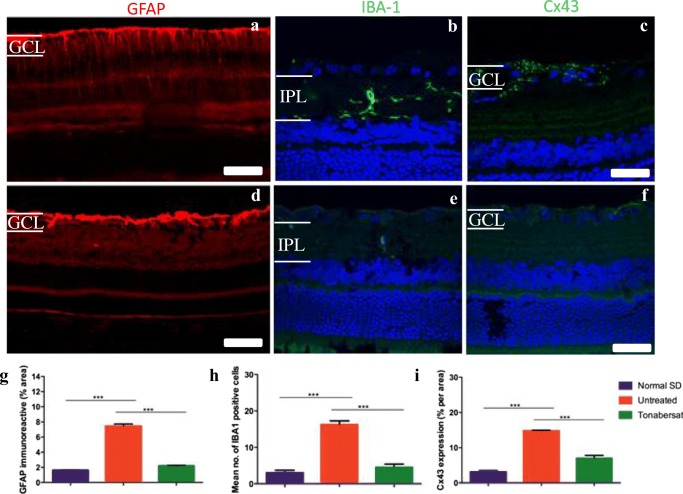
To determine whether the differences seen with OCT and ERG in the hyperglycemic rats correlated with retinal inflammation, eyes were removed for immunohistochemical examination at 8 weeks. GFAP labelling was intense in the retinal ganglion cell (RGC) layer and gliosis was visible in areas around microaneurysms in the hyperglycemic rat retinas, and extended from the nerve fiber layer (NFL) to the ONL indicating Müller cell activation (Fig. 10a). There was abnormally high Iba-1 labelling in the hyperglycemic retinas (Fig. 10b) indicating activated microglia in the inner retinal layers in which cells with enlarged soma and numerous elongated branches were present, and Connexin43 labelling was abnormally high in the GCL of hyperglycemic rats (Fig. 10c). Hyperglycemic rats that had been dosed with tonabersat daily for 14 days had reduced inflammation as evident by reduced labelling for all three markers (Fig. 10e-f). Quantification of the results is shown in Fig. 10g, with all three markers, GFAP, Connexin43 and Iba-1 significantly higher in untreated hyperglycemic rats compared to undamaged control retinas (p < 0.001), and all three treated groups recovering to normal at 8 weeks of age, and showing significantly less labelling than untreated rat retina levels (p < 0.001).
Fig. 10.
Immunohistochemical labelling in tonabersat-treated and vehicle-treated hyperglycemic rats at 8 weeks of age. GFAP labelling was intense in the GCL, in which astrocytes are resent in areas around microaneurysms in the hyperglycemic rat retina, extending from the nerve fiber layer to the ONL indicating Müller cell activation (a). There was abnormally high Iba-1 labelling in the hyperglycemic retina (b) in the IPL in which cells with enlarged soma and numerous elongated branches were present and Connexin43 labelling was abnormally high in the GCL of the untreated animals (c). Hyperglycemic rats that had been fed daily with tonabersat for 14 days had reduced inflammation as evident by labelling of all three markers (d-f). Quantification of the results in g-i shows that all three markers, GFAP, Connexin43 and Iba-1 were significantly higher in vehicle-treated rats compared to undamaged control retina and tonabersat treatment resulted in significantly reduced labeling at 8 weeks, and significantly less than untreated rat retina levels. Statistical analysis was conducted using one-way ANOVA, followed by Tukey’s multiple comparisons test. Significant values in comparison with results from the untreated group are indicated with asterisks: *p < 0.05; **p < 0.01; ***p < 0.001. Scale bars = 100 μm
Discussion
The aim of this study was to assess the effect of tonabersat on phenotypical models of retinal disease. Tonabersat is a clinical stage drug which was previously evaluated in phase II clinical trials for the prophylaxis of migraine. Tonabersat did not continue through clinical trials because it only benefited patients suffering migraine with aura [1], suggesting that its mode of action was misunderstood and an inappropriate clinical indication was targeted. Subsequently however, tonabersat has been shown to be a connexin43 hemichannel blocker [9, 21], this being a different mode of action than assumed when used for migraine. In the bright light model of dry AMD, similar findings with respect to protecting the retina and its function were observed with tonabersat compared to the mimetic peptide [9, 17, 19]. More importantly, the study shows the relative benefit of oral administration of tonabersat in animal models considered to follow a degenerative inflammatory pathway representative of dry AMD as well as in a novel chronic model of DR. Previous reports indicate that tonabersat crosses the blood-brain barrier to achieve therapeutic effects [3, 4, 8, 9]. In the bright light model, oral administration of 0.26, 0.8, and 2.4 mg/kg tonabersat conferred significant neuroprotection with concentrations equivalent to 18.2 mg, 56 mg and 168 doses in an average 70 kg human. Doses used in previous phase II clinical trials for migraine prophylaxis were 20 to 80 mg once daily [4]. Tonabersat is rapidly absorbed with a tmax of 0.5–3 h [37] and has a terminal half-life of 24–40 h [38]. In the light-damaged albino rat model, two specific tissue areas, the RPE and the choroid, develop oxidative stress and inflammation before the retina does [25]. In previous studies, we have shown that modulation of connexin hemichannnels suppresses this macrophage-mediated inflammatory response in the choroid and prevents further retinal toxicity [19]. Tonabersat conferred a similar effect, revoking a significant portion of the continuing damage spread resulting from bright light damage, with downstream benefits evident through to 3 months post-injury. The effect is likely mediated by inhibition of inflammasome activation as Brandstetter et al. [39] confirmed that photo-oxidative damage activates RPE cell release of biochemical signals for inflammasome assembly, and hemichannel block prevents release of signals that activate and perpetuate that pathway [13]. The hemichannel mode of action supports the idea that tonabersat is appropriate for treating ocular (and other inflammasome mediated) chronic diseases.
In the present study, the effects of orally administered tonabersat were investigated in order to determine its effectiveness in protecting retinal structure and function. A single dose of tonabersat, ingested orally, was neuroprotective over the period assessed (out to 3 months) post-acute light damage injury. It was discovered that tonabersat significantly preserved the function of the retina, in particular the function of photoreceptors and bipolar cells in the inner retina. Furthermore, increased oscillatory potentials using any of the three doses studied is indicative of a protective effect on inner retinal cells despite the light damage. The improved PIII and PII responses in the ERG are also indicative of specific protection of the phototransduction pathway and post-photoreceptor neuron response. This study also showed that tonabersat preserved the retinal layer structure as measured by OCT.
The effect of the drug seems to be through its action as a Connexin43 hemichannel blocker as is the well-characterized Connexin43 mimetic peptide, Peptide5 [9, 17, 19, 40]. Connexin43 expression is often elevated during cellular insults, and Connexin43 hemichannel block which shuts down the recycling pathological assembly of the inflammasome has been shown to be beneficial in multiple central nervous system (CNS) injury and disease models such as spinal cord injury [19, 40–42], chronic pain [43], retinal injury and disease [9, 15–17, 19–21], Parkinson’s disease [44], Alzheimer’s disease [45], brain ischemia and cerebral palsy [46–48], muscular dystrophy [49, 50], multiple sclerosis, amyotrophic lateral sclerosis [51, 52], and epilepsy [53].
In the intense light exposure, rat model alterations in the retina and choroid including endothelial cells of the choriocapillaris lead to inflammation via Connexin43 hemichannel opening [25]. Tonabersat appears to be conferring protection by blocking open hemichannels [9]. Although inflammasome markers specifically were not assessed in this study, the hallmarks of CNS stress, upregulation of GFAP in astrocytes and Müller cells (signs of reactive gliosis), Iba-1 positive microglia, and Connexin43 upregulation, which have all been associated with NLRP3 inflammasome activation [54], were decreased with tonabersat treatment. These findings indicate that oral tonabersat protects against the sequence of events resulting from intense light damage to the rat retina which is considered phenotypical of dry AMD.
Furthermore, oral tonabersat was effective in shutting down signs of DR occurring secondary to spontaneous and chronic systemic hyperglycemia in a diabetic SD rat model. Signs of micro- and macroaneurysms in the retina accompanied by an impact on retinal function were observed in this phenotypical model of diabetes and DR. The pathogenesis of aneurysms is due to a combination of several mechanisms causing blood vessel wall weakness and subsequent aneurysmal dilatation. In our previously published paper [55], we showed that the addition of an inflammatory environment to a mouse model of diabetes (NOD mice) results in the development of DR signs, including formation of aneurysms and edema within 1 week of injecting proinflammatory cytokines into the eye. Although the main mechanisms thought to underlie aneurysm formation includes focal ischemia to blood vessel walls, and chronic hypertensive vascular wall damage, we demonstrated that it was essentially the inflammatory environment of the retina that lead to vascular damage. In that animal model, we were able to reduce signs of the pathology when a connexin hemichannel blocker was applied [20]. We hypothesize that the mechanism of action is similar in both diabetic and hyperglycemic models, in which tonabersat is acting on hemichannels, and results in reduced inflammation. Tonabersat acts on pathologic connexin hemichannels which release the ATP responsible for activation of the inflammasome pathway and leads to perpetuation of inflammation in chronic disease. Thus, tonabersat is not only a treatment for inflammation related ocular conditions but also has potential for other chronic diseases in which the inflammasome pathway has been implicated [47, 56].
The results from these quite disparate models have implications for other chronic inflammatory diseases, in particular those involving the inflammasome pathway. Inhibiting the inflammasome pathway in macular degeneration and diabetic retinopathy models using the oral Connexin43 hemichannel blocker tonabersat reduces inflammation, sparing retinal structure and function.
Electronic Supplementary Material
(DOCX 17 kb)
(PNG 5154 kb)
Acknowledgments
This work was supported in part by New Zealand Lottery Health Research (3702828), Auckland UniServices Ltd. (5000293), the Maurice and Phyllis Paykel Trust (3708721), and the New Zealand Optometric Vision Research Foundation (3717092). C.R.G. acknowledges Professorial support from Wendy and Bruce Hadden. I.D.R. Directorship is supported by the Buchanan Charitable Foundation. M.N.M.N. held a PhD scholarship from Ministry of Higher Education Malaysia.
We thank Mrs. Satya Amirapu and Dr. Shiva Reddy for their contribution to the histological analyses of the pancreas.
Compliance with Ethical Standards
All experimental procedures were approved by the University of Auckland Animal Ethics Committee, approval no. 001462 and comply with the Association for Research in Vision and Ophthalmology (ARVO) statement for the use of animals in eye research.
Footnotes
Publisher’s Note
Springer Nature remains neutral with regard to jurisdictional claims in published maps and institutional affiliations.
References
- 1.Sarrouilhe D, Dejean C, Mesnil M. Involvement of gap junction channels in the pathophysiology of migraine with aura. Front Physiol. 2014;5:78. doi: 10.3389/fphys.2014.00078. [DOI] [PMC free article] [PubMed] [Google Scholar]
- 2.Silberstein SD. Tonabersat, a novel gap-junction modulator for the prevention of migraine. Cephalalgia. 2009;29(Suppl 2):28–35. doi: 10.1111/j.1468-2982.2009.01973.x. [DOI] [PubMed] [Google Scholar]
- 3.Silberstein SD, Schoenen J, Gobel H, Diener HC, Elkind AH, Klapper JA, et al. Tonabersat, a gap-junction modulator: efficacy and safety in two randomized, placebo-controlled, dose-ranging studies of acute migraine. Cephalalgia. 2009;29(Suppl 2):17–27. doi: 10.1111/j.1468-2982.2009.01974.x. [DOI] [PubMed] [Google Scholar]
- 4.Hauge AW, Asghar MS, Schytz HW, Christensen K, Olesen J. Effects of tonabersat on migraine with aura: a randomised, double-blind, placebo-controlled crossover study. The Lancet Neurology. 2009;8:718–23. doi: 10.1016/S1474-4422(09)70135-8. [DOI] [PubMed] [Google Scholar]
- 5.Cao Y, Zheng OJ. Tonabersat for migraine prophylaxis: a systematic review. Pain physician. 2014;17:1–8. [PubMed] [Google Scholar]
- 6.Dodick DW. Tonabersat for migraine prevention: new life or last gasp? The Lancet Neurology. 2009;8:693–5. doi: 10.1016/S1474-4422(09)70174-7. [DOI] [PubMed] [Google Scholar]
- 7.Chan WN, Evans JM, Hadley MS, Herdon HJ, Jerman JC, Parsons AA, et al. Identification of (-)-cis-6-acetyl-4S-(3-chloro-4-fluoro-benzoylamino)- 3,4-dihydro-2,2-dimethyl-2H-benzo [b]pyran-3S-ol as a potential antimigraine agent. Bioorganic & medicinal chemistry letters. 1999;9:285–90. doi: 10.1016/S0960-894X(98)00728-8. [DOI] [PubMed] [Google Scholar]
- 8.Parsons AA, Bingham S, Raval P, Read S, Thompson M, Upton N. Tonabersat (SB-220453) a novel benzopyran with anticonvulsant properties attenuates trigeminal nerve-induced neurovascular reflexes. Br J Pharmacol. 2001;132:1549–57. doi: 10.1038/sj.bjp.0703932. [DOI] [PMC free article] [PubMed] [Google Scholar]
- 9.Kim Y, Griffin JM, Nor MNM, Zhang J, Freestone PS, Danesh-Meyer HV, et al. Tonabersat Prevents Inflammatory Damage in the Central Nervous System by Blocking Connexin43 Hemichannels. Neurotherapeutics. 2017;14:1148–65. doi: 10.1007/s13311-017-0536-9. [DOI] [PMC free article] [PubMed] [Google Scholar]
- 10.Orellana JA, Saez PJ, Cortes-Campos C, Elizondo RJ, Shoji KF, Contreras-Duarte S, et al. Glucose increases intracellular free Ca(2+) in tanycytes via ATP released through connexin 43 hemichannels. Glia. 2012;60:53–68. doi: 10.1002/glia.21246. [DOI] [PMC free article] [PubMed] [Google Scholar]
- 11.Abudara V, Roux L, Dallerac G, Matias I, Dulong J, Mothet JP, et al. Activated microglia impairs neuroglial interaction by opening Cx43 hemichannels in hippocampal astrocytes. Glia. 2015;63:795–811. doi: 10.1002/glia.22785. [DOI] [PubMed] [Google Scholar]
- 12.Retamal MA, Froger N, Palacios-Prado N, Ezan P, Saez PJ, Saez JC, et al. Cx43 hemichannels and gap junction channels in astrocytes are regulated oppositely by proinflammatory cytokines released from activated microglia. J Neurosci. 2007;27:13781–92. doi: 10.1523/JNEUROSCI.2042-07.2007. [DOI] [PMC free article] [PubMed] [Google Scholar]
- 13.Mugisho OO, Green CR, Kho DT, Zhang J, Graham ES, Acosta ML, et al. The inflammasome pathway is amplified and perpetuated in an autocrine manner through connexin43 hemichannel mediated ATP release. Biochim Biophys Acta Gen Subj. 1862;2018:385–93. doi: 10.1016/j.bbagen.2017.11.015. [DOI] [PubMed] [Google Scholar]
- 14.Kim Y, Griffin JM, Harris PW, Chan SH, Nicholson LF, Brimble MA, et al. Characterizing the mode of action of extracellular Connexin43 channel blocking mimetic peptides in an in vitro ischemia injury model. Biochim Biophys Acta Gen Subj. 1861;2017:68–78. doi: 10.1016/j.bbagen.2016.11.001. [DOI] [PubMed] [Google Scholar]
- 15.Chen YS, Green CR, Teague R, Perrett J, Danesh-Meyer HV, Toth I, et al. Intravitreal injection of lipoamino acid-modified connexin43 mimetic peptide enhances neuroprotection after retinal ischemia. Drug Deliv Transl Res. 2015;5:480–8. doi: 10.1007/s13346-015-0249-8. [DOI] [PubMed] [Google Scholar]
- 16.Chen YS, Green CR, Wang K, Danesh-Meyer HV, Rupenthal ID. Sustained intravitreal delivery of connexin43 mimetic peptide by poly(D,L-lactide-co-glycolide) acid micro- and nanoparticles--Closing the gap in retinal ischaemia. Eur J Pharm Biopharm. 2015;95:378–86. doi: 10.1016/j.ejpb.2014.12.005. [DOI] [PubMed] [Google Scholar]
- 17.Mat Nor N, Guo CX, Rupenthal ID, Chen YS, Green CR, Acosta ML. Sustained Connexin43 Mimetic Peptide Release From Loaded Nanoparticles Reduces Retinal and Choroidal Photodamage. Invest Ophthalmol Vis Sci. 2018;59:3682–93. doi: 10.1167/iovs.17-22829. [DOI] [PubMed] [Google Scholar]
- 18.Danesh-Meyer HV, Kerr NM, Zhang J, Eady EK, O'Carroll SJ, Nicholson LF, et al. Connexin43 mimetic peptide reduces vascular leak and retinal ganglion cell death following retinal ischaemia. Brain. 2012;135:506–20. doi: 10.1093/brain/awr338. [DOI] [PubMed] [Google Scholar]
- 19.Guo CX, Mat Nor MN, Danesh-Meyer HV, Vessey KA, Fletcher EL, O'Carroll SJ, et al. Connexin43 Mimetic Peptide Improves Retinal Function and Reduces Inflammation in a Light-Damaged Albino Rat Model. Invest Ophthalmol Vis Sci. 2016;57:3961–73. doi: 10.1167/iovs.15-16643. [DOI] [PubMed] [Google Scholar]
- 20.Mugisho OO, Green CR, Squirrell DM, Bould S, Danesh-Meyer HV, Zhang J, et al. Connexin43 hemichannel block protects against the development of diabetic retinopathy signs in a mouse model of the disease. J Mol Med (Berl). 2019;97:215–29. doi: 10.1007/s00109-018-1727-5. [DOI] [PubMed] [Google Scholar]
- 21.Huang D, Chen YS, Green CR, Rupenthal ID. Hyaluronic acid coated albumin nanoparticles for targeted peptide delivery in the treatment of retinal ischaemia. Biomaterials. 2018;168:10–23. doi: 10.1016/j.biomaterials.2018.03.034. [DOI] [PubMed] [Google Scholar]
- 22.Ormonde S, Chou CY, Goold L, Petsoglou C, Al-Taie R, Sherwin T, et al. Regulation of connexin43 gap junction protein triggers vascular recovery and healing in human ocular persistent epithelial defect wounds. J Membr Biol. 2012;245:381–8. doi: 10.1007/s00232-012-9460-4. [DOI] [PubMed] [Google Scholar]
- 23.Danesh-Meyer HV, Zhang J, Acosta ML, Rupenthal ID, Green CR. Connexin43 in retinal injury and disease. Prog Retin Eye Res. 2016;51:41–68. doi: 10.1016/j.preteyeres.2015.09.004. [DOI] [PubMed] [Google Scholar]
- 24.Mugisho OO, Green CR, Zhang J, Acosta ML, Rupenthal ID. Connexin43 hemichannels: A potential drug target for the treatment of diabetic retinopathy. Drug Discov Today. 2019. [DOI] [PubMed]
- 25.Guo CX, Tran H, Green CR, Danesh-Meyer HV, Acosta ML. Gap junction proteins in the light-damaged albino rat. Mol Vis. 2014;20:670–82. [PMC free article] [PubMed] [Google Scholar]
- 26.Marc RE, Jones BW, Watt CB, Vazquez-Chona F, Vaughan DK, Organisciak DT. Extreme retinal remodeling triggered by light damage: implications for age related macular degeneration. Mol Vis. 2008;14:782–806. [PMC free article] [PubMed] [Google Scholar]
- 27.Noell WK, Walker VS, Kang BS, Berman S. Retinal damage by light in rats. Invest Ophthalmol. 1966;5:450–73. [PubMed] [Google Scholar]
- 28.Marneros AG. VEGF-A and the NLRP3 Inflammasome in Age-Related Macular Degeneration. Adv Exp Med Biol. 2016;854:79–85. doi: 10.1007/978-3-319-17121-0_12. [DOI] [PubMed] [Google Scholar]
- 29.Chen H, Zhang X, Liao N, Mi L, Peng Y, Liu B, et al. Enhanced Expression of NLRP3 Inflammasome-Related Inflammation in Diabetic Retinopathy. Invest Ophthalmol Vis Sci. 2018;59:978–85. doi: 10.1167/iovs.17-22816. [DOI] [PubMed] [Google Scholar]
- 30.Dahlof CG, Hauge AW, Olesen J. Efficacy and safety of tonabersat, a gap-junction modulator, in the acute treatment of migraine: a double-blind, parallel-group, randomized study. Cephalalgia. 2009;29(Suppl 2):7–16. doi: 10.1111/j.1468-2982.2009.01975.x. [DOI] [PubMed] [Google Scholar]
- 31.Goadsby PJ, Ferrari MD, Csanyi A, Olesen J, Mills JG, Tonabersat TONSG. Randomized, double-blind, placebo-controlled, proof-of-concept study of the cortical spreading depression inhibiting agent tonabersat in migraine prophylaxis. Cephalalgia. 2009;29:742–50. doi: 10.1111/j.1468-2982.2008.01804.x. [DOI] [PubMed] [Google Scholar]
- 32.Lee JJ, Yi HY, Yang JW, Shin JS, Kwon JH, Kim CW. Characterization of streptozotocin-induced diabetic rats and pharmacodynamics of insulin formulations. Biosci Biotechnol Biochem. 2003;67:2396–401. doi: 10.1271/bbb.67.2396. [DOI] [PubMed] [Google Scholar]
- 33.Cai S, Yang Q, Hou M, Han Q, Zhang H, Wang J, et al. Alpha-Melanocyte-Stimulating Hormone Protects Early Diabetic Retina from Blood-Retinal Barrier Breakdown and Vascular Leakage via MC4R. Cell Physiol Biochem. 2018;45:505–22. doi: 10.1159/000487029. [DOI] [PubMed] [Google Scholar]
- 34.Vessey KA, Wilkinson-Berka JL, Fletcher EL. Characterization of retinal function and glial cell response in a mouse model of oxygen-induced retinopathy. J Comp Neurol. 2011;519:506–27. doi: 10.1002/cne.22530. [DOI] [PubMed] [Google Scholar]
- 35.Weymouth AE, Vingrys AJ. Rodent electroretinography: methods for extraction and interpretation of rod and cone responses. Prog Retin Eye Res. 2008;27:1–44. doi: 10.1016/j.preteyeres.2007.09.003. [DOI] [PubMed] [Google Scholar]
- 36.Heiduschka P, Schraermeyer U. Comparison of visual function in pigmented and albino rats by electroretinography and visual evoked potentials. Graefes Arch Clin Exp Ophthalmol. 2008;246:1559–73. doi: 10.1007/s00417-008-0895-3. [DOI] [PubMed] [Google Scholar]
- 37.Patsalos PN. Antiepileptic drugs currently under development. In: Valentín A, Alarcón G, editors. Introduction to Epilepsy. Cambridge: Cambridge University Press; 2012. pp. 396–400. [Google Scholar]
- 38.Bialer M, Johannessen SI, Levy RH, Perucca E, Tomson T, White HS. Progress report on new antiepileptic drugs: a summary of the Ninth Eilat Conference (EILAT IX) Epilepsy Res. 2009;83:1–43. doi: 10.1016/j.eplepsyres.2008.09.005. [DOI] [PubMed] [Google Scholar]
- 39.Brandstetter C, Mohr LK, Latz E, Holz FG, Krohne TU. Light induces NLRP3 inflammasome activation in retinal pigment epithelial cells via lipofuscin-mediated photooxidative damage. J Mol Med (Berl) 2015;93:905–16. doi: 10.1007/s00109-015-1275-1. [DOI] [PMC free article] [PubMed] [Google Scholar]
- 40.O’Carroll SJ, Alkadhi M, Nicholson LF, Green CR. Connexin 43 mimetic peptides reduce swelling, astrogliosis, and neuronal cell death after spinal cord injury. Cell Commun Adhes. 2008;15:27–42. doi: 10.1080/15419060802014164. [DOI] [PubMed] [Google Scholar]
- 41.Theriault E, Frankenstein UN, Hertzberg EL, Nagy JI. Connexin43 and astrocytic gap junctions in the rat spinal cord after acute compression injury. The Journal of comparative neurology. 1997;382:199–214. doi: 10.1002/(SICI)1096-9861(19970602)382:2<199::AID-CNE5>3.0.CO;2-Z. [DOI] [PubMed] [Google Scholar]
- 42.Mao Y, Tonkin RS, Nguyen T, O'Carroll SJ, Nicholson LF, Green CR, et al. Systemic Administration of Connexin43 Mimetic Peptide Improves Functional Recovery after Traumatic Spinal Cord Injury in Adult Rats. J Neurotrauma. 2017;34:707–19. doi: 10.1089/neu.2016.4625. [DOI] [PubMed] [Google Scholar]
- 43.Tonkin RS, Mao Y, O’Carroll SJ, Nicholson LFB, Green CR, Gorrie CA, et al. Gap junction proteins and their role in spinal cord injury. Frontiers in Molecular Neuroscience. 2014;7:102. doi: 10.3389/fnmol.2014.00102. [DOI] [PMC free article] [PubMed] [Google Scholar]
- 44.Maatouk L, Yi C, Carrillo-de Sauvage MA, Compagnion AC, Hunot S, Ezan P, et al. Glucocorticoid receptor in astrocytes regulates midbrain dopamine neurodegeneration through connexin hemichannel activity. Cell Death Differ. 2019;26:580–96. doi: 10.1038/s41418-018-0150-3. [DOI] [PMC free article] [PubMed] [Google Scholar]
- 45.Yi C, Mei X, Ezan P, Mato S, Matias I, Giaume C, et al. Astroglial connexin43 contributes to neuronal suffering in a mouse model of Alzheimer's disease. Cell Death Differ. 2016;23:1691–701. doi: 10.1038/cdd.2016.63. [DOI] [PMC free article] [PubMed] [Google Scholar]
- 46.Davidson JO, Green CR, Nicholson LF, O'Carroll SJ, Fraser M, Bennet L, et al. Connexin hemichannel blockade improves outcomes in a model of fetal ischemia. Ann Neurol. 2012;71:121–32. doi: 10.1002/ana.22654. [DOI] [PubMed] [Google Scholar]
- 47.Zhou KQ, Green CR, Bennet L, Gunn AJ, Davidson JO. The Role of Connexin and Pannexin Channels in Perinatal Brain Injury and Inflammation. Front Physiol. 2019;10:141. doi: 10.3389/fphys.2019.00141. [DOI] [PMC free article] [PubMed] [Google Scholar]
- 48.Mallard C, Davidson JO, Tan S, Green CR, Bennet L, Robertson NJ, et al. Astrocytes and microglia in acute cerebral injury underlying cerebral palsy associated with preterm birth. Pediatr Res. 2014;75:234–40. doi: 10.1038/pr.2013.188. [DOI] [PubMed] [Google Scholar]
- 49.Cea LA, Bevilacqua JA, Arriagada C, Cardenas AM, Bigot A, Mouly V, et al. The absence of dysferlin induces the expression of functional connexin-based hemichannels in human myotubes. BMC Cell Biol. 2016;17(Suppl 1):15. doi: 10.1186/s12860-016-0096-6. [DOI] [PMC free article] [PubMed] [Google Scholar]
- 50.Cea LA, Puebla C, Cisterna BA, Escamilla R, Vargas AA, Frank M, et al. Fast skeletal myofibers of mdx mouse, model of Duchenne muscular dystrophy, express connexin hemichannels that lead to apoptosis. Cell Mol Life Sci. 2016;73:2583–99. doi: 10.1007/s00018-016-2132-2. [DOI] [PMC free article] [PubMed] [Google Scholar]
- 51.Takeuchi H, Mizoguchi H, Doi Y, Jin S, Noda M, Liang J, et al. Blockade of gap junction hemichannel suppresses disease progression in mouse models of amyotrophic lateral sclerosis and Alzheimer’s disease. PLoS One. 2011;6:e21108. doi: 10.1371/journal.pone.0021108. [DOI] [PMC free article] [PubMed] [Google Scholar]
- 52.Takeuchi H, Suzumura A. Gap junctions and hemichannels composed of connexins: potential therapeutic targets for neurodegenerative diseases. Front Cell Neurosci. 2014;8:189. doi: 10.3389/fncel.2014.00189. [DOI] [PMC free article] [PubMed] [Google Scholar]
- 53.Mylvaganam S, Ramani M, Krawczyk M, Carlen PL. Roles of gap junctions, connexins, and pannexins in epilepsy. Front Physiol. 2014;5:172. doi: 10.3389/fphys.2014.00172. [DOI] [PMC free article] [PubMed] [Google Scholar]
- 54.Tonkin RS, Bowles C, Perera CJ, Keating BA, Makker PGS, Duffy SS, et al. Attenuation of mechanical pain hypersensitivity by treatment with Peptide5, a connexin-43 mimetic peptide, involves inhibition of NLRP3 inflammasome in nerve-injured mice. Exp Neurol. 2018;300:1–12. doi: 10.1016/j.expneurol.2017.10.016. [DOI] [PubMed] [Google Scholar]
- 55.Mugisho OO, Rupenthal ID, Squirrell DM, Bould SJ, Danesh-Meyer HV, Zhang J, et al. Intravitreal pro-inflammatory cytokines in non-obese diabetic mice: Modelling signs of diabetic retinopathy. PLoS One. 2018;13:e0202156. doi: 10.1371/journal.pone.0202156. [DOI] [PMC free article] [PubMed] [Google Scholar]
- 56.Leybaert L, Lampe PD, Dhein S, Kwak BR, Ferdinandy P, Beyer EC, et al. Connexins in Cardiovascular and Neurovascular Health and Disease: Pharmacological Implications. Pharmacol Rev. 2017;69:396–478. doi: 10.1124/pr.115.012062. [DOI] [PMC free article] [PubMed] [Google Scholar]
Associated Data
This section collects any data citations, data availability statements, or supplementary materials included in this article.
Supplementary Materials
(DOCX 17 kb)
(PNG 5154 kb)


