

Abstract
Objective:
The ε4 allele of the APOE gene (APOE4) is the strongest genetic risk factor for Alzheimer’s disease when compared to the common ε3 allele. Although there has been significant progress in understanding how apolipoprotein E4 (apoE4) drives amyloid pathology, its effects on amyloid-independent pathways, in particular cerebrovascular integrity and function, are less clear.
Approach and Results:
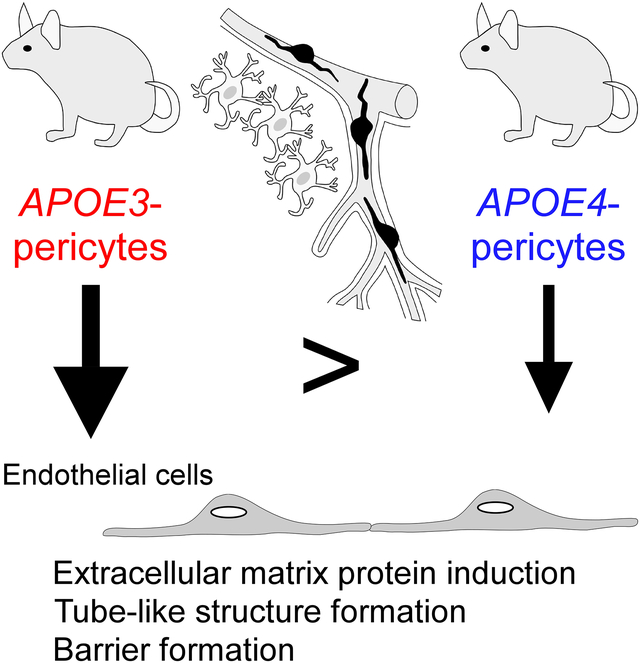
Here we show that brain pericytes, the mural cells of the capillary walls, differentially modulate endothelial cell phenotype in an apoE isoform-dependent manner. Extracellular matrix protein induction, tube-like structure formation, and barrier formation were lower with endothelial cells co-cultured with pericytes isolated from apoE4-targeted replacement (apoE4-TR) mice compared to those from apoE3-TR mice. Importantly, aged apoE4-TR mice had decreased extracellular matrix protein expression and increased plasma protein leakages compared to apoE3-TR mice.
Conclusions:
ApoE4 impairs pericyte-mediated basement membrane formation, potentially contributing to the cerebrovascular effects of apoE4.
Keywords: Alzheimer’s disease, blood-brain barrier, collagen IV, extracellular matrix, tight junction
Subject codes: vascular biology, functional genomics, blood-brain barrier, cognitive impairment
Graphical Abstract
Introduction
Alzheimer’s disease (AD) is the most common cause of dementia in the elderly, which is estimated to affect more than 40 million people worldwide in 20201. While both environmental and genetic factors contribute to the development of late-onset AD, the ε4 allele of the APOE gene (APOE4) is the strongest and most validated genetic risk factor for the disease. APOE4 is also associated with aging-related cognitive decline in non-demented individuals2, 3. The allele frequency of APOE4 dramatically increases to 40–65% in patients with AD, while it is around 10–14% in the general population4–6. The odds ratio of developing AD for carriers with one APOE4 allele is more than 3.5 when compared to individuals with an APOE ε3/ε3 genotype (AlzGene Meta-analysis of all published AD association studies, accessed June 5, 2019). Importantly, APOE4 is also associated with aging-related cognitive decline in non-demented individuals7. As such, in light of the prevalence and risk-determining effect, better understanding of APOE4-related pathophysiology will aid the development of novel therapeutic strategies for age-related cognitive decline as well as AD2, 8.
While the major function of apolipoprotein E (apoE) encoded by the APOE gene is to transport cholesterol and other lipids in the brain, apoE also modulates multiple pathways under physiological and pathological conditions2, 3, 9. Increasing human and animal studies have revealed that apoE4 not only alters the metabolism and aggregation of amyloid-β (Aβ), a key pathogenic driver of AD, but also modulates Aβ-independent pathways that include synaptic plasticity, neuroinflammation, and cerebrovascular functions2, 3, 8, 10. Of note, apoE is synthesized by different cell types and likely has differential lipidation profiles and functions depending upon the origin of the cells11. Thus, the APOE4-driven phenotype could be mediated by synergistic responses, including both direct effects caused by apoE4 expression in specific cell types (cell autonomous) and subsequent or downstream effects induced in the reactive cells (non-cell autonomous). Among diverse brain cell populations, vascular mural cells (i.e. vascular smooth muscle cells and pericytes) have been identified as a major cell type that expresses abundant apoE under physiological conditions12–14. Pericytes, the mural cells in brain microvessels, have recently emerged as critical regulators of vascular morphogenesis, cerebrovascular homeostasis, and the function of neurovascular units15–17. Consequently, pericyte dysfunction alters cerebrovascular homeostasis, which could ultimately affect neuronal health contributing to neurodegeneration15, 18.
Despite the increasing recognition of cerebrovascular effects of apoE4 both in the presence19 and absence20–25 of Aβ pathology, how apoE4 in specific vascular cell types impacts vascular function as well as the underlying mechanism are not clear. Although astrocytic apoE4 may cause a disruption in blood-brain barrier (BBB) integrity21, 25, it is likely that apoE4 expressed in vascular mural cells, the integral components of the vasculature, also contributes to cerebrovascular dysfunction. Therefore, we sought to determine whether pericytes with different apoE isoforms differentially modulate endothelial cell functions. Towards this, we isolated primary pericytes from apoE-targeted replacement (TR) mice26 and defined apoE isoform-dependent effects on endothelial cell markers and functions. We also examined endothelia-related effects in vivo by analyzing the expression of extracellular matrix (ECM) proteins and BBB integrity. Our results collectively support a critical role of brain pericytes in modulating endothelial cell phenotypes in an apoE isoform-dependent manner.
Material and Methods
Animals
ApoE-TR mice expressing human APOE3 or APOE4 under the control of the mouse apoE promoter on a pure C57BL/6 background26 and Apoe-KO mice on a C57BL/6 background were purchased from Taconic (Hudson, NY). All animals were housed in a specific pathogen-free environment in ventilated cages, and used for experiments according to the standards established by the Mayo Clinic Institutional Animal Care and Use Committee. Both female and male mice were used for the experiments.
Primary Cultures of Mouse Endothelial Cells and Pericytes
Mouse brain endothelial cells and pericytes were isolated from the brains of 4-week-old apoE-TR or Apoe-KO mice by enzymatic digestions as described25, 27. The gray matter from 8 brains (male/female ratio = 1) were excised and minced in ice-cold Dulbecco’s modified Eagle’s medium (DMEM) (Cat. #11965092, Gibco), and incubated for 75 min in 10 ml of DMEM containing 100 mg of collagenase type II (Cat. #LS004176, Worthington Biochemical Corp) and 150 μg of DNase I (Cat. #04716728001, Roche) at 37°C. After centrifugation at 1,000 g for 20 min, the pellets containing microvessels were washed once with DMEM and further digested in 10 ml of DMEM containing 100 μg of collagenase and dispase (Cat. #10269638001, Roche) for 60 min at 37°C. The digest was centrifuged at 1,000 g for 20 min to obtain pellets, and the pellets were further centrifuged in 22% BSA solution (Cat. #A7034–100ML, Sigma-Aldrich) to remove myelin from the microvessel-endothelial cell clusters. The clusters were plated in 6-well plates coated with rat collagen I (Cat. #A1048301, Gibco). To minimize technical variations during isolation procedures, we plated the microvessel-endothelial cell clusters obtained from 4 mouse brains into 1 well of 6-well plates for either endothelial cells or pericytes cultures. To obtain endothelial cell culture, the cells were maintained at 37°C for 2 days in DMEM/F12 (Cat. #11320033, Gibco) supplemented with mBEC medium I containing 10% FBS, basic fibroblast growth factor (1.5 ng/ml; Cat. #PMG0031, Gibco), heparin (100 μg/ml; Cat. #H3149–100KU, Sigma-Aldrich), insulin (5 μg/ml; Cat. #I1884–1VL, Sigma-Aldrich), transferrin (5 μg/ml; Cat. #I1884–1VL Sigma-Aldrich), sodium selenite (5 ng/ml; Cat. #I1884–1VL Sigma-Aldrich), penicillin, streptomycin (Cat. #15140122, Gibco), and puromycin (4 μg/ml; Cat. #P8833, Sigma-Aldrich). On the third day of culture, the medium was replaced with a new medium that contained all of the components of mBEC medium I except puromycin (mBEC medium II). Pure cultures of pericytes were obtained by passaging the cells from the microvessel clusters after enzymatic digestions omitting the puromycin treatment. During the first two passages, the cells were kept in mBEC medium II; following the third passage, cells were maintained in pericyte medium (Cat. #1201, ScienCell Research Laboratories) containing 2% FBS. The cells were passaged at approximately 90% confluence and culture medium was changed every 3 days. Endothelial cells with the passage number 1–2 (P1–2) and pericytes with the passage number 4–5 (P4–5) were used for experiments.
Primary Cultures of Mouse Primary Astrocytes
Mouse brain astrocytes were isolated from apoE-TR or Apoe-KO pups (postnatal day 1–3, males and females) as described27, 28. In brief, the cortex was excised and the meninges were carefully removed by fine forceps under a stereomicroscope (Zeiss SteREO Discovery. V8). The cortex pieces were then cut into small pieces using a sharp scalpel and transferred into one 50 ml Falcon tube, and incubated in the water bath at 37°C for 30 min in 22.5 ml of HBSS (Cat. #14025092, Gibco) containing 2.5 ml of 2.5% trypsin (Cat. #15090046, Gibco). The pellets were collected by centrifuge for 5 min at 300 g and plated into one T75 flask (Cat. #25–209, Genesee Scientific) coated with 20 ml of poly-D-lysine (Cat. #A-003-E, Millipore) at a concentration of 50 μg/ml. To minimize technical variations during the isolation procedures, we plated the pellets obtained from 4 mouse brains into one T75 flask. After 10 days of incubation, the flasks were shaken for 6 hours, and the remaining astrocyte monolayers were re-plated into two T75 culture flasks. The astrocyte-rich cultures were maintained in astrocyte culture media (DMEM, high glucose (Cat. #11965092, Gibco), 10% FBS and 1% penicillin, streptomycin (Cat. #15140122, Gibco)). Cells with the passage number 2–3 (P2–3) were used for experiments.
Culture of Human Umbilical Vein Endothelial Cells
Human Umbilical Vein Endothelial Cells (HUVECs) were purchased from Lonza (Cat. #C2517A) and had an APOE ε3/ε3 genotype. Cells with passage number 2–4 (P2–4) were used for experiments. HUVECs were cultured in endothelial growth medium (EGM-2, Cat. #CC-3162, Lonza) according to the manufacturer’s instructions. Medium was changed every other day until cells reached 90% confluency, at which point they were used for experiments.
ApoE Immunoprecipitation
ApoE immunoprecipitation was performed as described14. In brief, concentrated conditioned media was incubated with avidin-agarose beads (Cat. #29200, Thermo Scientific) precoupled with biotinylated polyclonal anti-apoE antibody (2 μg of antibody for 20 ul of 50% slurry of agarose resins, Cat. #K74180B, Meridian Life Science) overnight at 4°C. Bead-antibody-apoE complexes were washed with TBS three times, and apoE-associated cholesterol was eluted with 0.1% Triton X-100 in TBS. Immunoprecipitated apoE was eluted with 0.1 M glycine (pH 2.5) and neutralized with 1 M Tris (pH 8.5).
ApoE ELISA
ApoE ELISA was performed as described14. A 96-well plate (Cat. #12-565-135, Thermo Scientific) was coated overnight with WUE4 antibody (1 μg/ml, in-house, also available from Novus Biologicals, Cat. #NB110–60531)29. After blocking in 1% nonfat milk in phosphate-buffered saline (PBS), samples were applied at the appropriate dilution and incubated with detection antibody (200 ng/ml, Cat. #K74180B, Meridian Life Science), followed by incubation with streptavidin-poly-horseradish peroxidase (HRP) tertiary antibody (1 μg/ml, Cat. #85R-200, Fitzgerald). 3,30,5,50-tetramethylbenzidine substrate (Cat. #T5569, Sigma-Aldrich) was then applied to each well, and the substrate-peroxidase reaction was stopped with sulfuric acid stop solution. The absorbance was read at 450 nm using a BioTek 600 plate reader. ApoE concentration of each sample was calculated against a standard curve derived from serial dilutions of recombinant human apoE3 or apoE4 protein purchased from Fitzgerald (Cat. #30R-AA016, 30R-2382).
Cholesterol Assay
Cholesterol levels were analyzed using the Amplex Red cholesterol assay kit (Cat. #A12216, Invitrogen) according to the instructions of the manufacturer. Briefly, samples were pipetted into an opaque 96-well plate with a transparent bottom and lid. Standards and samples were incubated with Amplex Red reagent (300 μM Amplex Red, 2 units/ml HRP, 2 units/ml cholesterol oxidase, and 0.2 units/ml cholesterol esterase) at 37°C for 30 min, and fluorescence signal was measured using excitation in the range of 530–560 nm and emission detection at 590 nm.
RNA-Sequencing, Quality Control and Normalization
Primary pericytes in culture were treated with TRIzol RNA Isolation Reagents (Thermo Fisher Scientific, Cat. #15596026), and total RNAs were subsequently extracted from samples using DNase (QIAGEN, Cat. #79254) and an RNeasy mini kit (QIAGEN, Cat. #74104). Additionally, the RNA integrity number (RIN) of total RNAs was measured with a 2100 Bioanalyzer (Agilent Technologies) using an RNA 6000 nano kit (Agilent Technologies, Cat. #5067–1511). Total RNAs were sequenced with Illumina HiSeq 2000 at the Mayo Clinic Genome Facility. Reads were mapped to the mouse genome mm10. Raw gene read counts, along with sequencing quality control, were generated using the Mayo Clinic RNA-sequencing analytic pipeline, MAP-RSeq Version 2.0.030. In order to correct for GC bias and gene length differences and obtain similar quantile-by-quantile distributions of gene expression levels across samples, we performed conditional quantile normalization (CQN) on the raw gene counts. According to the bimodal distribution of the CQN-normalized and log2-transformed reads per kb per million (RPKM) gene expression values, genes with average log2 RPKM of 1 or more in at least one group were considered expressed. Using this selection threshold, 14,234 genes were included in the downstream analysis.
Differential Gene Expression Analysis
Differential gene expression analyses were performed using Partek Genomics Suite (Partek Inc.). Gene expression between pericytes isolated from apoE3-TR mice (three different lines prepared from different animals) and those isolated from apoE4-TR mice (three different lines prepared from different animals) were compared using Analyses of Variance models (ANOVA). Duet to the exploratory nature of the study, differentially expressed genes (DEG) were defined by unadjusted p value < 0.05. Pathway analyses of differentially expressed genes were performed using MetaCore pathway analysis (Thomson Reuters) (Version 6.24.67895).
3-D Vasculogenesis Assay
HUVECs were cultured either alone or with pericytes in collagen type 1 matrices as described31. Briefly, 2.5 mg/mL collagen type 1 matrices containing SCF (Cat. #255-SC, R&D Systems), IL-3 (I7389, Sigma-Aldrich), SDF-1α (Cat. #350-NS, R&D Systems), and FGF-2 (Cat. #PHG0264, Gibco) at a concentration of 200ng/ml were used to suspend the cells. HUVECs were added at2 × 106 cells/ml while pericytes were added at 0.4 × 10⁶ cells/ml within the collagen matrices and mixed thoroughly. The collagen-cell-growth factor mixture was aliquoted in 28 μl in 96 well half-area plates (Cat. #07-200-735, Corning). Prior to collagen polymerization, the plates were gently tapped on all four edges to assure that the collagen gel was equally distributed throughout the well. All empty wells were filled with sterile water in order to hydrate the plates. After 30 minutes incubation at 37°C, gels were fed with 200 μl defined M199 media (Cat. #M4530, Sigma-Aldrich) including RSII, FGF-2 (Cat. #PHG0264, Gibco) at a concentration of 40 ng/ml, and ascorbic acid (Cat. #A4403, Sigma-Aldrich) at a concentration of 50 μg/ml. Day 0 was defined by cell plating day in the collagen matrices, and the medium was changed to fresh media at day 3. Main analysis was performed on day 5.
In Vitro BBB Model
The in vitro BBB model was constructed as described25, 27. Briefly, pericytes were seeded on the bottom side of the collagen I–coated polycarbonate membrane of a Transwell insert (0.4-μm pore size; Cat. #3450, #3470, Corning) at a density of 1.5×10⁴ cells/cm2. Pericytes were allowed to attach for 1 day, and endothelial cells were seeded on the upper side of the insert at a density of 1.5×10⁵ cells/cm2 on the next day. Three days before the endothelial cells were seeded onto the membrane, astrocytes were seeded (1.0×10⁵ cells/cm2) on poly-D-lysine–coated plate and maintained in astrocyte culture medium. Finally, the Transwell inserts with endothelial cells and pericytes were transferred into the 6-well (for ELISA) or 24-well plates (for evaluation of barrier integrity) containing astrocytes. The cells were refed with the endothelial cell medium (mBEC medium II, please refer to “Primary Cultures of Mouse Endothelial Cells and Pericytes” for details) in the upper chamber, with the pericyte medium (Cat. #1201, ScienCell Research Laboratories) in the lower chamber. Day 0 was defined by endothelial cells plating day on membrane, and the medium in both of the chambers was changed to fresh media at day 3. Main analysis was performed on day 5.
Evaluation of Barrier Integrity in In Vitro BBB Model
To evaluate the barrier integrity of in vitro BBB models, the transendothelial electrical resistance (TEER) was measured using an EVOM Epithelial Voltammeter (World Precision Instrument). TEER of collagen I-coated but cell-free filters was subtracted from the measured TEERs and shown as ohm × cm2.
Immunofluorescence Staining of Vascular Cells
Pericytes cultured on cover slips were fixed in 2% PFA, permeabilized with PBS containing 0.2% Triton X-100, and incubated with anti-NG2 antibody (5 μg/ml, Cat. #MAB5384, Millipore) or anti-PDGFRβ antibody (15 μg/ml, Cat. #AF1042, R&D Systems) in PBS containing 1% bovine serum albumin at 4°C overnight. To visualize pericytes, cells were incubated in Alexa Fluor 488 secondary antibody (1 μg/ml, Cat. #A-11001, A-11055, Invitrogen). In a separate set of studies, endothelial cells cultured on Transwell filters were fixed as described3. To visualize tight junction proteins, cells on Transwell filters were incubated in either of the following fluorescence-conjugated primary antibodies at 4°C overnight: anti-claudin-5 antibody (5 μg/ml, Cat. #352588, Invitrogen) or anti-occludin antibody (10 μg/ml, Cat. #331588, Invitrogen). In a separate set of studies, collagen gels containing HUVECs and pericytes were fixed in 2% PFA for four hours at room temperature, permeabilized with PBS containing 0.2% Triton X-100, and incubated with anti-CD31 antibody (1:100, Cat. #ab28364, abcam) in PBS containing 1% bovine serum albumin at 4°C for three days. To visualize HUVECs, collagen gels were incubated in Alexa Fluor 488 secondary antibody (1 μg/ml, Cat. #A-21441, Invitrogen). Subsequently, collagen gels containing HUVECs and pericytes were incubated in anti-PDGFRβ antibody (15 μg/ml, Cat. #AF1042, R&D Systems) at 4°C for three days. To visualize pericytes, sections were incubated in Alexa Fluor 568 secondary antibody (1 μg/ml, Cat. #A-11057, Invitrogen). The labeled cells were mounted in ProLong Diamond Antifade Mountant with DAPI (Cat. #P36966, Invitrogen). Negative immunostaining with appropriate IgG controls displayed no positive staining (Supplemental Figure 2).
Confocal Microscopy Analysis
Confocal images were acquired and analyzed by an investigator, who was blinded to experimental conditions of the samples.
Quantitative Analysis of Branch Length and Network Density in 3-D Vasculogenesis Assay
Four Z-stack images of immunostaining by CD31 (twenty-micron maximum projection) were captured per 3-D collagen gel. Mean branch length (average length of tubes) was measured in each of the images using the Image J plug-in, “NeuronJ” length analysis tool (http://www.imagescience.org/meijering/software/neuronj/) and the values were further averaged per 3-D collagen gel. For the calculation of network density (total length of network/area), twenty-micron maximum project z-stack images were reconstructed per gel and CD31-positive signal was subjected to threshold processing. Areas occupied by CD31-positive signals in thresholded images were analyzed using the NIH Image J Area measurement tool.
Fluorescence Intensity Analysis of Collagen IV Deposition Normalized by CD13-Positive Area
Fifteen-micron maximum projection z-stacks (420 × 420 μm field) were reconstructed, and the areas occupied by collagen IV-positive and CD13-positive (pericyte) fluorescent signals on vessels were subjected separately to threshold processing and analyzed using ImageJ. After thresholding, the signal density for each thresholded image was calculated. The pixel-based area ratios of collagen IV and CD13 fluorescent signals were used to determine the fluorescence intensity of collagen IV deposition normalized by CD13-positive area in each field. Three randomly selected fields per cortical preparation were analyzed (three preparations per mouse), and averaged per mouse.
Tight Junction Protein Coverage of Endothelial Cells
TJ protein coverage analysis in endothelial cells was conducted using NIH ImageJ software as described21, 27. In brief, 15 μm maximum projection z-stacks were reconstructed. Claudin-5- or occludin-positive immunofluorescent length per CD31-positive EC length was determined using the Image J plug-in “NeuronJ” length analysis tool. Only longitudinally sectioned microvessels > 50 μm from three randomly selected 420 × 420 μm fields per preparation were analyzed (three preparations per mouse).
CD13-Positive Pericyte Coverage of Endothelial Cells
Pericyte coverage analysis in endothelial cells was conducted using NIH ImageJ software as described with slight modifications32, 33. Fifteen-micron maximum projection z-stacks (420 × 420 μm field) were reconstructed, and the areas occupied by CD13-positive (pericyte) and CD31-positive (endothelial cell) fluorescent signals on vessels were subjected separately to threshold processing and analyzed using ImageJ. After thresholding, the integrated signal density for each thresholded image was calculated. The integrated pixel-based area ratios of CD13 and CD31 fluorescent signals were used to determine pericyte coverage as a percentage (%) of CD13-positive surface area covering CD31-positive endothelial cells. Three randomly selected fields per cortical preparation were analyzed (three preparations per mouse), and averaged per mouse.
Aquaporin 4-Positive Astrocyte End-Foot Coverage of Endothelial Cells
Astrocyte end-foot coverage analysis in endothelial cells was conducted using NIH ImageJ software as described with slight modifications32, 33. Aquaporin 4 and CD31 signals from microvessels were separately subjected to threshold processing. After thresholding, the integrated signal density for each thresholded image was calculated. The integrated pixel-based area ratios of aquaporin 4 and CD31 fluorescent signals were used to determine end-foot coverage as a percentage (%) of aquaporin 4-positive surface area covering CD31-positive endothelial cells. Three randomly selected fields per cortical preparation were analyzed (three preparations per mouse), and averaged per mouse.
RNA Isolation and Quantitative Real-time PCR Analysis
Total RNA was extracted from the cells by using RNeasy Mini kit (Cat. #74104, QIAGEN). For real-time PCR analysis, cDNA was synthesized from total RNA by SuperScript III reverse transcriptase (Cat. #18080044, Invitrogen). Reactions were prepared using a 25-μl mixture containing Platinum SYBR Green qPCR Super Mix-UDG (Cat. #11733046, Invitrogen). Real-time quantification was performed on iCycler iQ system (Bio-Rad).
The primers used for human gene expressions were as follows: COL4A1 forward: 5’-CCGCTGCGAAGGGTGG-3’, COL4A1 reverse: 5’-CCTCAGGTCCTTGCATTCCA-3’, COL4A2 forward: 5’-GGATGGCTATCAAGGGCCTG-3’, COL4A2 reverse: 5’-CTGGCACCTTTTGCTAGGGA-3’, NID1 forward: 5’-ATAACACGGATTCCCGCCAG-3’, NID1 reverse: 5’-GGGGAACCTTCTGCAACACA-3’, NID2 forward: 5’-CGGAAATGGATGTTCCCCCA-3’, NID2 reverse: 5’-GTGAAGACCTCGGTGTTGGA-3’, FN1 forward: 5’-CTGAAAGACCAGCAGAGGCA-3’, FN1 reverse: 5’-GTGTAGGGGTCAAAGCACGA-3’, HSPG forward: 5’-CGTCCCACAACGAGCAGG-3’, HSPG reverse: 5’-CACGCTGGTGATGCCAAAG-3’, GAPDH forward: 5’-TCCAAAATCAAGTGGGGCGA-3’, GAPDH reverse: 5’-AAATGAGCCCCAGCCTTCTC-3’.
Mouse Tissue Harvest and Sample Preparation
For brain tissue preparation, mice were transcardially perfused with 20 ml of PBS at 2 ml/min. The brain was either embedded in O.C.T. compound (Cat. #4583, Sakura) followed by snap-frozen for cryostat sectioning, or dissected into different regions (cortex, hippocampus brainstem and cerebellum) and stored at −80°C for biochemical analysis.
For biochemical analysis, tissues were homogenized by Polytron homogenizer (Cat. #PT1200E, Kinematica) at a ratio of 20ml/g wet-weight brain in ice-cold radioimmunoprecipitation assay (RIPA) lysis buffer (Cat. #20–188, Millipore) plus 0.1% sodium dodecyl sulfate, complete protease inhibitors (Cat. #11836170001, Roche), and PhosSTOP phosphatase inhibitors (Cat. #4906845001, Roche). After centrifugation at 100,000 g for 1 hour at 4°C, the supernatant was collected and used for biochemical analysis. Similarly, proteins were extracted from the cells by adding RIPA lysis buffer plus complete protease inhibitors, and PhosSTOP phosphatase inhibitors.
Quantification of Tight Junction Protein Cell Border Staining
Claudin-5 and occludin cell border staining pattern was quantified using a semi-quantitative score ranking system on a scale of 1 to 5 as previously described34. In brief, a 5 by 5 grid was applied to the images and a score was assigned for each square of the grid using the criteria as follows; Grade 1, 0–24% continuous border staining; Grade 2, 25–49% continuous border staining; Grade 3, 50–74% continuous border staining; Grade 4, 75–99% continuous border staining; Grade 5, completely continuous border staining. The frequency of each ranking score was calculated using images that represent four independent biological replicates, and distributional differences of the scores between 2 groups were evaluated using χ2 test.
Immunofluorescence Staining of Brain Tissues
Fresh frozen coronal sections of 40 μm thickness were obtained by use of a cryostat. Acetone/ethanol-fixed frozen sections were blocked with 2.5% normal horse serum (Cat. #S-2012, Vector Laboratories). To visualize tight junction proteins, sections were incubated in either of the following fluorescence-conjugated primary antibodies at 4°C overnight: anti-claudin-5 antibody (5 μg/ml, Cat. #352588, Invitrogen) or anti-occludin antibody (10 μg/ml, Cat. #331588, Invitrogen). Subsequently, sections were incubated in anti-CD31 antibody (15.625 μg/ml, Cat. #550274, BD Biosciences) at 4°C overnight. To visualize endothelial cells, sections were incubated in Alexa Fluor 568 secondary antibody (1 μg/ml, Cat. #A-11077, Invitrogen). In a separate set of studies, acetone/ethanol-fixed frozen sections were blocked with 2.5% normal horse serum. Sections were then incubated in either of the following primary antibodies at 4°C overnight: anti-CD13 antibody (10 μg/ml, Cat. #558744, BD Biosciences) or anti-aquaporin 4 antibody (10 μg/ml, Cat. #AB2218, Millipore). To visualize pericytes and astrocytic end-feet, sections were incubated in Alexa Fluor 488 secondary antibody (1 μg/ml, Cat. #A-11006, A-11008, Invitrogen). Subsequently, sections were incubated in biotinylated anti-CD31 antibody (15.625 μg/ml, Cat. #550274, BD Biosciences) at 4°C overnight. Biotin Labeling Kit-NH2 (LK03–10, Dojindo Molecular Technologies) was used for anti-CD31 antibody biotinylation. To visualize endothelial cells, sections were incubated in Alexa Fluor 568 streptavidin antibody (1 μg/ml, Cat. #S11226, Invitrogen). In a separate set of studies, acetone/ethanol-fixed frozen sections were blocked with 2.5% normal horse serum. Sections were then incubated in anti-collagen type IV antibody (10 μg/ml, Cat. #AB756P, Millipore) at 4°C overnight. to visualize basement membranes, sections were incubated in Alexa Fluor 488 secondary antibody (1 μg/ml, Cat. #A-11008, Invitrogen). Subsequently, sections were incubated in anti-CD13 antibody (10 μg/ml, Cat. #558744, BD Biosciences) at 4°C overnight. To visualize endothelial cells, sections were incubated in Alexa Fluor 568 secondary antibody (1 μg/ml, Cat. #A-11006, Invitrogen). Negative immunostaining with appropriate IgG controls displayed no positive staining (Supplemental Figure 2).
ELISAs for Vascular-related Molecules
Levels of collagen IV, fibrinogen and IgG in mouse tissue and cell lysates were determined by commercial ELISA kits according to the manufacturer’s instructions (collagen IV, Cat. #LS-F20750–1, LSBio; fibrinogen, Cat. #ab213478, abcam; IgG; Cat. #50-246-290, Fisher Scientific). Levels of claudin-5 and occludin were determined as described35, 36. In brief, claudin-5 levels were determined by ELISAs using a mouse monoclonal capture antibody (500 ng/ml, Cat. #352500, Invitrogen) and a rabbit monoclonal detection antibody (80 ng/ml, Cat. #ab131259, abcam). Colorimetric quantification was performed on a Synergy HT plate reader (BioTek) using HRP-conjugated antibody (50 ng/ml, Cat. #ab97080, abcam) and 3,30,5,50-tetramethylbenzidine substrate (Cat. #T5569, Sigma-Aldrich). Occludin levels were determined by ELISAs using a rabbit polyclonal capture antibody (1 μg/ml, Cat. #ab31721, abcam) and HRP-conjugated mouse monoclonal antibody (500 ng/ml, Cat. #331520, Invitrogen). Colorimetric quantification was performed on a Synergy HT plate reader (BioTek) using 3,30,5,50-tetramethylbenzidine substrate (Cat. #T5569, Sigma-Aldrich). As there were no available recombinant protein standards for mouse claudin-5 and ocludin, readout in each sample was expressed in relative antibody units (RU); RU was calculated from a standard curve using recombinant human claudin-5 and occludin proteins (Cat. #H00007122-P01, H00004950-P01, Novus Biologicals), which are highly homologous to mouse claudin-5 and occludin proteins, respectively.
Statistical Analysis
Data is presented as mean ± s.e.m. Statistical analysis was carried out using two-tailed t test, one-way ANOVA or two-way ANOVA as appropriate. Normal distribution of all data was evaluated by Shapiro-Wilk normality test. The assumption that the data were sampled from Gaussian populations with equal variances was evaluated by Bartlett’s test for one-way ANOVA and F test for unpaired Student t test. On passing both tests, the data was analyzed by one-way ANOVA with Tukey post hoc tests (3 groups) or by two-tailed unpaired Student t test (2 groups). Nonparametric datasets were analyzed by Kruskal-Wallis one-way ANOVA test (3 groups) or by Mann-Whitney U test (2 groups). Distributional differences of readouts between 2 groups were evaluated using χ2 test. In vivo experiments using both male and female apoE3-TR and apoE4-TR mice were analyzed by Two-way ANOVA followed by Tukey-Kramer tests. Correlation analysis in vivo was carried out using nonparametric Spearman correlation test. The types of tests used are indicated in the figure legends. P values <0.05 were considered significant.
Results
Characterization of primary brain pericytes isolated from apoE3- and apoE4-TR mice
To define how apoE isoforms modulate the function of pericytes, we isolated primary brain perivascular cells from apoE3- and apoE4-TR mice. After the dissociation from microvessels, they showed typical rhomboid morphology with elongated processes, reminiscent of pericytes. In addition, the expression of pericyte markers, neural/glial antigen 2 (NG2) and platelet-derived growth factor receptor-β (PDGFRβ), was confirmed by immunostaining (Figure 1A).
Figure 1. Primary pericytes from apoE-TR mice abundantly secrete lipidated apoE.

A, Representative images of pericytes stained for NG2 (left) and PDGFRβ (right) are shown. Nuclei were counterstained with 4’,6-diamidino-2-phenylindole (DAPI). B, The amount of apoE in the conditioned media from primary cultures of endothelial cells (EC), pericytes (PC), and astrocytes (AS) was measured by ELISA and normalized against the total protein concentrations in cell lysates. C, Conditioned media from primary cultures of PC and AS were concentrated and subjected to size-exclusion chromatography run by FPLC using a Superose-6 column. The amount of apoE in each fraction was determined by ELISA. Values of three independent experiments were averaged and plotted against fraction numbers. D, Conditioned media from primary cultures of PC and AS were concentrated and subjected to an immunoprecipitation using an apoE-specific antibody. The amount of apoE-associated cholesterol was determined by Amplex Red cholesterol assay after immunoprecipitation with anti-apoE antibody. Data in B and D are presented as mean ± s.e.m. (N=4). Each dot in B and D represents a measurement from one independent primary cell culture prepared from brains of 4 male and 4 female mice. *P<0.05, apoE3-EC vs. apoE3-PC, Mann-Whitney test (B, top panel). *P<0.05, apoE4-EC vs. apoE4-PC, Mann-Whitney test (B, bottom panel). The amount of apoE in the conditioned media from primary AS is not included in the statistical analysis (B). *P<0.05, apoE3-PC vs. apoE3-AS, Mann-Whitney test (D, top panel); *P<0.05, apoE4-PC vs. apoE4-AS, Mann-Whitney test (D, bottom panel).
To determine whether apoE is secreted by pericytes, the amount of apoE in the conditioned media from pericyte cultures was determined by ELISA and compared with those from endothelial cells and astrocytes. We found that primary pericytes from apoE-TR mice (apoE3- and apoE4-pericytes) secreted abundant apoE, corresponding to 25–30% of that produced by primary astrocytes from apoE-TR mice (Figure 1B). On the other hand, the amount of apoE in the conditioned media from endothelial cells was much lower compared to those from pericytes and astrocytes (Figure 1B). Next, the conditioned media from primary cultures of pericytes and astrocytes were subjected to size-exclusion chromatography run by FPLC using a Superose-6 column, and the distribution of apoE across fractions was analyzed. A major apoE peak was found in fractions 34–36, corresponding to molecular size of ~158 kDa, in samples from both pericytes and astrocytes, regardless of apoE isoforms, likely reflecting apoE particles with varying degree of lipidation (Figure 1C). To directly analyze the lipidation status of apoE secreted by pericytes, apoE in conditioned media was immunoprecipitated using an apoE-specific antibody; thereafter the amount of apoE-associated cholesterol was determined. We found that greater amount of cholesterol was associated with apoE derived from pericytes when compared to that from astrocytes (Figure 1D). Together, these results indicate that mouse primary pericytes, but not endothelial cells, abundantly produce lipidated apoE particles containing cholesterol.
ApoE4-pericytes are less efficient in inducing the expression of endothelial ECM proteins in co-culture systems
Although pericytes are multifunctional in the central nervous system (CNS), one of their major functions is to regulate the vascular integrity through their interaction with endothelial cells. In fact, our RNA-seq data revealed that 676 out of the total 14,234 genes were differentially expressed in primary pericytes between apoE3-TR and apoE4-TR mice. Among the 676 genes, 296 genes were upregulated in apoE4 pericytes compared to apoE3 pericytes, while 380 genes were downregulated. Of interest, the pathway analyses suggested angiogenesis as a critical pathway that differed between apoE3- and apoE4-pericytes (Supplemental Table I and Supplemental Table II). Therefore, we sought to determine how pericytes with different apoE isoforms impact endothelial cell properties. First, human umbilical vein endothelial cells (HUVECs) from a single donor with the APOE ε3/ε3 genotype were co-cultured with apoE3- or apoE4-pericytes for 5 days with or without direct contact (Figure 2A). Collagen IV, nidogen, perlecan, and fibronectin are major vascular extracellular matrix (ECM) proteins forming basement membrane31. Since the induction of basement membrane protein expression is a critical indicator of endothelial cell stability, the mRNA levels of ECM coding genes (COL4A1, COL4A2, NID1, NID2, FN1 and HSPG) in HUVECs were determined by quantitative real-time PCR (qRT-PCR). As expected31, when HUVECs were co-cultured with pericytes in direct contact conditions, the mRNA expression of ECM coding genes (COL4A1, COL4A2, NID1, NID2, FN1 and HSPG) in HUVECs were all up-regulated compared to HUVEC monoculture condition (P<0.0081, HUVEC monoculture vs. HUVECs co-cultured with apoE3-pericytes or apoE4-pericytes, Mann-Whitney test). Importantly, a contact co-culture of HUVECs with apoE3-pericytes induced higher levels of COL4A1 and COL4A2 mRNA compared with apoE4-pericytes (Figure 2B–G, left panels). In contrast, when HUVECs were co-cultured in non-contact conditions by the use of a trans-well system, COL4A2, NID1, NID2, FN1 and HSPG mRNA levels in HUVECs were suppressed in the presence of pericytes (P<0.0081, HUVEC monoculture vs. HUVECs co-cultured with apoE3-pericytes or apoE4-pericytes, Mann-Whitney test). Furthermore, there were no differences in the gene expression of ECM at the mRNA level between HUVECs co-cultured with apoE3-pericytes and those co-cultured with apoE4-pericytes (Figure 2B–G, right panels). Together, these results indicate that brain pericytes differentially induce ECMs in endothelial cells in an apoE isoform-dependent manner, which is likely mediated by their direct contact-dependent cross talk rather than solely by diffusion factors including apoE particles secreted from the pericytes.
Figure 2. ApoE isoform-dependent effects of pericytes on endothelial cell gene expression in contact and non-contact co-culture systems.

A, Left; in a contact co-culture model, HUVECs (EC) were plated with primary cultures of pericytes from apoE3-TR (apoE3-PC) or apoE4-TR (apoE4-PC) mice at a ratio of EC to PC of 5:1. Right; in a non-contact co-culture model, apoE3-PC and apoE4-PC were cultured on semipermeable filter inserts, while EC were cultured into the well of culture plate. B-G, The mRNA levels of COL4A1 (B), COL4A2 (C), NID1 (D), NID2 (E), FN1 (F) and HSPG (G) in EC were determined by qRT-PCR and compared between EC monoculture, EC co-cultured with apoE3-PC or apoE4-PC. Data in B-G are presented as mean ± s.e.m. (N=4). Each dot in B-G represents a measurement from one independent primary cell culture prepared from brains of 4 male and 4 female mice. **P<0.01, EC monoculture vs. EC co-cultured with apoE3-PC; *P<0.05, EC co-cultured with apoE3-PC vs. EC co-cultured with apoE4-PC; N.S, not significant, one-way ANOVA followed by Tukey’s multiple comparison tests (B, left panel). N.S., not significant, Kruskal-Wallis test followed by Dunn’s multiple comparison tests (B, right panel). ***P<0.001, EC monoculture vs. EC co-cultured with apoE3-PC; *P<0.05, EC co-cultured with apoE3-PC vs. EC co-cultured with apoE4-PC; N.S., not significant, one-way ANOVA followed by Tukey’s multiple comparison tests (C, left panel). ***P<0.001, EC monoculture vs. EC co-cultured with apoE3-PC; EC monoculture vs. EC co-cultured with apoE4-PC; N.S., not significant, one-way ANOVA followed by Tukey’s multiple comparison tests (C, right panel). **P<0.01, EC monoculture vs. EC co-cultured with apoE3-PC; N.S., not significant, Kruskal-Wallis test followed by Dunn’s multiple comparison tests (D, left panel). N.S., not significant, Kruskal-Wallis test followed by Dunn’s multiple comparison tests (D, right panel). **P<0.01, EC monoculture vs. EC co-cultured with apoE3-PC; N.S, not significant, Kruskal-Wallis test followed by Dunn’s multiple comparison tests (E, left panel). ****P<0.0001, EC monoculture vs. EC co-cultured with apoE3-PC; ***P<0.001, EC monoculture vs. EC co-cultured with apoE4-PC; N.S., not significant, one-way ANOVA followed by Tukey’s multiple comparison tests (E, right panel). **P<0.01, EC monoculture vs. EC co-cultured with apoE3-PC; N.S, not significant, Kruskal-Wallis test followed by Dunn’s multiple comparison tests (F, left panel). ***P<0.001, EC monoculture vs. EC co-cultured with apoE3-PC; *P<0.05, EC monoculture vs. EC co-cultured with apoE4-PC; N.S., not significant, one-way ANOVA followed by Tukey’s multiple comparison tests (F, right panel). ****P<0.0001, EC monoculture vs. EC co-cultured with apoE3-PC; **P<0.05, EC monoculture vs. EC co-cultured with apoE4-PC; N.S., not significant, one-way ANOVA followed by Tukey’s multiple comparison tests (G, left panel). **P<0.01, EC monoculture vs. EC co-cultured with apoE3-PC, EC monoculture vs. EC co-cultured with apoE4-PC; N.S., not significant, one-way ANOVA followed by Tukey’s multiple comparison tests (G, right panel).
ApoE4-pericytes have an inferior ability to stimulate endothelial tube-like structure formation in a 3-D co-culture system
To further assess the endothelial cell-pericyte interactions in a physiological manner, we employed a 3-dimentional (3-D) co-culture model composed of pericytes and endothelial cells (Figure 3). This system allows us to monitor 1) the recruitment and motility of pericytes along the endothelial abluminal surfaces, 2) increase in the length of endothelial tube-like structures mediated by pericytes recruitment, and 3) accompanying induction of vascular basement membrane matrix in endothelial cells31, 37. As shown in Figure 3A, when HUVECs were co-cultured with apoE3- or apoE4-pericytes in this model, the formation of tube-like structures was observed (Figure 3A, Supplemental Figure I). Interestingly, the visualization of endothelial cells by CD31 staining revealed that the formation of endothelial tube-like structures was significantly accelerated in the presence of apoE3-pericytes compared to apoE4-pericytes (Figure 3B). In addition, the 3-D co-cultures of HUVECs/apoE3-pericytes showed higher network density of endothelial tube-like structures (Figure 3C) and longer branching (Figure 3D) than those with apoE4-pericytes. Furthermore, in line with the results from direct contact co-culture in 2-D setting, pericyte-mediated induction of COL4A1 and COL4A2 mRNAs in endothelial cells was significantly lower in apoE4-pericytes compared to apoE3-pericytes (Figure 3E, 3F). Taken together, these results indicate that apoE isoforms in pericytes critically regulate endothelial tube-like structure formation, whereas apoE4-pericytes are inferior in supporting this process during endothelial-pericyte interactions.
Figure 3. Pericyte-mediated vasculogenesis in a 3-D co-culture system depends on apoE isoforms.

HUVECs (EC) were co-cultured with primary pericytes from apoE3-TR (apoE3-PC) or apoE4-TR (apoE4-PC) mice at a ratio of EC to pericytes of 5:1 in 3-D collagen matrices. A, Representative phase contrast images for vascular network formation after 5 days of the co-culture in 3-D matrices. Left, EC co-cultured with apoE3-PC; Right, EC co-cultured with apoE4-PC. B, Endothelial tube-like structures visualized by CD31 staining and PC visualized by PDGFRβ staining after 5 days of co-culture. Left, EC monoculture; middle, EC co-cultured with apoE3-PC; right, EC co-cultured with apoE4-PC. C, D, Endothelial network density (total endothelial length of network/area; C) and mean branch length (average length of tube-like structures; D) after 5 days of the co-culture in 3-D matrices were quantified and compared between EC monoculture, and EC co-cultured with apoE3-PC or apoE4-PC. E, The mRNA levels of COL4A1 and COL4A2 in EC after co-cultured with PC in 3-D matrices for 5 days were determined by qRT-PCR. Data in C-F are presented as mean ± s.e.m. (N=6). Each dot in C-F represents a measurement from one independent primary cell culture prepared from brains of 4 male and 4 female mice. *P<0.05, EC co-cultured with apoE3-PC vs. EC co-cultured with apoE4-PC, two-tailed Student t test. The measurements from EC monoculture are shown for reference and are not included in the statistical analysis (C). ***P<0.001, EC co-cultured with apoE3-PC vs. EC co-cultured with apoE4-PC, two-tailed Student t test. The measurements from EC monoculture are shown for reference and are not included in the statistical analysis (D). **P<0.01, EC co-cultured with apoE3-PC vs. EC co-cultured with apoE4-PC, two-tailed Student t test. The measurements from EC monoculture are shown for reference and are not included in the statistical analysis (E). **P<0.01, EC co-cultured with apoE3-PC vs. EC co-cultured with apoE4-PC, two-tailed Student t test. The measurements from EC monoculture are shown for reference and are not included in the statistical analysis (F).
ApoE isoforms in pericytes, but not in endothelial cells, affect endothelial barrier function in an in vitro BBB model
To determine how the function of endothelial cells are affected by pericytes with different apoE isoforms, we took advantage of the in vitro BBB model, where the trans-endothelial electrical resistance (TEER) measurement represents para-cellular barrier integrity of endothelial monolayer (Figure 4A)27. When the in vitro BBB models, constructed with primary endothelial cells and astrocytes from Apoe-knockout (KO) mice and pericytes from either apoE3-TR or apoE4-TR mice, were analyzed we found that TEER was significantly higher in the BBB model with apoE3-pericytes compared to that constructed with apoE4-pericytes (Figure 4B). However, when we compared the TEER measurements of in vitro BBB models which were constructed with primary endothelial cells from apoE3-TR or apoE4-TR mice, and primary pericytes and astrocytes from Apoe-KO mice, no significant difference in barrier integrities was observed between these two conditions (Figure 4C). These results suggest that endothelial apoE isoforms do not affect endothelial barrier formation under these conditions. To further explore the mechanisms, we examined the amounts of tight junction proteins (claudin-5 and occludin) and collagen IV in the endothelial cell layer by ELISA. ApoE isoforms in pericytes did not affect the amounts of claudin-5 and occludin (Figure 4D) or the formation of tight junctions (Figure 4F and 4G) in endothelial cells. However, the amount of collagen IV was significantly lower in the presence of apoE4-pericytes compared to apoE3-pericytes (Figure 4D), consistent with the results from 3-D co-culture models. On the other hand, there was no apoE isoform-dependent difference in the amounts of tight junction proteins and collagen IV in the endothelial cell layer between BBB models with apoE3-endothelial cells and those with apoE4-endothelial cells (Figure 4E). These results indicate that apoE isoforms in pericytes have significant impact on neighboring endothelial cells likely by modulating ECM proteins and barrier formation in endothelial cells.
Figure 4. Pericytic apoE isoforms differentially modulate endothelial barrier integrity in vitro.

A, Schematic representation of the triple co-culture for an in vitro BBB model. Mouse primary cultures of endothelial cells (EC) were cultured on semipermeable filter inserts and primary pericytes (PC) were plated on the bottom side of the filters, whereas primary astrocytes (AS) were cultured on the well of culture plate. Endothelial barrier integrity was evaluated by transendothelial electric resistance (TEER) measurement at 5 days after plating for co-culture. B, Using the in vitro BBB models composed of PC from apoE3-TR (apoE3-PC) or apoE4-TR mice (apoE4-PC), and EC and AS from Apoe-KO mice, TEER was measured. C, Using the in vitro BBB models composed of EC from apoE3-TR (apoE3-EC) or apoE4-TR mice (apoE4-EC), and PC and AS from Apoe-KO mice, TEER was measured. D, E, The amounts of tight junction proteins (claudin-5 and occludin) and collagen IV in EC lysates were determined by ELISA in the BBB models with apoE3-PC or apoE4-PC (D) and apoE3-EC or apoE4-EC (E). F, G, Tight junction proteins (claudin-5 and occludin) in EC layers of the in vitro BBB models composed of apoE3-PC or apoE4-PC, and EC and AS from Apoe-KO mice were visualized by immunofluorescence (F). Nuclei were counterstained with 4’,6-diamidino-2-phenylindole (DAPI). The cell border staining pattern was quantified by a semi-quantitative score system and compared (G). Grade 1, 0–24% continuous border staining; Grade 2, 25–49% continuous border staining; Grade 3, 50–74% continuous border staining; Grade 4, 75–99% continuous border staining; Grade 5, completely continuous border staining. Data in B-D are presented as mean ± s.e.m. (N=6). Each dot in B-E represents a measurement from one independent primary cell culture prepared from brains of 4 male and 4 female mice. **P<0.01, in vitro BBB models composed of apoE3-PC, and EC and AS from Apoe-KO mice vs. in vitro BBB models composed of apoE4-PC, and EC and AS from Apoe-KO mice, two-tailed Student t test (B). N.S., not significant, in vitro BBB models composed of apoE3-EC, and PC and AS from Apoe-KO mice vs. in vitro BBB models composed of apoE4-EC, and PC and AS from Apoe-KO mice, two-tailed Student t test (C). N.S., not significant, in vitro BBB models composed of apoE3-PC, and EC and AS from Apoe-KO mice vs. in vitro BBB models composed of apoE4-PC, and EC and AS from Apoe-KO mice, Mann-Whitney test (D, left panel). N.S., not significant, in vitro BBB models composed of apoE3-PC, and EC and AS from Apoe-KO mice vs. in vitro BBB models composed of apoE4-PC, and EC and AS from Apoe-KO mice, two-tailed Student t test (D, middle panel). **P<0.01, in vitro BBB models composed of apoE3-PC, and EC and AS from Apoe-KO mice vs. in vitro BBB models composed of apoE4-PC, and EC and AS from Apoe-KO mice, two-tailed Student t test (D, right panel). N.S., not significant, in vitro BBB models composed of apoE3-EC, and PC and AS from Apoe-KO mice vs. in vitro BBB models composed of apoE4-EC, and PC and AS from Apoe-KO mice, two-tailed Student t test (E). Six independent primary cell lines, each of which were prepared from brains of 4 male and 4 female mice, were analyzed. N.S., not significant, in vitro BBB models composed of apoE3-PC, and EC and AS from Apoe-KO mice vs. in vitro BBB models composed of apoE4-PC, and EC and AS from Apoe-KO mice, χ2 test (G).
Collagen IV deposition on brain capillaries are reduced in apoE4-TR mice
To investigate the pathophysiological relevance of our findings in vivo, we performed immuno-histochemical analyses of vascular-related molecules in cortical sections from aged apoE3-TR and apoE4-TR mice (Figure 5A). Confocal microscopy revealed that immunofluorescence signal intensity of collagen IV staining was independently diminished in male mice or in apoE4-TR mice (Figure 5B), while no differences were observed in the coverage of CD31-positive endothelial cells by claudin-5 (Figure 5C) and occludin (Figure 5D) staining. In addition, to investigate whether endothelial cell-pericyte interactions differ depending on apoE isoforms, a pericyte marker CD13 was stained in apoE-TR mice (Figure 5A). Although apoE isoforms likely affect pericyte coverage of endothelial cells in AD brains19, we did not detect significant differences in the coverage of CD31-positive endothelial cells by CD13-positive pericytes between male and female apoE3-TR and apoE4-TR mice (Figure 5E). Since endothelial cell-astrocyte interaction is an integral component for proper BBB function38, we also examined the perivascular expression of aquaporin 4, a specific marker for astrocytic end-feet (Figure 5A). There was no significant apoE isoform-dependent difference in aquaporin 4-positive end-feet coverage of CD31-positive endothelial cells in the cortex across apoE-TR mice (Figure 5F). These results indicate that apoE isoforms have a differential impact on basement membrane components rather than endothelial tight junction protein, coverages of endothelial cells by pericytes, or coverage of endothelial cells by astrocyte end-feet in vivo.
Figure 5. Reduced collagen-IV deposition along cortical capillaries in apoE4-TR mice.
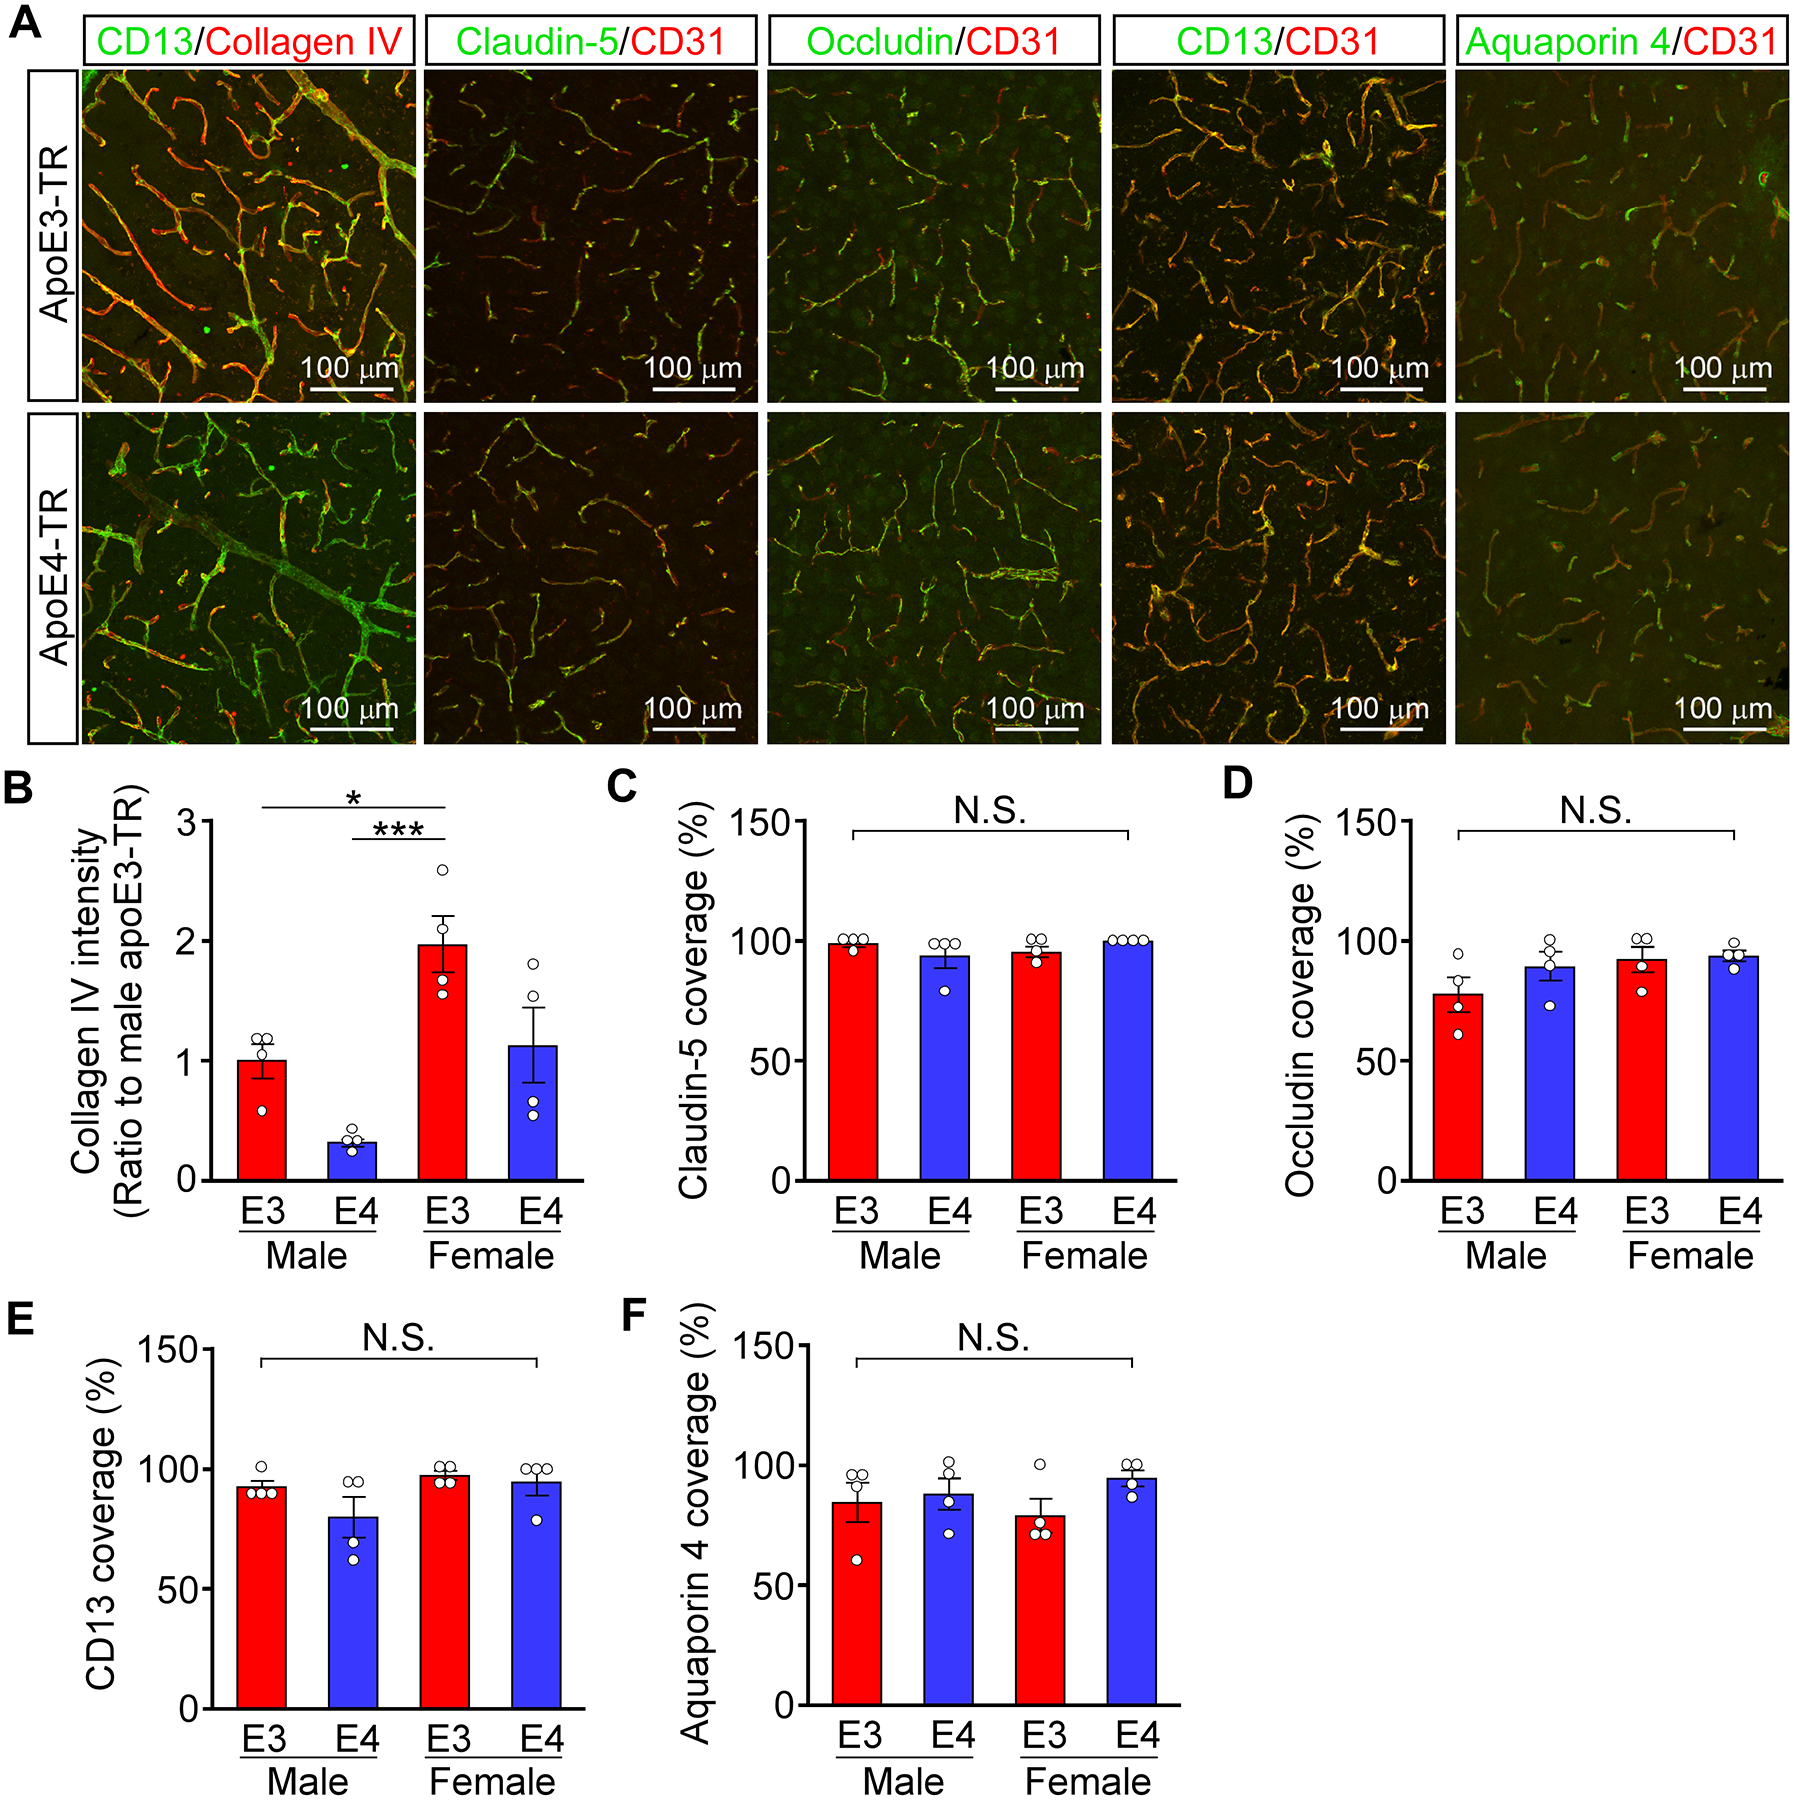
A, Collagen IV, CD31, claudin-5, occludin, CD13 and AQP4 were stained in frozen cortical sections from apoE3-TR (male; N=4, female; N=4) or apoE4-TR mice (male; N=4, female; N=4) at the age of 22 months. B, Total fluorescence intensity of collagen IV in cortical sections from those apoE-TR mice were quantified by ImageJ software (apoE, p=0.0034; sex, p=0.0011, apoE × sex, p=0.7080). C-F, The % of coverage against CD31-positive endothelial by claudin-5 (C, apoE, p=0.9304; sex, p=0.6093, apoE × sex, p=0.1227), occludin (D, apoE, p=0.2478; sex, p=0.1107, apoE × sex, p=0.3657), CD13 (E, apoE, p=0.1683; sex, p=0.0897, apoE × sex, p=0.3923) or AQP4 (F, apoE, p=0.1698; sex, p=0.9376, apoE × sex, p=0.3703) was quantified in cortical sections from the mice. Data in B-F are presented as mean ± s.e.m. Each dot in B-F represents a measurement from one mouse. *P<0.05, ***P<0.001 by Tukey-Kramer’s post-hoc analysis of two-way ANOVA. N.S., not significant among groups.
Plasma protein leakage in brain parenchyma is exacerbated in apoE4-TR mice
Consistent with the results from immunostaining, the amounts of cortical collagen IV (Figure 6A), but not claudin-5 (Figure 6B) and occludin (Figure 6C), were significantly lower in apoE4-TR mice than those in apoE3-TR mice when analyzed by ELISA, although sex-dependent difference was not detected. Furthermore, to evaluate BBB integrity in these mice, the volume of leaked plasma proteins, fibrinogen and IgG, in brain parenchyma were quantified. ELISA detected higher levels of fibrinogen (Figure 6D) and IgG (Figure 6E) in the cortex of apoE4-TR mice than apoE3-TR mice independent of sex, indicating the impaired BBB integrity in apoE4-TR mice. We also found that the levels of cortical collagen IV negatively correlated with those of fibrinogen (Figure 6F) and IgG (Figure 6G) across male and female apoE-TR mice. These results indicate that apoE isoforms differentially impact BBB integrity, likely by modulating the amounts of extracellular matrix proteins at cerebrovascular basement membrane.
Figure 6. Increased plasma protein leakage in the cortex of apoE4-TR mice.

A-E, The levels of collagen IV (A; apoE, p<0.0001; sex, p=0.4401, apoE × sex, p=0.7307), claudin-5 (B; apoE, p=0.4365; sex, p=0.5057, apoE × sex, p=0.4332), occludin (C, apoE, p=0.7529; sex, p=0.8528, apoE × sex, p=0.9210), fibrinogen (D, apoE, p=0.0002; sex, p=0.9759, apoE × sex, p=0.5057) and IgG (E, apoE, p=0.0428; sex, p=0.5767, apoE × sex, p=0.6582) were determined by ELISA in apoE3-TR (male; N=8, female; N=9) and apoE4-TR mice (male; N=8, female; N=8) at 22 months of age. The measurement was normalized by protein concentration in each of the samples. Data in A-E are presented as mean ± s.e.m. Each dot represents a measurement from one mouse. *P<0.05, **P<0.01 by Tukey-Kramer’s post-hoc analysis of two-way ANOVA. N.S., not significant among groups. F-G, The correlations between the levels of leaked plasma protein (fibrinogen and IgG) and that of collagen IV calculated across the male or female apoE3-TR (red circle) and apoE4-TR (blue circle) mice were assessed through nonparametric Spearman correlation analysis. The correlation coefficient (R2) and p value are shown in each panel.
Discussion
In this study, using primary pericytes from apoE3- and apoE4-TR mice to construct in vitro models as well as by examining cerebrovascular phenotype in vivo, we demonstrate that pericytes with different apoE isoforms differentially modulate ECM proteins in endothelial cells, impacting endothelial cell-related functions. The BBB is a functional unit composed of endothelial cells, pericytes, and astrocyte end-feet39. Both endothelial cells and astrocytes secrete ECM proteins to support basement membrane40–42, which stabilizes vascular structure and regulates vasculogenesis, endothelial barrier integrity and cellular signaling pathways43, 44. Although pericytes represent less than 2% of total cell population in CNS45, this cell type plays a critical role in regulating cerebrovascular functions at brain capillaries and precapillary arterioles17. Despite the fact that pericytes have an ability to produce abundant lipidated apoE shown in previous studies12–14 as well as in this study, they have received limited attention compared to astrocytes in terms of addressing cell-autonomous effect of APOE expression within the context of brain and cerebrovascular homeostasis2, 3. Our results reveal pericytic apoE isoform-dependent effects on endothelial integrity and function, thereby identifying apoE as a critical phenotypic regulator of pericytes.
The pericyte-endothelial cell interaction is critical for modulating the expression of major components of the cerebrovascular basement membrane including collagen IV, laminin, perlecan, nidogen and fibronectin31. Consistently, our 2-D and 3-D co-culture systems demonstrated up-regulation of ECM gene expression in endothelial cells when they were in contact with pericytes. Of note, we found that brain pericytes differentially induce ECM gene expression in endothelial cells, as well as their tube-like structure formation during a co-assembly event in the 3-D culture in an apoE isoform-dependent manner. Thus, carrying APOE4 in pericytes compromises their beneficial effects in supporting neighboring endothelial cells. Since the apoE isoform-dependent difference is absent in non-contact co-culture settings of pericytes and endothelial cells, it is unlikely that this difference is mediated by secreted molecules from pericytes. Rather, considering their close anatomical relationship with capillary endothelial cells in vivo, apoE isoforms may impact pericyte cell surface molecules in a cell autonomous manner, thereby modulating the endothelial cell-pericyte contact-dependent interaction. Further studies are needed to address the molecular and cellular mechanism underlying apoE isoform-dependent effects in pericytes.
By using in vitro BBB models composed of primary endothelial cells, pericytes and astrocytes, we also demonstrate that apoE isoforms in pericytes, but not endothelial cells, significantly modulate endothelial barrier integrity. While apoE isoforms in astrocytes have been shown to influence TEER in a similar model25, we show for the first time that pericytes expressing apoE4 are inferior to those with apoE3 in supporting the barrier integrity. Our results indicate that the phenotypes in BBB models composed of apoE4-pericytes are likely mediated by insufficient collagen IV production in endothelial cells rather than a disturbance of tight junction proteins. Consistent with these findings in vitro, we also found that cortical amounts of collagen IV but not that of claudin-5 or occludin are decreased in apoE4-TR mice compared to apoE3-TR mice at the age of 22 months. Most importantly, apoE4-TR mice exhibit greater plasma protein (IgG and fibrinogen) leakage into brain parenchyma compared to apoE3-TR mice. In line with our findings, several other studies have reported a reduction of vascular basement membrane in apoE4-TR mice21, 24, 46. Considering our in vitro results, it is possible that apoE4 impairs pericyte-mediated basement membrane formation, which contributes to the BBB disruption in apoE4-TR mice. On the other hand, a previous report concluded that apoE4 produced by astrocytes induces the reduction of tight junction proteins due to its reduced function in suppressing the activation of cyclophilin A (CypA)-nuclear factor-κB (NFkB)-matrix-metalloproteinase-9 (MMP-9) pathway in pericytes21, and also disturbs the phosphorylation of occludin by insufficiently inducing protein kinase C (PKC)η activation in endothelial cells25. Thus, it is reasonable to postulate that apoE4 might influence BBB integrity through multiple mechanisms mediated by different cell types within the neurovascular unit. As there are controversies regarding whether BBB disruption and tight junction pathologies occur in apoE4-knockin or TR mice21, 24, 25, 47, it should also be noted that different model systems and methodologies might lead to different observations. Furthermore, aging substantially influences BBB integrity48, cerebrovascular basement membrane formation49 and apoE isoform-dependent phenotype in vivo7. Further in vivo studies focusing on multiple elements vital for maintaining BBB integrity at different ages are necessary to fully clarify the mechanism by which apoE isoforms impact the BBB integrity, and ultimately impact neuronal homeostasis.
Several limitations of this study should be acknowledged. First, due to the in vitro nature of the results, the significance of cell-autonomous effect of APOE in pericytes should be further validated in vivo. In particular, it is critical to understand how apoE isoforms from different cell types in glio-vascular units synergistically maintain cerebrovascular homeostasis by utilizing in vivo cell-type specific mouse models. Second, although we present robust effects, the molecular mechanisms by which pericytes with different apoE isoforms differentially modulate ECM components from endothelial cells are unclear. Future single cell omics studies focusing on the interaction between pericytes and endothelial cells will likely refine the potential mechanism. Third, due to the technical difficulty in modulating the gene expression in primary endothelial cells (data not shown), the causal relationship between ECM expression and endothelial cell phenotypes could not be thoroughly addressed in this study. Nonetheless, distinct phenotypes by apoE4-pericytes compared to the reference apoE3-pericytes with respect to the interaction with endothelial cells are clearly highlighted by the results from multiple complementary approaches in vitro.
In summary, we showed that pericytes expressing apoE4 are less efficient in supporting endothelial cell function and inducing ECM production and barrier formation compared to those expressing apoE3 in vitro. Results of our study provide a new insight into an unexplored area of cerebrovascular research by defining apoE in brain pericytes as a potential regulator of endothelial phenotype in an apoE isoform-dependent manner. Impaired BBB integrity allows plasma proteins to leak into the brain parenchyma over time during aging, which could directly or indirectly damage brain homeostasis. Indeed, the leakage of intravenously administered Gadolinium-based contrast agent was more evident in mild cognitive impairment (MCI) patients compared to age-matched normal individuals50. Of note, the cerebrospinal fluid (CSF)/plasma albumin quotient was higher in aged APOE4 carriers than of APOE4 non-carriers in cognitively normal individuals22, suggesting a greater magnitude of BBB disruption in APOE4 carriers. Thus, APOE4-mediated endothelial dysfunction may be significantly involved in the susceptibility for cognitive decline. With the growing interests of vascular contribution to brain homeostasis and cognitive functions36, 51, 52, pericytes should be explored further as a critical cellular population that contributes to the pathogenic pathways for APOE4-related neurodegeneration.
Supplementary Material
Highlights.
Pericytes expressing apoE4 are less efficient in supporting endothelial cell function because of their diminished property to induce ECM production and barrier formation compared to those expressing apoE3 in vitro.
ApoE4-TR mice showed decreased extracellular matrix protein expression correlating with increased plasma protein leakages compared to apoE3-TR mice.
Impaired pericyte functions likely contribute to the cerebrovascular effects of apoE4.
Acknowledgements:
The authors thank Lindsey M. Felton and Lucy Job for careful reading of the manuscript.
Sources of Funding:
This work was supported by grants from the National Institutes of Health (NIH) (RF1AG051504, P50AG016574, R37AG027924, R01AG035355, and R01AG046205 to G.B., and R01AG051574 to T.K.); a Cure Alzheimer’s Fund (to G.B.), an American Heart Association grant (15SDG22460003 to T.K.); Florida Department of Health Ed and Ethel Moore Alzheimer’s Disease Research Program (7AZ22 to T.K.); and fellowships from Japan Society for the Promotion of Science (JSPS), Mochida Memorial Foundation for Medical & Pharmaceutical Research, and American Heart Association (to Y.Y.).
Nonstandard Abbreviations and Acronyms
- 3-D
3-dimensional
- AD
Alzheimer’s disease
- Aβ
amyloid-β
- ApoE
apolipoprotein E
- Apoe-KO mouse
Apoe-knockout mouse
- ApoE-TR mouse
apoE-targeted replacement mouse
- BBB
blood-brain barrier
- CSF
cerebrospinal fluid
- CypA
cyclophilin A
- ECM
extracellular matrix
- HUVEC
human umbilical vein endothelial cell
- MMP-9
matrix-metalloproteinase-9
- MCI
mild cognitive impairment
- NG2
neural/glial antigen 2
- NFkB
nuclear factor-κB
- PDGFRβ
platelet-derived growth factor receptor-β
- PKC
protein kinase C
- qRT-PCR
quantitative real-time PCR
- TEER
trans-endothelial electrical resistance
Footnotes
Disclosures:
None
References
- 1.Van Cauwenberghe C, Van Broeckhoven C, Sleegers K. The genetic landscape of alzheimer disease: Clinical implications and perspectives. Genet Med. 2016;18:421–430 [DOI] [PMC free article] [PubMed] [Google Scholar]
- 2.Liu CC, Kanekiyo T, Xu H, Bu G. Apolipoprotein e and alzheimer disease: Risk, mechanisms and therapy. Nat Rev Neurol. 2013;9:106–118 [DOI] [PMC free article] [PubMed] [Google Scholar]
- 3.Bu G. Apolipoprotein e and its receptors in alzheimer’s disease: Pathways, pathogenesis and therapy. Nat Rev Neurosci. 2009;10:333–344 [DOI] [PMC free article] [PubMed] [Google Scholar]
- 4.Farrer LA, Cupples LA, Haines JL, Hyman B, Kukull WA, Mayeux R, Myers RH, Pericak-Vance MA, Risch N, van Duijn CM. Effects of age, sex, and ethnicity on the association between apolipoprotein e genotype and alzheimer disease. A meta-analysis. Apoe and alzheimer disease meta analysis consortium. Jama. 1997;278:1349–1356 [PubMed] [Google Scholar]
- 5.Kamboh MI, Aston CE, Ferrell RE, Hamman RF. Impact of apolipoprotein e polymorphism in determining interindividual variation in total cholesterol and low density lipoprotein cholesterol in hispanics and non-hispanic whites. Atherosclerosis. 1993;98:201–211 [DOI] [PubMed] [Google Scholar]
- 6.Corder EH, Saunders AM, Strittmatter WJ, Schmechel DE, Gaskell PC, Small GW, Roses AD, Haines JL, Pericak-Vance MA. Gene dose of apolipoprotein e type 4 allele and the risk of alzheimer’s disease in late onset families. Science. 1993;261:921–923 [DOI] [PubMed] [Google Scholar]
- 7.Shinohara M, Kanekiyo T, Yang L, Linthicum D, Fu Y, Price L, Frisch-Daiello JL, Han X, Fryer JD, Bu G. Apoe2 eases cognitive decline during aging: Clinical and preclinical evaluations. Ann Neurol. 2016;79:758–774 [DOI] [PMC free article] [PubMed] [Google Scholar]
- 8.Yamazaki Y, Painter MM, Bu G, Kanekiyo T. Apolipoprotein e as a therapeutic target in alzheimer’s disease: A review of basic research and clinical evidence. CNS Drugs. 2016;30:773–789 [DOI] [PMC free article] [PubMed] [Google Scholar]
- 9.Yamazaki Y, Zhao N, Caulfield TR, Liu CC, Bu G. Apolipoprotein e and alzheimer disease: Pathobiology and targeting strategies. Nat Rev Neurol. 2019;15:501–518 [DOI] [PMC free article] [PubMed] [Google Scholar]
- 10.Kanekiyo T, Xu H, Bu G. Apoe and abeta in alzheimer’s disease: Accidental encounters or partners? Neuron. 2014;81:740–754 [DOI] [PMC free article] [PubMed] [Google Scholar]
- 11.Buttini M, Masliah E, Yu GQ, Palop JJ, Chang S, Bernardo A, Lin C, Wyss-Coray T, Huang Y, Mucke L. Cellular source of apolipoprotein e4 determines neuronal susceptibility to excitotoxic injury in transgenic mice. Am J Pathol. 2010;177:563–569 [DOI] [PMC free article] [PubMed] [Google Scholar]
- 12.Wilhelmus MM, Otte-Holler I, Davis J, Van Nostrand WE, de Waal RM, Verbeek MM. Apolipoprotein e genotype regulates amyloid-beta cytotoxicity. J Neurosci. 2005;25:3621–3627 [DOI] [PMC free article] [PubMed] [Google Scholar]
- 13.Xu Q, Bernardo A, Walker D, Kanegawa T, Mahley RW, Huang Y. Profile and regulation of apolipoprotein e (apoe) expression in the cns in mice with targeting of green fluorescent protein gene to the apoe locus. J Neurosci. 2006;26:4985–4994 [DOI] [PMC free article] [PubMed] [Google Scholar]
- 14.Casey CS, Atagi Y, Yamazaki Y, Shinohara M, Tachibana M, Fu Y, Bu G, Kanekiyo T. Apolipoprotein e inhibits cerebrovascular pericyte mobility through a rhoa protein-mediated pathway. J Biol Chem. 2015;290:14208–14217 [DOI] [PMC free article] [PubMed] [Google Scholar]
- 15.Hamilton NB, Attwell D, Hall CN. Pericyte-mediated regulation of capillary diameter: A component of neurovascular coupling in health and disease. Front Neuroenergetics. 2010;2 [DOI] [PMC free article] [PubMed] [Google Scholar]
- 16.Sweeney MD, Ayyadurai S, Zlokovic BV. Pericytes of the neurovascular unit: Key functions and signaling pathways. Nat Neurosci. 2016;19:771–783 [DOI] [PMC free article] [PubMed] [Google Scholar]
- 17.Winkler EA, Bell RD, Zlokovic BV. Central nervous system pericytes in health and disease. Nat Neurosci. 2011;14:1398–1405 [DOI] [PMC free article] [PubMed] [Google Scholar]
- 18.Kisler K, Nelson AR, Rege SV, Ramanathan A, Wang Y, Ahuja A, Lazic D, Tsai PS, Zhao Z, Zhou Y, Boas DA, Sakadzic S, Zlokovic BV. Pericyte degeneration leads to neurovascular uncoupling and limits oxygen supply to brain. Nat Neurosci. 2017;20:406–416 [DOI] [PMC free article] [PubMed] [Google Scholar]
- 19.Halliday MR, Rege SV, Ma Q, Zhao Z, Miller CA, Winkler EA, Zlokovic BV. Accelerated pericyte degeneration and blood-brain barrier breakdown in apolipoprotein e4 carriers with alzheimer’s disease. J Cereb Blood Flow Metab. 2016;36:216–227 [DOI] [PMC free article] [PubMed] [Google Scholar]
- 20.Koizumi K, Hattori Y, Ahn SJ, Buendia I, Ciacciarelli A, Uekawa K, Wang G, Hiller A, Zhao L, Voss HU, Paul SM, Schaffer C, Park L, Iadecola C. Apoepsilon4 disrupts neurovascular regulation and undermines white matter integrity and cognitive function. Nat Commun. 2018;9:3816. [DOI] [PMC free article] [PubMed] [Google Scholar]
- 21.Bell RD, Winkler EA, Singh I, Sagare AP, Deane R, Wu Z, Holtzman DM, Betsholtz C, Armulik A, Sallstrom J, Berk BC, Zlokovic BV. Apolipoprotein e controls cerebrovascular integrity via cyclophilin a. Nature. 2012;485:512–516 [DOI] [PMC free article] [PubMed] [Google Scholar]
- 22.Halliday MR, Pomara N, Sagare AP, Mack WJ, Frangione B, Zlokovic BV. Relationship between cyclophilin a levels and matrix metalloproteinase 9 activity in cerebrospinal fluid of cognitively normal apolipoprotein e4 carriers and blood-brain barrier breakdown. JAMA Neurol. 2013;70:1198–1200 [DOI] [PMC free article] [PubMed] [Google Scholar]
- 23.Maharshak I, Salomon-Zimri S, Antes R, Liraz O, Nisgav Y, Livnat T, Weinberger D, Colton CA, Solomon AS, Michaelson DM. The effects of the apoe4 genotype on the developing mouse retina. Exp Eye Res. 2016;145:17–25 [DOI] [PubMed] [Google Scholar]
- 24.Alata W, Ye Y, St-Amour I, Vandal M, Calon F. Human apolipoprotein e varepsilon4 expression impairs cerebral vascularization and blood-brain barrier function in mice. J Cereb Blood Flow Metab. 2015;35:86–94 [DOI] [PMC free article] [PubMed] [Google Scholar]
- 25.Nishitsuji K, Hosono T, Nakamura T, Bu G, Michikawa M. Apolipoprotein e regulates the integrity of tight junctions in an isoform-dependent manner in an in vitro blood-brain barrier model. J Biol Chem. 2011;286:17536–17542 [DOI] [PMC free article] [PubMed] [Google Scholar]
- 26.Knouff C, Hinsdale ME, Mezdour H, Altenburg MK, Watanabe M, Quarfordt SH, Sullivan PM, Maeda N. Apo e structure determines vldl clearance and atherosclerosis risk in mice. J Clin Invest. 1999;103:1579–1586 [DOI] [PMC free article] [PubMed] [Google Scholar]
- 27.Yamazaki Y, Baker DJ, Tachibana M, Liu CC, van Deursen JM, Brott TG, Bu G, Kanekiyo T. Vascular cell senescence contributes to blood-brain barrier breakdown. Stroke. 2016;47:1068–1077 [DOI] [PMC free article] [PubMed] [Google Scholar]
- 28.Schildge S, Bohrer C, Beck K, Schachtrup C. Isolation and culture of mouse cortical astrocytes. J Vis Exp. 2013 [DOI] [PMC free article] [PubMed] [Google Scholar]
- 29.Krul ES, Tikkanen MJ, Schonfeld G. Heterogeneity of apolipoprotein e epitope expression on human lipoproteins: Importance for apolipoprotein e function. J Lipid Res. 1988;29:1309–1325 [PubMed] [Google Scholar]
- 30.Ren Y, van Blitterswijk M, Allen M, Carrasquillo MM, Reddy JS, Wang X, Beach TG, Dickson DW, Ertekin-Taner N, Asmann YW, Rademakers R. Tmem106b haplotypes have distinct gene expression patterns in aged brain. Mol Neurodegener. 2018;13:35. [DOI] [PMC free article] [PubMed] [Google Scholar]
- 31.Stratman AN, Malotte KM, Mahan RD, Davis MJ, Davis GE. Pericyte recruitment during vasculogenic tube assembly stimulates endothelial basement membrane matrix formation. Blood. 2009;114:5091–5101 [DOI] [PMC free article] [PubMed] [Google Scholar]
- 32.Bell RD, Winkler EA, Sagare AP, Singh I, LaRue B, Deane R, Zlokovic BV. Pericytes control key neurovascular functions and neuronal phenotype in the adult brain and during brain aging. Neuron. 2010;68:409–427 [DOI] [PMC free article] [PubMed] [Google Scholar]
- 33.Nikolakopoulou AM, Zhao Z, Montagne A, Zlokovic BV. Regional early and progressive loss of brain pericytes but not vascular smooth muscle cells in adult mice with disrupted platelet-derived growth factor receptor-beta signaling. PLoS One. 2017;12:e0176225. [DOI] [PMC free article] [PubMed] [Google Scholar]
- 34.Aveleira CA, Lin CM, Abcouwer SF, Ambrosio AF, Antonetti DA. Tnf-alpha signals through pkczeta/nf-kappab to alter the tight junction complex and increase retinal endothelial cell permeability. Diabetes. 2010;59:2872–2882 [DOI] [PMC free article] [PubMed] [Google Scholar]
- 35.Kazmierski R, Michalak S, Wencel-Warot A, Nowinski WL. Serum tight-junction proteins predict hemorrhagic transformation in ischemic stroke patients. Neurology. 2012;79:1677–1685 [DOI] [PubMed] [Google Scholar]
- 36.Yamazaki Y, Shinohara M, Shinohara M, Yamazaki A, Murray ME, Liesinger AM, Heckman MG, Lesser ER, Parisi JE, Petersen RC, Dickson DW, Kanekiyo T, Bu G. Selective loss of cortical endothelial tight junction proteins during alzheimer’s disease progression. Brain. 2019;142:1077–1092 [DOI] [PMC free article] [PubMed] [Google Scholar]
- 37.Simons M, Alitalo K, Annex BH, et al. State-of-the-art methods for evaluation of angiogenesis and tissue vascularization: A scientific statement from the american heart association. Circ Res. 2015;116:e99–132 [DOI] [PMC free article] [PubMed] [Google Scholar]
- 38.Abbott NJ, Ronnback L, Hansson E. Astrocyte-endothelial interactions at the blood-brain barrier. Nature Reviews Neuroscience. 2006;7:41–53 [DOI] [PubMed] [Google Scholar]
- 39.Zlokovic BV. Neurovascular pathways to neurodegeneration in alzheimer’s disease and other disorders. Nat Rev Neurosci. 2011;12:723–738 [DOI] [PMC free article] [PubMed] [Google Scholar]
- 40.Yousif LF, Di Russo J, Sorokin L. Laminin isoforms in endothelial and perivascular basement membranes. Cell Adh Migr. 2013;7:101–110 [DOI] [PMC free article] [PubMed] [Google Scholar]
- 41.Morris AW, Carare RO, Schreiber S, Hawkes CA. The cerebrovascular basement membrane: Role in the clearance of beta-amyloid and cerebral amyloid angiopathy. Front Aging Neurosci. 2014;6:251. [DOI] [PMC free article] [PubMed] [Google Scholar]
- 42.Baeten KM, Akassoglou K. Extracellular matrix and matrix receptors in blood-brain barrier formation and stroke. Dev Neurobiol. 2011;71:1018–1039 [DOI] [PMC free article] [PubMed] [Google Scholar]
- 43.Kalluri R. Basement membranes: Structure, assembly and role in tumour angiogenesis. Nat Rev Cancer. 2003;3:422–433 [DOI] [PubMed] [Google Scholar]
- 44.Zlokovic BV. The blood-brain barrier in health and chronic neurodegenerative disorders. Neuron. 2008;57:178–201 [DOI] [PubMed] [Google Scholar]
- 45.Crouch EE, Liu C, Silva-Vargas V, Doetsch F. Regional and stage-specific effects of prospectively purified vascular cells on the adult v-svz neural stem cell lineage. J Neurosci. 2015;35:4528–4539 [DOI] [PMC free article] [PubMed] [Google Scholar]
- 46.Hawkes CA, Sullivan PM, Hands S, Weller RO, Nicoll JA, Carare RO. Disruption of arterial perivascular drainage of amyloid-beta from the brains of mice expressing the human apoe epsilon4 allele. PLoS One. 2012;7:e41636. [DOI] [PMC free article] [PubMed] [Google Scholar]
- 47.Bien-Ly N, Boswell CA, Jeet S, Beach TG, Hoyte K, Luk W, Shihadeh V, Ulufatu S, Foreman O, Lu Y, DeVoss J, van der Brug M, Watts RJ. Lack of widespread bbb disruption in alzheimer’s disease models: Focus on therapeutic antibodies. Neuron. 2015;88:289–297 [DOI] [PubMed] [Google Scholar]
- 48.Erdo F, Denes L, de Lange E. Age-associated physiological and pathological changes at the blood-brain barrier: A review. J Cereb Blood Flow Metab. 2017;37:4–24 [DOI] [PMC free article] [PubMed] [Google Scholar]
- 49.Hawkes CA, Gatherer M, Sharp MM, Dorr A, Yuen HM, Kalaria R, Weller RO, Carare RO. Regional differences in the morphological and functional effects of aging on cerebral basement membranes and perivascular drainage of amyloid-beta from the mouse brain. Aging Cell. 2013;12:224–236 [DOI] [PubMed] [Google Scholar]
- 50.Montagne A, Barnes SR, Sweeney MD, Halliday MR, Sagare AP, Zhao Z, Toga AW, Jacobs RE, Liu CY, Amezcua L, Harrington MG, Chui HC, Law M, Zlokovic BV. Blood-brain barrier breakdown in the aging human hippocampus. Neuron. 2015;85:296–302 [DOI] [PMC free article] [PubMed] [Google Scholar]
- 51.Nation DA, Sweeney MD, Montagne A, et al. Blood-brain barrier breakdown is an early biomarker of human cognitive dysfunction. Nat Med. 2019;25:270–276 [DOI] [PMC free article] [PubMed] [Google Scholar]
- 52.Sweeney MD, Montagne A, Sagare AP, et al. Vascular dysfunction-the disregarded partner of alzheimer’s disease. Alzheimers Dement. 2019;15:158–167 [DOI] [PMC free article] [PubMed] [Google Scholar]
Associated Data
This section collects any data citations, data availability statements, or supplementary materials included in this article.