Abstract
Purpose
Boredom is an accepted part of adolescence. Developmental and contextual factors are likely to conspire to increase boredom during adolescence, which in turn relates to health risk behaviors. However, literature is lacking on the developmental course of boredom across adolescence as well as historical variation in boredom. The current study used multi-cohort nationally representative samples of U.S. secondary school students to identify historical trends and grade level differences in boredom overall and by sex.
Methods
The current study includes 8th, 10th, and 12th graders from 2008–2017 who completed the Monitoring the Future self-report survey (n=106,784). Joinpoint was used to identify historical trends in boredom and linear regression to identify grade-level differences.
Results
Boredom increased historically both across and within grades with girls generally demonstrating greater increases than boys. Across grade, boredom appears to peak in 10th grade for boys and decrease across grade for girls.
Conclusions
Study findings indicate boredom has been increasing among adolescents over the past several years, with greater increases among girls. Increases may be concomitant with recent increases in mental health difficulties, suggesting that the overarching psychosocial profile of U.S. adolescents is becoming less optimal. Findings also suggest boredom peaks in 10th grade overall although when analyzing separately by sex, girls’ boredom declines from 8th to 12th grade. It is clear that boredom is a worthy target for intervention both in clinical and prevention contexts.
Keywords: adolescent, boredom, cohort studies, historical trend, United States
Boredom is a common occurrence in adolescence with estimates that 91–98% experience boredom at some point [1]. A burgeoning interest in boredom from educational, psychological, and leisure literatures in the past decade informs our understanding of the role [2], causes [3], and types of boredom [4]. Adolescents appear especially prone to experiencing boredom. During adolescence, the increased quest for independence, autonomy, and novelty may create mismatches with limited novel opportunities provided in the social context especially given slower developing cognitive and regulatory abilities to structure time appropriately. Such mismatches may be associated with threats to optimal health and development. Evidence supports this, finding boredom is associated with negative outcomes such as substance use [5], risky sexual behavior [6], and poor academic performance [7]. Missing within the literature is a broader view of boredom prevalence, development, and historical variation. To address these gaps, the current study uses multi-cohort nationally representative samples of U.S. secondary school students to identify developmental and historical changes in boredom by looking at grade level differences and a decade of annual variation from 2008–2017.
Developmental and Historical Trends in Adolescent Boredom
Boredom is generally conceptualized as “the aversive state of wanting, but being unable, to engage in satisfying activity” [8]. For in-depth reviews of boredom, see Elpidorou and Raffaelli and colleagues as well as other sources cited [9,10]. Both theoretical and empirical work implicates an underlying attentional mechanism in causing and sustaining experiences of boredom [8,11–13]. We argue the emotional and cognitive components central to the definition of boredom bear greater implications for adolescents than adults given developmental changes during this life stage [14]. Developmentally, adolescents may be less equipped to effectively identify and cope with boredom. At the same time, environmental factors may serve to create experiences of boredom for adolescents. In Eastwood et al.’s [8] definition of boredom noted above, perceived constraints and lack of personal agency lead to difficulty in coping with boredom. Adolescents operate within contexts which often limit free choice at a time when individual autonomy is desired. Although greater autonomy is afforded as adolescents age, this typically occurs within family and leisure contexts. As a result, more restrictive contexts, such as school, may serve to further thwart meaningful engagement [15].
An in-depth examination of boredom in adolescence was conducted by Larson and Richards in 1991 who collected intensive longitudinal data on 5th to 9th graders from four U.S. schools in or near Chicago [15]. When looking at grade level differences, Larson and Richards found a curvilinear pattern with boredom peaking in 7th grade. Since then, there have been few intensive longitudinal studies of adolescent boredom and no data from U.S. nationally representative samples. Sharp and colleagues [16] measured leisure boredom biannually in a South African sample of adolescents from the beginning of 8th through the beginning of 11th grade, identifying no overall trend in boredom. Similarly, cross-sectional studies of age differences in adolescent boredom have been sparse. Martz et al. [7] used U.S. national data to consider correlates of high levels of boredom among 8th and 10th graders, finding higher levels of boredom at 8th than 10th grade. These limited studies leave a critical gap regarding the characterization of the normative developmental trend of boredom across adolescence [14]. Without this understanding, we lack a benchmark of normative boredom during adolescence to compare high versus low rates, identify abnormal and potentially maladaptive types of boredom, or examine historical changes in boredom.
Identifying historical trends in boredom can provide insight into how boredom is changing alongside other trends observed in adolescence. Boredom is conceptually separate from other emotional states [17], but is associated with mental health symptoms of depression [1] and anxiety [18]. Thus, historical trends in boredom may reflect trends in mental health problems. Some researchers suggest regular disengagement from one’s environment, a characteristic of boredom, may lead to feelings of sadness or even depression [19]. Historically, adolescent indicators of poor mental health have increased such as clinical diagnosis and treatment of psychiatric disorders and seeing a professional for mental health issues [20]. From 2005 through 2017, rates of major depressive episodes increased 52% among adolescents aged 12 to 17 years old [21]. Understanding how known correlates of mental health symptoms are changing will inform a broader view of historical trends in adolescent health and potential causes.
Sex Differences
Current literature on sex differences in boredom is somewhat mixed. Among adolescents, South African [22] and Australian [23] high school girls reported higher boredom than boys, although this difference was only for rural and not urban Australian girls. Among U.S. national samples of 8th and 10th graders, Martz et al. [7] found high levels of boredom were significantly more common among girls than boys. However, boys reported higher levels of boredom than girls in a young adult, cross-cultural sample from four countries including the U.S. [24]. Likewise, in a sample of U.S. college students, boys reported higher boredom [25] although a later, separate sample of students found no differences [26]. Given this, we tested for sex differences in boredom.
Current Study
Ultimately, developmental and contextual factors may create a “perfect storm” where individual and situation interacts, leading to boring situations that are difficult to exit in a healthy way. Given that boredom is normative in adolescence (and adulthood) it clearly plays a role across school and leisure contexts [1,15,22]. However, no studies to date have examined recent historical trends or used national samples, raising questions about levels of boredom among today’s youth. Our contribution is to analyze national multi-cohort data for historical trends and age differences among middle and high school students, providing a needed benchmark for comparative studies. Specifically, we use ten nationally representative samples of U.S. secondary school students to identify 1) if and how boredom changes historically from 2008–2017 by grade and sex and 2) if and how levels of boredom differ from 8th to 12th grade overall and by sex.
Methods
Sample
Monitoring the Future (MTF) [dataset] [27] conducts cross-sectional, annual surveys of U.S. nationally representative samples of 8th, 10th, and 12th graders in about 400 public and private high schools in the 48 contiguous United States [28]. Modal ages of the three grades were 14, 16, and 18 years old, respectively. Schools are selected using a multi-stage random sampling design and invited to participate for two years. Schools that decline participation are replaced with schools similar on geographic location, size, and urbanicity. The overall school participation rates (including replacement of schools that decline to participate) range from 90% to 99% for all study years. Self-administered questionnaires are given to students. Student response rates have ranged from 85.0% to 87.3%, averaging 86.5%. Almost all non-response is due to absenteeism with less than 1% of students refusing to participate. Detailed description of design and procedures are provided elsewhere [28,29]. The MTF study undergoes IRB approval on an annual basis by the University of Michigan Intuitional Review Board.
Starting in 2008, the surveys included two boredom items in 8th and 10th grades and one item in 12th. For purposes of comparison, only the one item available from 8th through 12th grade was used. This item was included on one of four survey forms in 8th and 10th grade, and one of six survey forms in 12th grade; forms are randomly distributed. The current study includes 8th, 10th, and 12th graders from 2008–2017 who completed the MTF survey (N=126,172). Students were excluded who were missing on sex or boredom (n=19,388) resulting in a final sample of 106,784 students. Using weighted frequencies, the sample was 48% male, mostly White (66%) with 20% Hispanic and 14% Black; with 41% in in 8th grade, 42% in 10th grade, and 17% in 12th grade. Students reported parental education levels, but not other measures of socio-economic status. Overall, it was reported that 58% of fathers and 50% of mothers completed at least some college.
Measures
Boredom was measured with the item “I am often bored.” Students rated their agreement on a five-point scale from disagree (1) to agree (5). Respondent sex (1=male, 2=female), grade (8th, 10th, 12th), and data collection year (2008–2017) were also included in analyses.
Analytic Plan
Analyses included identification of historical trends over time, mean comparisons across grade, and testing for sex differences across time and grade. Trends over time were identified using the National Cancer Institute’s [30] Joinpoint regression analysis software testing for 1) slopes that significantly differ from zero, indicating no change, and 2) points where the trend significantly changes (i.e., joinpoint). Joinpoint is a piecewise linear regression model previously used to identify historical trends in similar outcomes such as adolescent risk behavior [31]. Ten data points were available to examine boredom historically across years (2008–2017). Joinpoint software’s recommendations on the number of joinpoints able to be estimated were followed, allowing for a maximum of one change in slope (i.e., joint) [32]. The logarithmic transformation for the outcome variable was used to obtain a fixed annual percent change (APC) to ease interpretation. APC assumes boredom changes at a constant percentage of the previous year’s rate, resulting in continuity across years [32]. Model assumptions included heteroscedasticity of observations using standard errors as weights and uncorrelated errors as this option is not available for parallel comparisons. Sex comparisons were made using Joinpoint’s parallel comparison, which tests whether models have parallel trend growth while allowing for differing intercepts. Model selection is determined by a Monte Carlo permutation method [33]. Differences in year by sex were compared using SAS software version 9.4 PROC SURVEYREG to account for survey sampling weights. For grade level comparisons in boredom, Joinpoint was not appropriate given only three points (thus not allowing for tests of changes in slope). Instead, PROC SURVEYREG was used to conduct an ANOVA to compare means by grade and sex and accounting for survey sampling weights. If Wald’s F statistic is significant, then grade level contrasts (i.e., 8th vs 10th, 10th vs 12th) were conducted.
Results
Historical Trends in Boredom
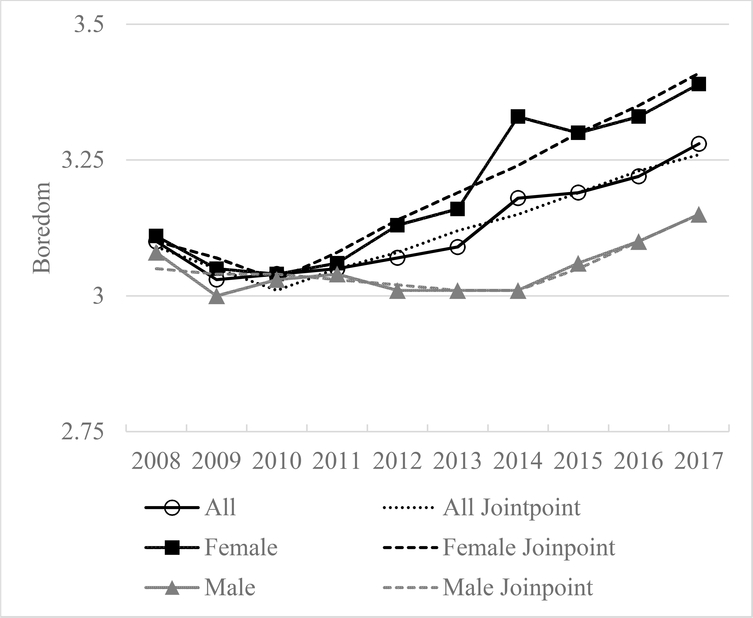
Estimates of student means and standard errors were obtained from SAS PROC SURVEYMEANS to account for survey weights and used in Joinpoint models. Joinpoint models were estimated initially for the entire sample (combining grade; Figure 1) and then separately by grade with sex comparisons (Figures 2–4). For the entire sample, a trend with one joint (i.e., two slopes) best fit the data. In this model, a negative slope was observed from 2008–2010 (APC=−1.17) but was not significantly different from zero (β=−0.01, SE=0.01, p=0.22) and a significant, positive slope was observed from 2010–2017 (APC=1.14; β=0.02, SE=0.01, p<0.05). Parallel comparisons by sex identified significantly different slopes for boys and girls. Both began with a negative slope, although not significantly different from zero, followed by a significant, positive slope. For boys, boredom increased from 2014–2017 (APC=1.6; β=0.02, SE=0.01, p<0.05) while for girls, boredom increased from 2010–2017 (APC=1.7; β=0.02, SE=0.00, p<0.01). Girls demonstrated significantly higher levels of boredom from 2012–2017.
Figure 1:
Level of Boredom by Year and Sex for All Grades
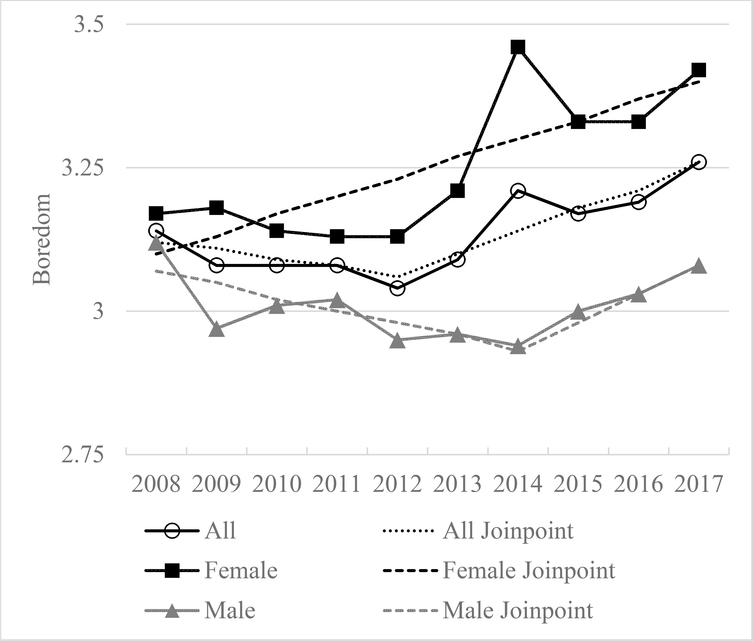
Figure 2:
Level of Boredom by Year and Sex for 8th Grade
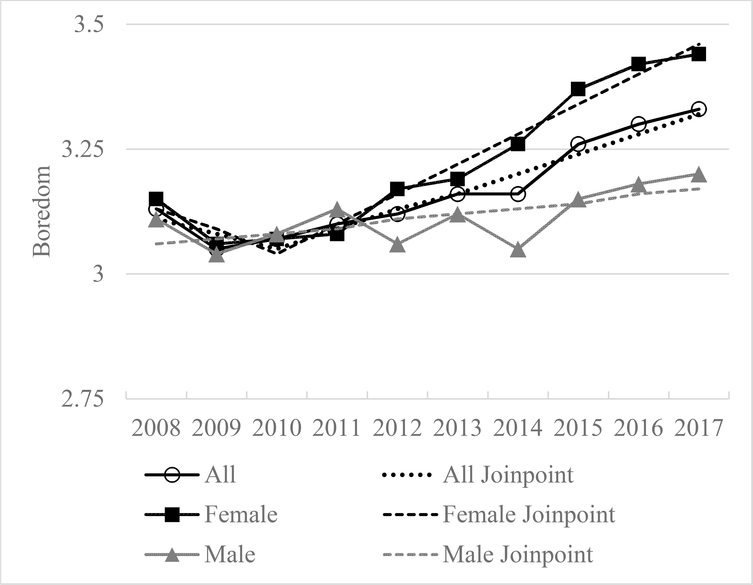
Figure 4:
Level of Boredom by Year and Sex for 12th Grade
Eighth grade
When examining 8th graders only (Figure 2), a negative slope was observed from 2008–2012 (APC=−0.51) but was not significantly different from zero and a significant positive slope from 2012–2017 (APC=1.24; β=0.01, SE=0.00, p<0.05). Parallel comparisons were rejected (p<0.01) indicating boys and girls differed in slope. The slope for boys was not significantly different from zero while girls were represented with one significant increasing slope from 2008–2017 (APC=1.02; β=0.01, SE=0.0, p<0.01). From 2009 through 2017, boredom was significantly higher for girls than boys.
Tenth grade
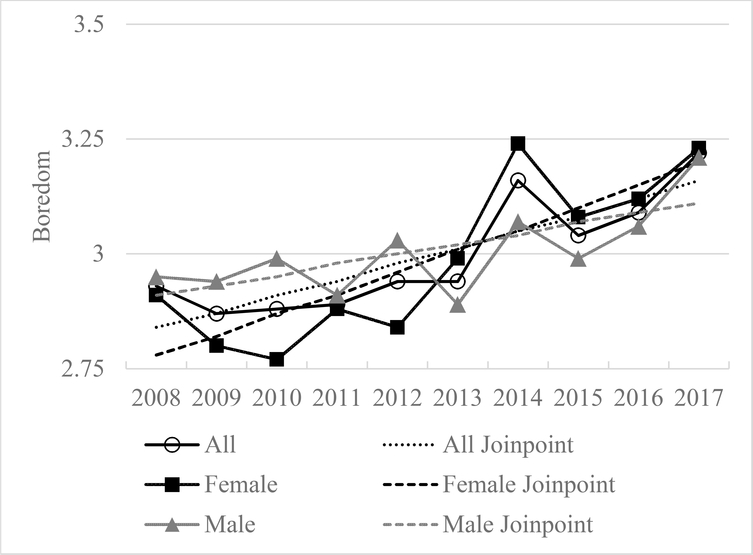
For 10th graders (Figure 3), a negative slope was observed from 2008–2010 (APC=−1.02) but was not significantly different from zero and a significant positive slope from 2010–2017 (APC=1.24; β=0.01, SE=0.00, p<0.001). Parallel comparisons were rejected (p<0.01). Boys demonstrated a significant increasing slope from 2008–2017 (APC=0.39; β=0.00, SE=0.00, p<0.05) while girls demonstrated a non-significant decreasing slope from 2008–2010 and a significant increasing slope from 2010–2017 (APC=1.88; β=0.02, SE=0.00, p<0.0001). From 2014 through 2017, boredom was significantly higher for girls than boys.
Figure 3:
Level of Boredom by Year and Sex for 10th Grade
Twelfth grade
Twelfth graders (Figure 4) demonstrated a significant increasing slope from 2008–2017 (APC=1.17; β=0.01, SE=0.00, p<0.01). Parallel comparisons were rejected (p<0.01). Both boys (β=0.01, SE=0.00, p<0.05) and girls (β=0.02, SE=0.00, p<0.01) demonstrated significant increasing slopes from 2008–2017 but girls demonstrated a greater annual percent change, or steeper slope, than boys (APCfemale=1.59; APCmale=0.75); and in the modeled data, girls had a lower level of boredom in 2008 (Interceptfemale=−30.61; Interceptmale=−13.91). Boredom significantly differed in 2009 and 2012 when boys had higher levels and 2014 when girls had higher levels of boredom.
Grade Differences in Boredom
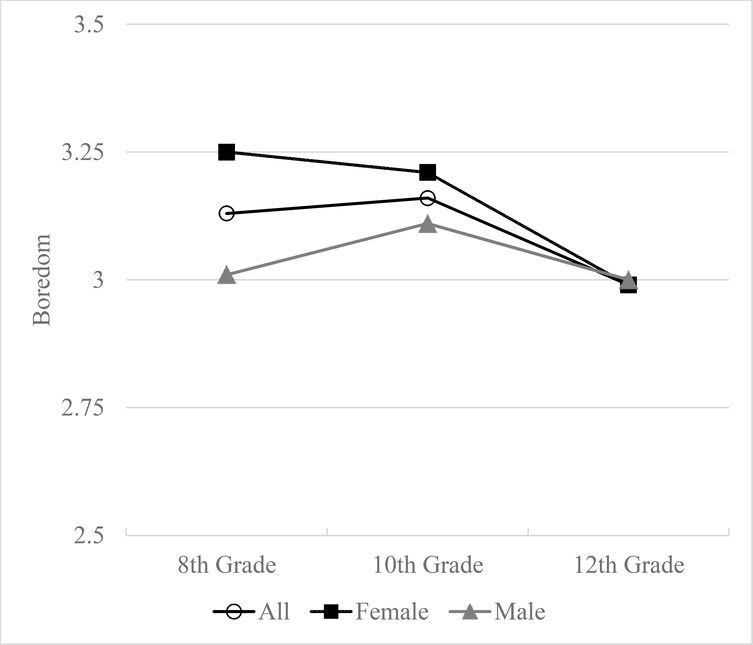
Mean comparisons were conducted to identify fluctuations by grade (see Figure 5). Boredom was significantly higher at 10th than 8th grade (3.13 to 3.16; F=7.73, df=1, p=.0054), and it was significantly lower at 12th than 10th grade (2.99; F=158.46, df=1, p<.0001). A similar pattern was seen in boys where boredom peaked in 10th grade (3.01 to 3.11; F=39.54, df=1, p<.0001) and then was lower at 12th grade (3.00; F=33.91, df=1, p<.0001). However, girls demonstrated significantly higher boredom at 8th than 10th grade (3.25 to 3.21; F=4.57, df=1, p=.0325), and significantly higher boredom at 10th than 12th grade (2.99; F=139.64, df=1, p<.0001). In regard to gender differences girls showed significantly higher boredom than boys in 8th and 10th grade, but in 12th grade there were no significant sex differences.
Figure 5:
Level of Boredom by Grade and Sex
Discussion
The current study used a decade of annual assessments of U.S. nationally representative samples of 8th, 10th, and 12th graders to identify historical trends and differences by grade in self-reported boredom. Trend results identified historical and grade level increases in boredom with greater increases for girls across time. Grade level differences showed a peak in boredom in 10th grade overall and for boys, whereas girls showed a peak in 8th grade. These results provide first ever evidence that boredom is increasing historically among teens in the U.S., especially for girls.
More Bored Today Than Yesterday?
When viewing boredom historically from 2008 to 2017, evidence of increases over time emerged both across and within grades. Sex differences were found in all models with girls demonstrating greater annual increases (i.e., annual percent change) in boredom. With grade levels combined, boys and girls demonstrated similar annual percent change over time (1.6% and 1.7% respectively) although growth for boys began later than for girls (2014 vs 2010). In 8th grade, a significant trend was found only for girls, which increased 1.0% annually from 2008 through 2017. Although the 10th grade boys increase in boredom began two years earlier than girls (2008 vs 2010), girls increased annual by almost 2% compared to boys 0.4%. Finally, both boys and girls demonstrated increase from 2008–2017 in 12th grade, but again girls had a higher annual percent change than boys (1.6% vs 0.8% respectively). Thus, our findings indicate that boredom is on the rise among middle and high school students over the past several years, with increases being greater for girls.
We suspect boredom is one factor in a constellation of factors changing historically. For example boredom has been associated with sensation seeking [34] and depressive symptoms [14,35] and evidence indicates that both sensation seeking and depressive symptoms are increasing among U.S. adolescents [21,31,36]. Thus, boredom may be increasing along with other potentially health-compromising behaviors and emotions during adolescence. In addition, the increase in boredom may be part of broader historical changes in behavior such as digital and social media use and time spent alone, both of which are associated with boredom [7]. From 2006–2016, digital media use doubled for 12th graders (from 1–2 hours/day) and increased by 75% for 10th graders with the majority of daily activity in 2016 attributed to social media sites [37]. Within this same timeframe, we see decreases in adolescents going out with friends (without their parents) and spending more time alone [38]. Perhaps boredom is simply one more indicator of adolescent dissatisfaction with how their time is spent.
Developmental Changes in Boredom
Mean grade comparisons identified different patterns of boredom for boys and girls. Previous literature suggests boredom peaks during middle school [15] and decreases into adulthood. Prior work with MTF data identified grade differences such that high levels of boredom (i.e., scoring a 4 to 5 on a 5-point scale) were more common in 8th than 10th grade (21.6% vs 18.7% respectively [7]. Current study data were available for 8th through 12th graders and not able to capture changes from middle school through adulthood. Given maturational sex differences, perhaps the current study is capturing these peaks for boys in 10th grade and girls in 8th grade.
Sex Differences
Regarding sex differences, a consistent pattern emerged over the years such that girls demonstrated steeper increases in boredom and generally higher levels of boredom than boys. Annual percent change of boredom in boys was not significant in 8th grade, 0.39% in 10th grade, and 0.75% in 12th grade; for girls it was 1.02%, 1.88% and 1.59% respectively. Although we were unable to statistically compare the strength or intensity of change, the steeper trend in female boredom indicates that adolescent girls are becoming increasingly more bored than boys. Mean levels of boredom were consistently higher among girls in 8th and 10th grade but not as consistent in 12th grade. Thus, our findings are consistent with others that have reported higher levels of boredom among girls than boys during adolescence [7,22,23]. It is noteworthy that depressive affect, which has been increasing historically for teens, has increased more for girls than for boys [36]. Given that some evidence suggests that this sex difference may reverse during the transition to adulthood [25,39], our findings regarding higher levels for girls may be developmentally limited and relate to sex-graded activities and opportunities in adolescence as well as sex differences in experiencing boredom in adolescence. When viewing boredom as a constellation of factors as previously described, this may be due to girls being more sensitive to social interactions, especially unsatisfying social interactions, than boys or translating their experiences of loneliness into boredom [14].
Strengths and Limitations
Strengths include the use of a decade of annual U.S. nationally representative surveys of 8th, 10th, and 12th graders with consistent design, sampling procedures, and measurement across the years. A primary limitation includes the use of a single item to measure subjective boredom; however, large datasets must consider issues of participant burden and therefore many historical comparisons are limited to a single or few indicators. An additional limitation is that adolescents not in school are not included in the sampling frame, thus our findings may not generalize to those who drop out of school or are frequently absent from school. In this regard, our findings are likely to underestimate the extensiveness of boredom across the full adolescent population.
Conclusion and Future Directions
As our findings document, boredom is increasing among U.S. middle and high school students, with the increases being faster among girls. These increases in boredom may be concomitant with recent increases in mental health difficulties, suggesting that the overarching psychosocial profile of U.S. adolescents is becoming less optimal. Given this profile of the change in level of boredom from 2008 through 2017, a few questions arise. Why are adolescents reporting more boredom and why are girls increasingly more susceptible to experiencing boredom? To address these questions, we recommend next steps of a) use of a more robust, multi-dimensional measure of boredom, b) continued use of U.S. nationally representative data to identify correlates and predictors of historical and developmental change in boredom and sub-groups of those most and least at risk of experiencing boredom and negative outcomes, and c) use of intensive longitudinal data to identify how individual and situational factors combine to create experiences of boredom and understand those who have difficulty exiting such experiences. Given that developmental changes in cognition and emotion may make adolescents more sensitive to boredom, understanding and accounting for these differences is critical. Whether increasing boredom is a cause, correlate, or symptom of increasing mental health difficulties, it is clear that boredom is a worthy target for intervention both in clinical contexts where boredom is “complicating factor” [13] and in prevention contexts where skills to effectively cope with boredom can be instilled [40].
Implications and Contribution.
This study uses national samples to examine boredom historically or across grade. Findings indicate boredom has been increasing among adolescents over the past several years, with greater increases among girls. It is clear that boredom is a worthy target for intervention both in clinical and prevention contexts.
Acknowledgments
Research reported in this publication was supported by National Institute on Drug Abuse of the National Institutes of Health under award number R01DA001411. The content is solely the responsibility of the authors and does not necessarily represent the official views of the National Institutes of Health.
Footnotes
Conflict of Interest: Authors report no conflict of interest. The study sponsor had no role involvement in development of study design; collection, analysis, and interpretation of data, writing of the report, or decision to submit the manuscript for publication. The first author wrote the first draft of the manuscript and no form of payment was given to anyone to produce the manuscript.
Publisher's Disclaimer: This is a PDF file of an unedited manuscript that has been accepted for publication. As a service to our customers we are providing this early version of the manuscript. The manuscript will undergo copyediting, typesetting, and review of the resulting proof before it is published in its final form. Please note that during the production process errors may be discovered which could affect the content, and all legal disclaimers that apply to the journal pertain.
References
- [1].Chin A, Markey A, Bhargava S, et al. Bored in the USA: Experience sampling and boredom in everyday life. Emotion 2017;17:359–68. [DOI] [PubMed] [Google Scholar]
- [2].Bench SW, Lench H. On the function of boredom. Behav Sci (Basel) 2013;3:459–72. [DOI] [PMC free article] [PubMed] [Google Scholar]
- [3].Mercer-Lynn KB, Bar RJ, Eastwood JD. Causes of boredom: The person, the situation, or both? Pers Individ Dif 2014;56:122–6. [Google Scholar]
- [4].Goetz T, Frenzel AC, Hall NC, et al. Types of boredom: An experience sampling approach. Motiv Emot 2014;38:401–19. [Google Scholar]
- [5].Weybright EH, Caldwell LL, Ram N, et al. Boredom prone or nothing to do? Distinguishing between state and trait leisure boredom and its association with substance use in South African adolescents. Leis Sci 2015;37:311–31. [DOI] [PMC free article] [PubMed] [Google Scholar]
- [6].Miller JA, Caldwell LL, Weybright EH, et al. Was Bob Seger right? Relation between boredom in leisure and [risky] sex. Leis Sci 2014;36:52–67. [DOI] [PMC free article] [PubMed] [Google Scholar]
- [7].Martz ME, Schulenberg JE, Patrick ME, et al. “I am so Bored!”: Prevalence rates and sociodemographic and contextual predictors of boredom among American adolescents. Youth Soc 2018;50:688–710. [Google Scholar]
- [8].Eastwood JD, Frischen A, Fenske MJ, et al. The unengaged mind: Defining boredom in terms of attention. Perspect Psychol Sci 2012;7:482–95. [DOI] [PubMed] [Google Scholar]
- [9].Raffaelli Q, Mills C, Christoff K. The knowns and unknowns of boredom: a review of the literature. Exp Brain Res 2017;0:1–12. [DOI] [PubMed] [Google Scholar]
- [10].Elpidorou A The bored mind is a guiding mind: toward a regulatory theory of boredom. Phenomenol Cogn Sci 2018;17:455–84. [Google Scholar]
- [11].Westgate EC, Wilson TD. Boring thoughts and bored minds: The MAC model of boredom and cognitive engagement. Psychol Rev 2018. [DOI] [PubMed] [Google Scholar]
- [12].Hunter A, Eastwood JD. Does state boredom cause failures of attention? Examining the relations between trait boredom, state boredom, and sustained attention. Exp Brain Res 2016:1–10. [DOI] [PubMed] [Google Scholar]
- [13].Gerritsen CJ, Toplak ME, Sciaraffa J, et al. I can’t get no satisfaction: Potential causes of boredom. Conscious Cogn 2014;27:27–41. [DOI] [PubMed] [Google Scholar]
- [14].Spaeth M, Weichold K, Silbereisen RK. The development of leisure boredom in early adolescence: Predictors and longitudinal associations with delinquency and depression. Dev Psychol 2015;51:1380–94. [DOI] [PubMed] [Google Scholar]
- [15].Larson RW, Richards MH. Boredom in the middle school years: Blaming schools versus blaming students. Am J Educ 1991;99:418. [Google Scholar]
- [16].Sharp EH, Coffman DL, Caldwell LL, et al. Predicting substance use behavior among South African adolescents: The role of leisure experiences across time. Int J Behav Dev 2011;35:343–51. [DOI] [PMC free article] [PubMed] [Google Scholar]
- [17].Goldberg YK, Eastwood JD, LaGuardia J, et al. Boredom: An emotional experience distinct from apathy, anhedonia, or depression. J Soc Clin Psychol 2011;30:647–66. [Google Scholar]
- [18].LePera N Relationships between boredom proneness, mindfulness, anxiety, depression, and substance use. New School Psychol Bull 2011;8:15–25. [Google Scholar]
- [19].Isacescu J, Struk AA, Danckert J. Cognitive and affective predictors of boredom proneness. Cogn Emot 2016. [DOI] [PubMed] [Google Scholar]
- [20].Collishaw S Annual research review: Secular trends in child and adolescent mental health. J Child Psychol Psychiatry 2015;56:370–93. [DOI] [PubMed] [Google Scholar]
- [21].Twenge JM, Cooper AB, Joiner TE, et al. Age, period, and cohort trends in mood disorder indicators and suicide-related outcomes in a nationally representative dataset, 2005–2017. J Abnorm Psychol 2019;128:185–99. [DOI] [PubMed] [Google Scholar]
- [22].Wegner L, Flisher AJ. Leisure boredom and adolescent risk behaviour: A systematic literature review. J Child Adolesc Ment Health 2009;21:1–28. [DOI] [PubMed] [Google Scholar]
- [23].Patterson I, Pegg S, Dobson-Patterson R. Exploring the links between leisure boredom and alcohol use among youth in rural and urban areas of Australia. J Park Recreat Admi 2000;18:53–75. [Google Scholar]
- [24].Sundberg ND, Latkin CA, Farmer RF, et al. Boredom in young adults: Gender and cultural comparisons. J Cross Cult Psychol 1991;22:209–23. [Google Scholar]
- [25].Vodanovich SJ, Kass SJ. Age and gender differences in boredom proneness. J Soc Behav Personal 1990;5:297–307. [Google Scholar]
- [26].Hickerson BD, Beggs BA. Leisure time boredom: Issues concerning college students. Coll Stud J 2007;41:1036–44. [Google Scholar]
- [27].Miech RA, Johnston LD, Bachman JG, et al. Monitoring the Future (MTF) public-use cross-sectional datasets. Inter-University Consortium for Political and Social Research, University of Michigan; 2019. [Google Scholar]
- [28].Miech RA, Johnston LD, O’Malley PM, et al. Monitoring the Future national survey results on drug use, 1975–2018: Volume I, secondary school students; Ann Arbor, MI: 2019. [Google Scholar]
- [29].Bachman JG, Johnston LD, O’Malley PM, et al. The Monitoring the Future project after four decades: Design and procedures. Ann Arbor, MI: 2015. [Google Scholar]
- [30].National Cancer Institute. Joinpoint Regression Program, Version 4.6.0.0 2018. [Google Scholar]
- [31].Keyes KM, Jager J, Hamilton A, et al. National multi-cohort time trends in adolescent risk preference and the relation with substance use and problem behavior from 1976 to 2011. Drug Alcohol Depend 2015;155:267–74. [DOI] [PMC free article] [PubMed] [Google Scholar]
- [32].Institute NC. Joinpoint Help Manual 4.5.0.1. Bethesda, MD: 2017. [Google Scholar]
- [33].Kim H-J, Fay MP, Feuer EJ, et al. Permutation tests for joinpoint regression with applications to cancer rates. Stat Med 2000;19:335–51. [DOI] [PubMed] [Google Scholar]
- [34].Zuckerman M Sensation seeking Beyond the optimal level of arousal. New York, NY, NY: Lawrence Erlbaum Associates; 1979. [Google Scholar]
- [35].Struck AA, Scholer AA, Danckert J. A self-regulatory approach to understanding boredom proneness. Cogn Emot 2016;30:1388–401. [DOI] [PubMed] [Google Scholar]
- [36].Keyes KM, Gary D, O’Malley PM, et al. Recent increases in depressive symptoms among US adolescents: trends from 1991 to 2018. Soc Psychiatry Psychiatr Epidemiol 2019;54:987–96. [DOI] [PMC free article] [PubMed] [Google Scholar]
- [37].Twenge JM, Martin GN, Spitzberg BH. Trends in U.S. Adolescents’ media use, 1976–2016: The rise of digital media, the decline of TV, and the (near) demise of print. Psychol Pop Media Cult 2018. [Google Scholar]
- [38].Twenge JM, Park H. The decline in adult activities among U.S. adolescents, 1976–2016. Child Dev 2017. [DOI] [PubMed] [Google Scholar]
- [39].Sundberg ND, Latkin CA, Farmer RF, et al. Boredom in young adults: Gender and cultural comparisons. J Cross Cult Psychol 1991;22:209–23. [Google Scholar]
- [40].Caldwell LL, Baldwin CK, Walls T, et al. Preliminary effects of a leisure education program to promote healthy use of free time among middle school adolescents. J Leis Res 2004;36:310–55. [Google Scholar]


