

Abstract
To improve HIV screening rates, New York State in 2010 mandated that all persons 13–64 years receiving health care services, including care in emergency departments (EDs), be offered HIV testing. Little attention has been paid to the effect of screening on patient flow. Time-stamped ED visit data from patients eligible for HIV screening, 7,844 of whom were seen by providers and 767 who left before being seen by providers, were retrieved from electronic health records in one adult ED. During day shifts, 10% of patients left without being seen, and during evening shifts, 5% left without being seen. All patients seen by providers were offered testing, and 6% were tested for HIV. Queuing models were developed to evaluate the effect of HIV screening on ED length of stay, patient waiting time, and rate of leaving without being seen. Base case analysis was conducted using actual testing rates, and sensitivity analyses were conducted to evaluate the impact of increasing the testing rate. Length of ED stay of patients who received HIV tests was 24 minutes longer on day shifts and 104 minutes longer on evening shifts than for patients not tested for HIV. Increases in HIV testing rate were estimated to increase waiting time for all patients, including those who left without being seen. Our simulation suggested that incorporating HIV testing into ED patient visits not only adds to practitioner workload but also increases patient waiting time significantly during busy shifts, which may increase the rate of leaving without being seen.
Keywords: HIV testing, queuing theory, emergency department, health care utilization, waiting times
About 1.2 million persons in the US are living with HIV, and about 12.8% of those living with the disease do not know that they are infected (Centers for Disease Control and Prevention [CDC], 2015). Therefore, HIV testing is of national health importance. The United States Preventive Services Task Force (USPTF) recommends that adolescents and adults aged 15–65 years, younger adolescents and older adults at increased risk for infection, and pregnant women be tested for HIV (US Preventive Services Task Force, 2015). CDC guidelines released in 2006 recommended non-targeted rapid HIV screening be done in locations where prevalence rates are estimated to be greater than or equal to 0.1%. In response to the CDC guidelines, in 2010, New York State enacted legislation (S.8227/A.11487) aimed at increasing HIV testing and linking HIV-positive persons to appropriate medical care.
The NY legislation mandates that HIV testing be offered to all persons between the ages of 13 and 64 years receiving health care services, which included those being seen in emergency departments (EDs). Because EDs are often congested, resulting in long wait times for patients and a stressed work environment for providers (Schnall, Clark, Olender, & Sperling, 2013), understanding the impact of increased HIV testing on the care delivery process in EDs is critical for the successful implementation of this legislation.
Using queuing models, which are an advanced mathematical modeling technique that can estimate customer wait times (Pitts, Pines, Handrigan, & Kellermann, 2012), we assessed the impact of HIV testing on patient wait times for ED bed placement and the rate of leaving without being seen. Our hypothesis was that patients who received HIV tests would have longer ED lengths of stay compared to those patients who did not, due to the additional time and resources used in the testing process; and that if there were a sufficiently large number of patients being tested for HIV, the overall wait time for all patients in the ED would be longer, and the rate of leaving without being seen also would be higher.
Queuing Theory and Models
Queuing theory has been used to guide both professional and non-professional staffing decisions in various industries. Queuing models are not simulation models but ana- lytic models; they often have closed-form formulas to predict system performance metrics. The derivation of such formulas relies on mathematical analysis of the underlying stochastic process, which is abstracted from reality and used to represent the dynamics in reality.
Many organizations such as banks, airlines, and tele- phone call centers (Brewton, 1989; Brigandi, Dargon, Sheehan, & Spencer III, 1994; Brusco, Jacobs, Bongiorno, Lyons, & Tang, 1995; Holloran & Byrn, 1986) as well as emergency systems such as police patrol, fire, and ambulances (Chelst & Barlach, 1981; Taylor & Huxley, 1989) routinely use quantitative models based on queuing theory to help determine human resource needs to respond to demands for service in a timely fashion. Queuing models have also been applied in healthcare settings to guide decisions on bed capacity (Gorunescu, McClean, & Millard, 2002; McManus, Long, Cooper, & Litvak, 2004; Sonnenberg, 2000; Worthington, 1987) and recently to physician staffing decisions. These models have generated useful managerial insights and policy implications for improving practice (Green, 2006; Pierskalla & Brailer, 1994).
To illustrate how a queuing model captures waiting phenomena, imagine customers who wait in a checkout line at a grocery store. This waiting line is referred to as a queue. Customers who have finished their shopping will wait in the queue until a checkout clerk is available. Because customers arrive randomly, and their number of items can vary substantially, the delays they encounter are highly variable and depend upon the number of clerks who are working and how fast they can work. Queuing models can explicitly incorporate variability in both the timing of customer arrivals and the time required to serve them, in order to provide reliable estimates for system performance metrics related to customer waiting.
In an ED, there is a great deal of variability in customer arrival rates. Arrival and care delivery rates are non-linear and non-intuitive, and thus impossible to predict without queuing models. In our queuing model, patients are the customers in the system, patients awaiting ED beds serve as the queue, and ED beds are servers (Fig. 1). Queuing models allowed us to estimate average patient wait time and the rate of leaving without been seen by a provider.
FIGURE 1.
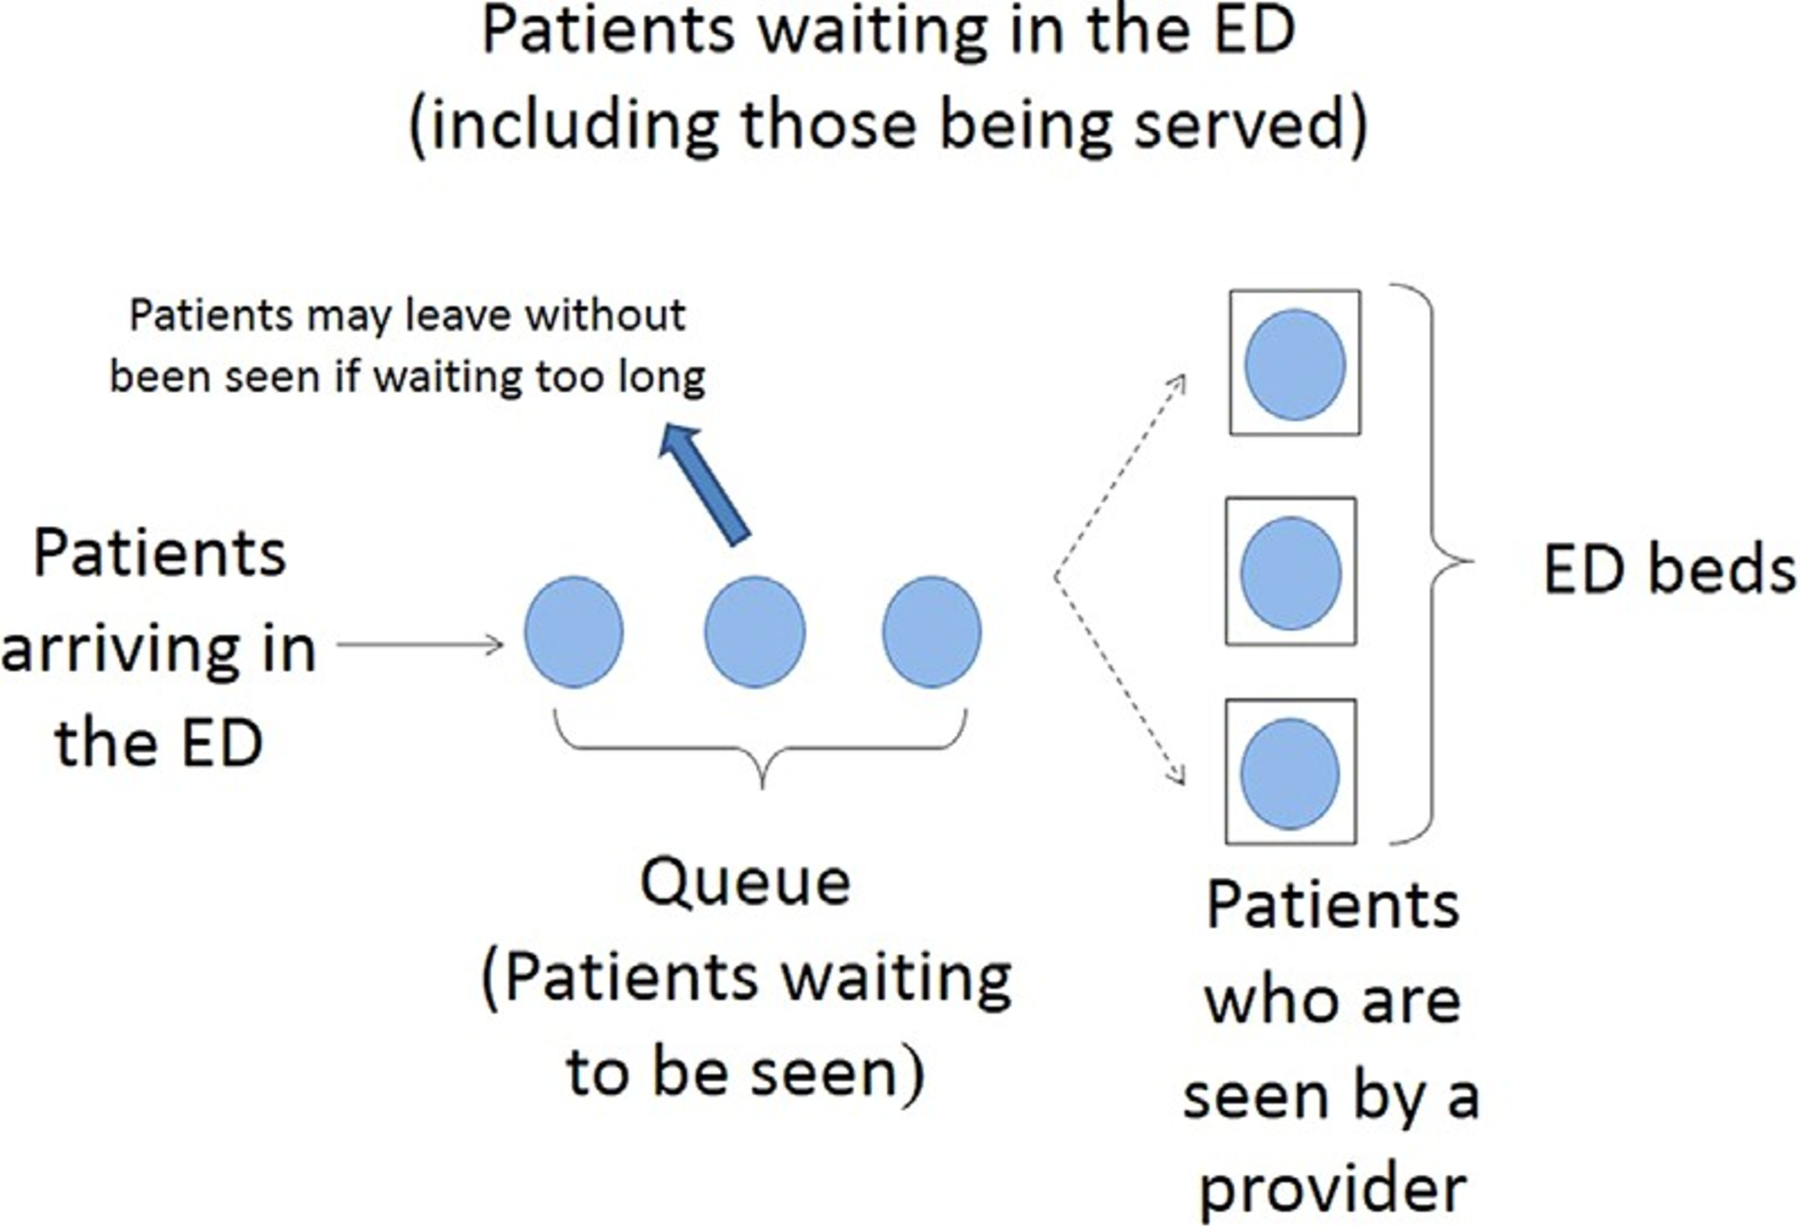
Queuing model for emergency department (ED) waiting times for service, in which patients are the customers in the system, patients in the ED awaiting beds are in the queue, and ED beds are the servers for patient care.
Methods
Study Setting
We studied one 15-bed adult ED from February to June 2012. This ED is part of a larger hospital network in New York City and has an annual volume of 41,000 patient visits (New York State Department of Health, 2012). The prevalence of persons living with HIV in the 5 ZIP codes around this ED was16.79 per 1,000 persons (New York City Department of Health and Mental Hygiene, 2011; United Hospital Fund, 2013).
In compliance with NY legislation, an electronic HIV testing order set and alert was added to the electronic health record in this ED to ensure that practitioners offered an HIV test to every patient discharged from the ED. This alert was triggered at the end of the visit, so a provider (i.e., a physician, physician assistant, or nurse practitioner) would be reminded to offer an HIV test to a patient before discharging the patient.
Data Source
Electronic health record data from all patients eligible for HIV testing who were seen during the study period were included. Patients over 64 years of age were excluded because their testing was not mandated in the legislation. We also excluded the patients who left the ED before being seen by a provider (N ¼ 767) from analyses of impact of HIV testing on length of stay, because they did not reach the point in the visit when they would be offered testing.
We analyzed time-stamped data files, also known as system usage logs, from the electronic health records (Sunrise Emergency Care, Allscripts Corporation, Chicago, IL) to capture the patients’ lengths of stay in the ED. In addition to basic patient demographic information such as gender, age, and severity of illness, we abstracted electronic data on the patient’s admission and discharge time, whether or not the patient consented to be tested for HIV, and whether other blood tests were done
Queuing Model Inputs
The classic queuing model assumes a constant customer arrival rate. However, patient arrival rates in the ED change over the course of a day. To account for this, we evaluated peak and nonpeak hours separately, as is often done (Green, Soares, Giglio, & Green, 2006; Kuchera & Rohleder, 2011). We divided the day into three intervals, according to the three 8-hour shifts for clinical and ancillary staff. These intervals were: 7am–3pm (day), 3–11pm (evening), 11pm–7am (night). Using the time-stamped arrival and discharge data, we calculated an hourly patient arrival rate (i.e., the average number of patients arriving to the ED per hour) and discharge rate (i.e., the average number of patients discharged from the ED per hour) in each shift over the course of the study period.
Traffic intensity can be interpreted as the average utilization level of ED beds and is an important indicator of the congestion level in the ED. It is calculated as the ratio of the average patient arrival rate to the maximum average discharge rate. If the traffic intensity during one shift is much less than 1, it indicates that ED is not busy during that shift, and patient waiting times are very short. How- ever, if the traffic intensity is greater than 1 and more patients are arriving than are leaving, it suggests that ED is overcrowded, and patient waiting times are very long. Under these conditions, patients may leave without being seen due to long waiting times. We focused our analysis on the two busier shifts (day and evening), both of which had observed traffic intensity greater than 1.
Data Analysis
When traffic intensity is greater than 1, conventional Markovian queuing models, such as the M/M/c queuing model, are not suitable because they ignore patients who may leave without being seen by providers and cannot analyze systems that are overcrowded. Therefore, we used fluid approximation models. Fluid queuing models allow for estimation of waiting times when customers leave the queue (i.e., patients in the ED who leave without being seen) and provide reliable estimates for customer waiting in an over- crowded environment (Ward, 2006). We developed shift- specific queuing models for day and evening, respectively.
Our base case analysis was modeled with data gathered after the electronic health record HIV testing alert for providers was in place in the ED, so we were unable to make simple before–after comparisons of length of stay. To better understand the impact of HIV testing rates on length of stay, we conducted a sensitivity analysis by varying testing rates from baseline to 7%, 10%, 15%, 20%, 30%, 50%, and 70%. We chose these HIV testing rates because in a review of 11 non-targeted HIV screening programs in EDs (Haukoos, 2012) and our own work (Schnall et al., 2013), the median proportion of eligible patients who were tested was 22%, with a range of 7–69%.
For a given HIV testing rate, a weighted average length of stay was calculated, in which the weights correspond to the percentages of patients who did and did not receive HIV tests. Differences in length of stay due to whether or not a patient received an HIV test were assessed for each of the three shifts using t-tests in R (Vienna, Austria). Queuing analysis was conducted in Excel (Microsoft, 2010) using the closed-form formula for the fluid queuing models (Ward, 2006).
Results
A total of 7,844 patients between 21 and 64 years of age eligible for HIV testing were seen by providers in the ED. The average age was 39 years, 61.1% were female, and 35.7% had other blood work completed during their ED vis- its. All were offered HIV tests. Of these, 5.6% (n ¼ 439) agreed to be tested for HIV.
Table 1 shows the summary statistics for the input parameters in the model for each shift in our study period. Day shifts had the highest patient arrival rate, followed by evening, and then night. During day shifts, about 7% of patients were tested for HIV, with a smaller proportion of patients tested during evening and night shifts.
Table 1.
Traffic Intensity, HIV Testing Rate, and Emergency Department Length of Stay on Day, Evening, and Night Shifts (N ¼ 7844)
| Length of Stay (Hours) | |||||||
|---|---|---|---|---|---|---|---|
| Tested | Not Tested | ||||||
| Arrival Rate (Patients/Hour) | Traffic Intensity | Received HIV Test (%) | Mean (SD) | Mean (SD) | p* | ||
| Day shift | 3.30 | 1.12 | 7.14 | 5.43 (2.87) | 5.04 (3.15) | 0.049 | |
| Evening shift | 2.63 | 1.05 | 3.76 | 7.68 (3.82) | 5.95 (3.54) | <0.01 | |
| Night shift | 1.12 | 0.42 | 5.36 | 6.37 (3.42) | 5.58 (3.39) | 0.063 | |
Note: Traffic intensity ¼ ratio of arrival rate to discharge rate. SD ¼ standard deviation.
p-value for difference in length of stay of patients who did and did not receive HIV tests.
As hypothesized, we found that patients who received HIV tests stayed longer in the ED than those who were not tested. Length of stay of patients who received HIV tests was 24 minutes longer on day shifts and 104 minutes longer on evening shifts than for patients who did not receive HIV tests (p < 0.05). On night shifts, the length of stay of those tested for HIV was 47 minutes longer, but this difference was not statistically significant (p > 0.05).
Table 2 shows the results of the baseline queuing models and the sensitivity analyses for different HIV testing rates in both day and evening shifts. In the base case, patients waited 28.62 minutes on average on the day shift and 14.27 minutes on the evening shift before ED bed placement or leaving without being seen. These numbers represent the average wait time, and some patients waited much longer than the average. We also estimated that during day shifts, 10.35% of patients left without being seen, and during the evening shift, 5.16% left without being seen. Increasing the HIV testing rates was estimated to increase waiting time for all patients, including those who left without being seen.
Table 2.
Simulated Impact of Increasing HIV Testing Rates during Day and Evening Shifts on Emergency Department (ED) Patients’ Waiting Times and Rates of Leaving Without Being Seen (LWBS)
| HIV Testing Rate | ||||||||
|---|---|---|---|---|---|---|---|---|
| Base case: 5.57% | 7% | 10% | 15% | 20% | 30% | 50% | 70% | |
| Day shift | ||||||||
| Average number of patients waiting for ED beds | 1.58 | 1.59 | 1.64 | 1.70 | 1.77 | 1.90 | 2.15 | 2.40 |
| Average waiting time for patients eventually admitted to the ED (minutes) | 30.21 | 30.61 | 31.43 | 32.81 | 34.17 | 36.88 | 42.22 | 47.46 |
| Average waiting time for all patients including those LWBS (minutes) | 28.62 | 28.97 | 29.71 | 30.93 | 32.14 | 34.53 | 39.15 | 43.61 |
| Rate of LWBS (%) | 10.35 | 10.48 | 10.74 | 11.18 | 11.62 | 12.48 | 14.16 | 15.77 |
| Evening shift | ||||||||
| Average number of patients waiting for ED beds | 0.62 | 0.66 | 0.72 | 0.83 | 0.94 | 1.15 | 1.54 | 1.90 |
| Average waiting time for patients eventually admitted to the ED (minutes) | 14.65 | 15.42 | 17.02 | 19.67 | 22.30 | 27.48 | 37.55 | 47.27 |
| Average waiting time for all patients including those LWBS (minutes) | 14.27 | 14.99 | 16.51 | 18.99 | 21.42 | 26.16 | 35.11 | 43.45 |
| Rate of LWBS (%) | 5.16 | 5.42 | 5.97 | 6.86 | 7.74 | 9.46 | 12.70 | 15.71 |
Discussion
Our work contributes to evidence of the impact of increasing HIV testing rates on patient waiting and the rate of leaving without being seen in the ED. HIV testing rates vary widely among different EDs. In one ED, researchers found that 23% of ED patients agreed to HIV testing (Sankoff et al., 2012); in another ED with targeted HIV testing, testing rates were as high as 47% (Lyons et al., 2013). Although HIV testing programs have increased testing and diagnosis rates in some EDs (Haukoos et al., 2013; Schnall & Liu, 2014; Schnall et al., 2013, 2014), the effect of these pro- grams on patient-centered care, quality outcomes, and ED crowding is not well understood (Schnall & Liu, 2014). We demonstrated that when the HIV testing rate increases, waiting times in the ED may rise noticeably. In the study ED, we estimated that if the HIV testing rate were to increase from the baseline 5.57% to 50%, aver- age waiting time on the day shift would increase by 34%, from 29 to 39 minutes. In other EDs as well, patient ser- vice times and waiting times are likely to increase with an increase in HIV testing rates.
These results also suggest that the rate of leaving without being seen may increase as HIV testing rates increase, because patients who wait longer in the ED are more likely to leave without being seen (Shaikh, Jerrard, Witting, Winters, & Brodeur, 2012). Patients who seek ED care and leave without being seen may be unsatisfied with the service provided, and more importantly may face increased risk when serious conditions have not been assessed or treated (Kennedy, MacBean, Brand, Sundararajan, & Taylor, 2008).
The effect of screening must be carefully considered in the context of the overcrowding already present in many US EDs. The Institute of Medicine (2006) in its Report on the Future of Emergency Care (2006), described hospital EDs as at a breaking point. There have been significant increases in crowding across EDs nationwide, largely attributable to increased patient volume, escalating standards of care, an aging population, and limited primary care services in the community (Derlet & Richards, 2000). In addition to higher rates of leaving without being seen (Rowe et al., 2006), and longer lengths of ED stay (Gore- lick, Yen, & Yun, 2005), problems linked to ED crowding include transport delays (Schull, Morrison, Vermeulen, & Redelmeier, 2003), treatment delays (Fee, Weber, Maak, & Bacchetti, 2007), more frequent ambulance diversion (Burt, McCaig, & Valverde, 2006; Olshaker & Rathlev, 2006), patient elopement (Timm, Ho, & Luria, 2008), and financial impact to the hospital (Mitchell & Remmel, 1992). ED crowding also is associated with substandard patient care (Gorelick et al., 2005) and patient mortality (Sun et al., 2013). As a result, special consideration is necessary when implementing changes with potential to further strain a patient care environment that is already under stress.
At the same time, the ED is an important setting for efficient testing for HIV. The burden of HIV/AIDS is borne disproportionately by racial and ethnic minorities and those who are socioeconomically disadvantaged (Hall et al., 2008). Many persons in these groups are underinsured, have limited access to primary care, and use the ED as their sole source of medical care. Therefore, expanding HIV testing in these ED settings is especially important (Bernstein & Haukoos, 2008; Rothman, Lyons, & Haukoos, 2007).
Careful consideration of both the benefits and consequences of implementing mandatory HIV screening in the ED is needed. Before implementing HIV screening pro- grams, administrators should address ED overcrowding and long waiting times through the addition of personnel, referrals of non-urgent patients, and additional resources (Hoot & Aronsky, 2008); otherwise, a suboptimal screening rate may result. In one ED environment, HIV screening was offered to only 38% of those eligible when existing nursing staff were expected to conduct the screening (White, Scribner, Schulden, Branson, & Heffelfinger, 2009). Our study was conducted in an environment in which no additional resources were dedicated to the implementation of the NYS mandate to conduct HIV screening. As other EDs implement HIV testing, future researchers should evaluate the impact of strategies such as increased staffing on ED overcrowding, patient length of stay, and the rate of leaving without being seen.
Health care visit time has been affected by a dramatic increase in recommended screenings over the past decade. In addition to HIV, screening recommendations now include tests for alcohol abuse, depression, Hepatitis C, high blood pressure, colon cancer, lipid disorders, and obesity. The Affordable Care Act requires private health insurance plans to fully cover the costs of 45 recommended preventive services (The Henry J. Kaiser Family Foundation, 2014). Yet, little is known about the impact of including these screenings on provider workload and delays in the delivery of healthcare services.
The generalizability of these study results from a single urban ED is limited. The results may also be confounded by unmeasured differences between patients who agreed to be tested and those who did not. It is possible that time-stamped health visit record files may not be completely accurate. For example, a provider’s documentation that a patient was dis- charged may occur sometime after he/she was actually discharged. Nonetheless, this delay in documentation is unlikely because a new bed cannot be made available until the electronic health record shows that the patient has been dis- charged. Last, the lack of difference in length of stay for patients who received HIV tests and those who did not on the night shift may have occurred because the night shift had the smallest number of patient arrivals, decreasing the statistical power to detect a significant relationship.
Conclusions
Based on this descriptive analysis and modeling of data from one ED, waiting time and rates of leaving without being seen may increase when HIV testing rates increase in the ED. These increases depend on the magnitude of the actual HIV testing rate increase and may be small when the testing rate increase is small, but additional attention to this issue is warranted.
Given that current CDC guidelines recommend offering HIV tests in health care settings, it is likely that other states will replicate New York’s legislation. Policymakers must care- fully weigh the public health gains of HIV detection against the impact of added screening on the quality of emergency care and should consider dedicating additional resources to health care agencies to minimize negative impact. Health care administrators may wish to consider offering the HIV test at a time other than the end of a patient’s visit, so that length of stay may be less likely to be affected.
Acknowledgments
This publication was supported by the National Center for Advancing Translational Sciences, National Institutes of Health, through Grant Number KL2 TR000081, formerly the National Center for Research Resources, Grant Number KL2 RR024157. The content is solely the responsibility of the authors and does not necessarily represent the official views of the NIH.
Contributor Information
Nan Liu, Department of Health Policy and Management, Mailman School of Public Health Columbia University, New York, NY.
Patricia W. Stone, School of Nursing, Columbia University, New York, NY
Rebecca Schnall, School of Nursing, Columbia University, 560 West 168th Street, New York, NY 10032.
References
- Bernstein SL, & Haukoos JS (2008). Public health, prevention, and emergency medicine: a critical juxtaposition. Academic Emergency Medicine, 15, 190–193. doi: ACEM055[pii10.1111/j.1553-2712.2008.00055.x [DOI] [PubMed] [Google Scholar]
- Brewton J (1989). Teller staffing models. Financial Managers’ Statement, 11, 22–24. [Google Scholar]
- Brigandi AJ, Dargon DR, Sheehan MJ, & Spencer III T (1994). AT&T’s call processing simulator (CAPS) operational design for inbound call centers. Interfaces, 24, 6–28. [Google Scholar]
- Brusco MJ, Jacobs LW, Bongiorno RJ, Lyons DV, & Tang B (1995). Improving personnel scheduling at airline stations. Operations Research, 43, 741–751. doi: 10.1287/opre.43.5.741 [DOI] [Google Scholar]
- Burt CW, McCaig LF, & Valverde RH (2006). Analysis of ambulance transports and diversions among US emergency departments. Annals of Emergency Medicine, 47, 317–326. doi: 10.1016/j.annemergmed.2005.12.001 [DOI] [PubMed] [Google Scholar]
- CDC. (2015). HIV testing. Retrieved from http://www.cdc.gov/hiv/testing/
- Chelst KR, & Barlach Z (1981). Multiple unit dispatches in emer- gency services: Models to estimate system performance. Man- agement Science, 27, 1390–1409. [Google Scholar]
- Derlet RW, & Richards JR (2000). Overcrowding in the nation’s emergency departments: Complex causes and disturbing effects. Annals of Emergency Medicine, 35, 63–68. doi: S0196064400097729[pii] [DOI] [PubMed] [Google Scholar]
- Fee C, Weber EJ, Maak CA, & Bacchetti P (2007). Effect of emergency department crowding on time to antibiotics in patients admitted with community-acquired pneumonia. Annals of Emergency Medicine, 50, 501–509. e501. doi: 10.1016/j.annemergmed.2007.08.003 [DOI] [PubMed] [Google Scholar]
- Gorelick MH, Yen K, & Yun HJ (2005). The effect of in-room registration on emergency department length of stay. Annals of Emergency Medicine, 45, 128–133. doi: 10.1016/j.annemergmed.2004.08.041 [DOI] [PubMed] [Google Scholar]
- Gorunescu F, McClean SI, & Millard PH (2002). Using a queue- ing model to help plan bed allocation in a department of geriatric medicine. Health Care Management Science, 5, 307–312. [DOI] [PubMed] [Google Scholar]
- Green L (2006). Queueing analysis in healthcare In Hall RW (Ed.), Patient flow: Reducing delay in healthcare delivery. (pp. 281–308). New York, NY: Springer–Verlag. [Google Scholar]
- Green LV, Soares J, Giglio JF, & Green RA (2006). Using queueing theory to increase the effectiveness of emergency department provider staffing. Academic Emergency Medicine, 13, 61–68. doi: 10.1197/j.aem.2005.07.034 [DOI] [PubMed] [Google Scholar]
- Hall HI, Song R, Rhodes P, Prejean J, An Q, Lee LM,…Group HIVIS (2008). Estimation of HIV incidence in the United States. JAMA, 300, 520–529. doi: 10.1001/jama.300.5.520 [DOI] [PMC free article] [PubMed] [Google Scholar]
- Haukoos JS (2012). The impact of nontargeted HIV screening in emergency departments and the ongoing need for targeted strategies: Comment on “modest public health impact of nontargeted human immunodeficiency virus screening in 29 emergency departments”. Archives of Internal Medicine, 172, 20–22. doi: 10.1001/archinternmed.2011.538 [DOI] [PubMed] [Google Scholar]
- Haukoos JS, Hopkins E, Bender B, Sasson C, Al-Tayyib AA, & Thrun MW (2013). Comparison of enhanced targeted rapid HIV screening using the Denver HIV Risk Score to nontargeted rapid HIV screening in the emergency department. Annals of Emergency Medicine, 61, 353–361. doi: 10.1016/j.annemergmed.2012.10.031 [DOI] [PMC free article] [PubMed] [Google Scholar]
- Holloran T, & Byrn J (1986). United Airlines station manpower plan- ning system. Interfaces, 16, 39. doi: citeulike-article-id:990076 [Google Scholar]
- Hoot NR, & Aronsky D (2008). Systematic review of emergency department crowding: Causes, effects, and solutions. Annals of Emergency Medicine, 52, 126–136. e121. doi: 10.1016/j.annemergmed.2008.03.014 [DOI] [PMC free article] [PubMed] [Google Scholar]
- Institute of Medicine. (2006). Hospital-based emergency care: At the breaking point. Washington, DC: The National Academies Press. [Google Scholar]
- Kennedy M, MacBean CE, Brand C, Sundararajan V, & Taylor DM (2008). Review article: Leaving the emergency department without being seen. Emergency Medicine Australasia, 20, 306–313. doi: 10.1111/j.1742-6723.2008.01103.x [DOI] [PubMed] [Google Scholar]
- Kuchera D, & Rohleder TR (2011). Optimizing the patient trans- port function at Mayo Clinic. Quality Management in Healthcare, 20, 334–342. doi: 310.1097/QMH1090b1013e318231a318284f [DOI] [PubMed] [Google Scholar]
- Lyons MS, Lindsell CJ, Ruffner AH, Wayne DB, Hart KW, Sperling MI,…Fichtenbaum CJ (2013). Randomized comparison of universal and targeted HIV screening in the emergency department. Journal of Acquired Immune Deficiency Syn- drome, 64, 315–323. doi: 10.1097/QAI.0b013e3182a21611 [DOI] [PMC free article] [PubMed] [Google Scholar]
- McManus ML, Long MC, Cooper A, & Litvak E (2004). Queuing theory accurately models the need for critical care resources. Anesthesiology, 100, 1271–1276. [DOI] [PubMed] [Google Scholar]
- Mitchell TA, & Remmel RJ (2004). Level of uncompensated care delivered by emergency physicians in Florida. Annals of Emergency Medicine, 21, 1208–1214. doi: 10.1016/S0196-0644(05)81748-2 [DOI] [PubMed] [Google Scholar]
- New York City Department of Health and Mental Hygiene (2011). Reported HIV/AIDS diagnoses and deaths in 2011. HIV/AIDS annual surveillance statistics. Retrieved from http://www.nyc.gov/html/doh/html/data/hivtables.shtml
- New York State Department of Health. (2012). AIDS Institute. Retrieved from http://www.health.ny.gov/diseases/aids/testing/law/faqs.htm
- Olshaker JS, & Rathlev NK (2006). Emergency department overcrowding and ambulance diversion: The impact and potential solutions of extended boarding of admitted patients in the emergency department. The Journal of Emergency Medicine, 30, 351–356. doi: 10.1016/j.jemermed.2005.05.023 [DOI] [PubMed] [Google Scholar]
- Pierskalla W, & Brailer D (1994). Applications of operations research in health care delivery In Pollock SM, Rothkopf MH, Barnett A (Eds.), Handbooks in operations research & management science (pp. 469–505). New York, NY: Elsevier. [Google Scholar]
- Pitts SR, Pines JM, Handrigan MT, & Kellermann AL (2012). National trends in emergency department occupancy, 2001 to 2008: Effect of inpatient admissions versus emergency department practice intensity. Annals of Emergency Medicine, 60, 679–686. e673. doi: 10.1016/j.annemergmed.2012.05.014 [DOI] [PubMed] [Google Scholar]
- Rothman RE, Lyons MS, & Haukoos JS (2007). Uncovering HIV infection in the emergency department: a broader perspective. Academic Emergency Medicine, 14, 653–657. doi: 10.1197/j.aem.2007.04.004 [DOI] [PubMed] [Google Scholar]
- Rowe BH, Channan P, Bullard M, Blitz S, Saunders LD, Rosy- chuk RJ,…Holroyd B (2006). Characteristics of patients who leave emergency departments without being seen. Academic Emergency Medicine, 13, 848–852. doi: 10.1197/j.aem.2006.01.028 [DOI] [PubMed] [Google Scholar]
- Sankoff J, Hopkins E, Sasson C, Al-Tayyib A, Bender B, & Haukoos JS (2012). Payer status, race/ethnicity, and acceptance of free routine opt-out rapid HIV screening among emergency department patients. American Journal of Public Health, 102, 877–883. doi: 10.2105/AJPH2011.300508 [DOI] [PMC free article] [PubMed] [Google Scholar]
- Schnall R, & Liu N (2014). Timing matters: HIV testing rates in the emergency department. Nursing Research and Practice, 575130, 1–7. doi: 10.1155/2014/575130 [DOI] [PMC free article] [PubMed] [Google Scholar]
- Schnall R, Clark S, Olender S, & Sperling JD (2013a). Pro- viders’ perceptions of the factors influencing the implementation of the New York State Mandatory HIV Testing Law in two urban academic emergency departments. Academic Emergency Medi- cine, 20, 279–286. doi: 10.1111/acem.12084 [DOI] [PMC free article] [PubMed] [Google Scholar]
- Schnall R, Sperling JD, Liu N, Green RA, Clark S, & Vaw- drey DK (2013b). The effect of an electronic “hard-stop” alert on HIV testing rates in the emergency department. Studies in Health Technology and Informatics, 192, 432–436. [PMC free article] [PubMed] [Google Scholar]
- Schnall R, Liu N, Sperling J, Green R, Clark S, & Vawdrey D (2014). An electronic alert for HIV screening in the emergency department increases screening but not the diagnosis of HIV. Applied Clinical Informatics, 5, 299–312. doi: 10.4338/ACI-2013-09-RA-0075 [DOI] [PMC free article] [PubMed] [Google Scholar]
- Schull MJ, Morrison LJ, Vermeulen M, & Redelmeier DA (2003). Emergency department overcrowding and ambulance transport delays for patients with chest pain. Canadian Medical Association Journal, 168, 277–283. [PMC free article] [PubMed] [Google Scholar]
- Shaikh SB, Jerrard DA, Witting MD, Winters ME, & Bro- deur MN (2012). How long are patients willing to wait in the emergency department before leaving without being seen? West- ern Journal of Emergency Medicine, 13, 463–467. doi: 10.5811/westjem.2012.3.6895 [DOI] [PMC free article] [PubMed] [Google Scholar]
- Sonnenberg A (2000). Waiting lines in the endoscopy unit. Gastro- intestinal Endoscopy, 52, 517–524. [DOI] [PubMed] [Google Scholar]