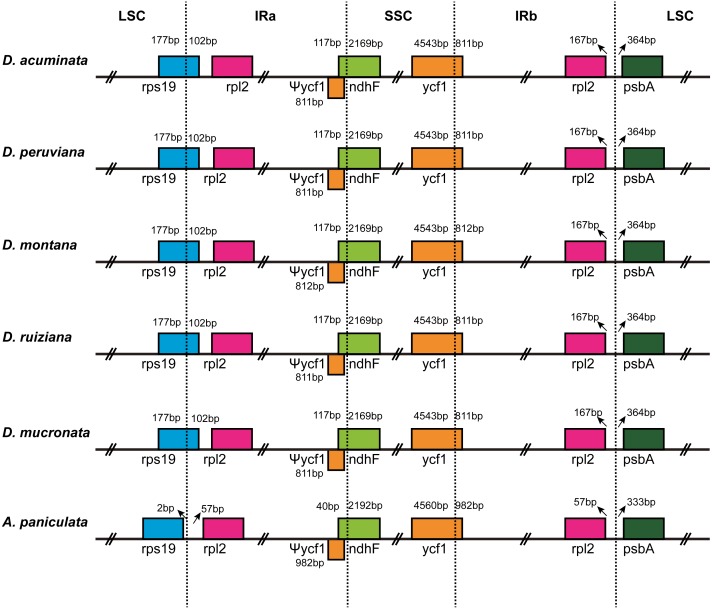
Figure 2. Comparison of the border regions of the LSC, SSC and IR among six Acanthaceae chloroplast genomes.
The IRb/SSC junction extended into the ycf1 genes creating various lengths of ycf1 pseudogenes (Ψycf1) among the six cp genomes. The number above, below or adjacent to genes shows the distance between the ends of genes and the boundary sites. The figure features are not to scale.

