

Abstract
Cellobiohydrolases effectively degrade cellulose and are of biotechnological interest because they can convert lignocellulosic biomass to fermentable sugars. Here, we implemented a fluorescence-based method for real-time measurements of complexation and decomplexation of the processive cellulase Cel7A and its insoluble substrate, cellulose. The method enabled detailed kinetic and thermodynamic analyses of ligand binding in a heterogeneous system. We studied WT Cel7A and several variants in which one or two of four highly conserved Trp residues in the binding tunnel had been replaced with Ala. WT Cel7A had on/off-rate constants of 1 × 10⁵ m−1 s−1 and 5 × 10⁻³ s−1, respectively, reflecting the slow dynamics of a solid, polymeric ligand. Especially the off-rate constant was many orders of magnitude lower than typical values for small, soluble ligands. Binding rate and strength both were typically lower for the Trp variants, but effects of the substitutions were moderate and sometimes negligible. Hence, we propose that lowering the activation barrier for complexation is not a major driving force for the high conservation of the Trp residues. Using so-called Φ-factor analysis, we analyzed the kinetic and thermodynamic results for the variants. The results of this analysis suggested a transition state for complexation and decomplexation in which the reducing end of the ligand is close to the tunnel entrance (near Trp-40), whereas the rest of the binding tunnel is empty. We propose that this structure defines the highest free-energy barrier of the overall catalytic cycle and hence governs the turnover rate of this industrially important enzyme.
Keywords: fluorescence, cellulase, complex, tryptophan, pre-steady-state kinetics, enzyme kinetics, thermodynamics, protein engineering, cellobiohydrolase, Transition state
Introduction
Cellobiohydrolases (EC 3.2.1.21 and EC 3.2.1.91) are among the most effective enzymes for the breakdown of cellulose. They are dominant in the secretome of many cellulose-degrading microorganisms and hence play a vital role in the natural carbon cycle. They are also of major technological interest because they make up the principle component in enzyme cocktails used for the conversion of lignocellulosic biomass to fermentable sugars. This industrial process (so-called saccharification) is critically important for the development of efficient biorefineries that produce fuels and chemicals from lignocellulosic feedstock. Reaching the desired goals for production of renewable fuels will involve an unprecedented consumption of industrial enzymes, and improved technical and scientific understanding of the saccharification process hence appears valuable. However, many mechanistic aspects of cellobiohydrolases remain poorly understood, and this is at least in part because these enzymes operate by a complex, processive mechanism.
In the current work, we address the kinetics and thermodynamics of substrate complexation and decomplexation of the cellobiohydrolase, Cel7A, from the cellulolytic fungus Trichoderma reesei. These two steps appear to be particularly important, because they have alternately been proposed to be rate-limiting for the overall reaction (see Ref. 1 for a recent review). Focus on the on and off rates of Cel7A has been accentuated by the observation that covalent transitions associated with the actual bond cleavage proceed quite rapidly. Thus, the sequence of events (sometimes called the inner catalytic cycle; step 3 in Fig. 1A), which includes breaking of one β-1,4-glycosidic bond, expulsion of product (cellobiose), and one processive step forward, occurs at a rate of ∼5 s−1 at room temperature (2). However, the maximal turnover of Cel7A, Vmax/E0, is much lower at ∼0.1–0.3 s−1 (3, 4), and this clearly suggests the existence of slow (noncovalent) transitions outside the inner catalytic cycle. Slow complexation, for example, appears likely as the process involves “threading” of at least nine pyranose moieties into the tunnel-shaped binding area of the enzyme (Fig. 1). This process could well be associated with a high activation energy because the piece cellulose strand must be pulled out of a bound state in the cellulose particle before it can engage in favorable interactions with the enzyme (5). Conversely, some studies have ascribed low turnover to a particularly slow rate of decomplexation and a concomitant accumulation of inactive enzyme on the substrate surface (4, 6). These interpretations of either on- or off-rate limitation of Cel7A may appear discordant, but they could also reflect that the rate-limiting step changes with experimental conditions such as temperature or substrate load (7, 8). In any event, more insights into the binding and unbinding of a cellulose strand in Cel7A will be required to understand the mechanism of this enzyme. In particular, it would be rewarding to gain insights into the nature of the transition state for the processes of substrate complexation and decomplexation, because these structures may govern the overall reaction rate under most conditions.
Figure 1.

A, a simplified illustration of the reaction mechanism of Cel7A. B, the enlargement shows the structure of the bound cellononaose ligand (green/red sticks) and the locations of the four conserved Trp residues. The numbers in the enlargement identify the subsites; the scissile bond is between subsites +1 and −1 (Protein Data Bank code 4C4C).
The structural element that has received most interest regarding threading and substrate binding for Cel7A is four highly conserved Trp residues placed along the binding tunnel (9, 10) as shown in Fig. 1B. They have all been shown to interact with the ligand (11), and two of them, Trp-38 and Trp-40, are located in “relaxed subsites” (11) (subsites number −7 and −4) quite far from the catalytic residues, where the ligand is in an extended conformation. The third, Trp-367, is in a “twisting subsite” (11) (subsite −2), where it helps to flip the chain and hence expose the scissile bond for nucleophilic attack, and the last, Trp-376, is in a “product subsite” (subsite +1) in which the product is transiently located after hydrolysis of the glycosidic bond. Different functional roles of these Trp residues in Cel7A and other cellulases have been discussed extensively (reviewed in Ref. 9), and in the current work, we address this through quantitative kinetic data. Specifically, we have implemented a continuous fluorescence method by which complexation of Cel7A and insoluble cellulose can be monitored after a dead time of a few hundred ms. We have used this method to study the dynamics of complex formation for both Cel7A and a number of enzyme variants in which one or two of the Trp residues had been replaced with Ala. The results elucidated both WT ligand binding and the roles of the four Trp residues for the rate and strength of complexation. Finally, the data allowed so-called Φ-factor analysis to elucidate the nature of the transition state in the complexation/decomplexation steps.
Results
Titration experiments
The fluorescence emission at 328 nm increased distinctly when WT Cel7A bound its insoluble substrate (Fig. S1). For the W376A/W38A mutant, the change was much less pronounced (∼15% of the change for Cel7AWT), and the other enzymes in Table 1 showed changes between these two values. In general, the changes were large enough to be readily measurable and probably reflect dequenching because water molecules are removed from the indole side chains of Trp residues (12) during ligand binding. It follows that the populations of free and bound enzyme can be estimated by a linear combination of the fluorescence signals from enzyme solutions with respectively no substrate and saturating substrate loads. Under this interpretation, the fluorescence method distinguishes between free enzyme (E) and enzyme in complex with substrate (ES), whereas it is blind to activity and (uncomplexed) adsorption (i.e. step 1 in Fig. 1A). In light of this, we will interpret the current data along the lines of a simple binding model (Scheme 1).
Table 1.
Parameters from titration and time-course experiments
| Titration experiments |
Real-time experiments (masskon) | Derived parameter |
||||
|---|---|---|---|---|---|---|
| Enzyme | Signala | KP | Γmax | molarkon × 106 | koff × 10−3 | |
| % | liter/g | μmol/g | liter/g s−1 | m−1 s−1 | s−1 | |
| WT | 100 ± 2 | 122 ± 33 | 6.4 ± 0.6 | 0.59 ± 0.01 | 0.093 ± 0.009 | 4.8 ± 1.3 |
| E212Q | 109 ± 3 | 63 ± 12 | 6.6 ± 0.7 | 0.63 ± 0.03 | 0.094 ± 0.011 | 9.9 ± 2.0 |
| CD | 92 ± 5 | 55 ± 25 | 2.0 ± 0.2 | 0.33 ± 0.02 | 0.163 ± 0.016 | 5.9 ± 2.8 |
| W38A | 26 ± 2 | 25 ± 12 | 2.6 ± 0.7 | 0.41 ± 0.06 | 0.157 ± 0.046 | 16.6 ± 8.1 |
| W40A | 72 ± 3 | 42 ± 13 | 4.2 ± 0.6 | 0.39 ± 0.01 | 0.094 ± 0.013 | 9.4 ± 3.0 |
| W367A | 80 ± 2 | 53 ± 8 | 7.0 ± 0.6 | 0.59 ± 0.05 | 0.085 ± 0.010 | 11.1 ± 1.8 |
| W376A | 53 ± 1 | 193 ± 57 | 9.0 ± 0.9 | 0.43 ± 0.06 | 0.048 ± 0.008 | 2.2 ± 0.7 |
| W367A/W376A | 46 ± 1 | 99 ± 22 | 9.5 ± 1.4 | 0.26 ± 0.01 | 0.027 ± 0.004 | 2.6 ± 0.6 |
| W38A/W376A | 15 ± 1 | 62 ± 28 | 7.2 ± 1.9 | 0.23 ± 0.02 | 0.032 ± 0.009 | 3.7 ± 1.7 |
a Fmax/Fmax_WT × 100.
We note that Scheme 1 assumes binding equilibrium, and this criterion has previously been confirmed for short experiments with the current systems (13).
The fraction of enzyme molecules that are engaged in a complex, θ, may be determined from as,
| (Eq. 1) |
where E0 is the total enzyme concentration, Fmax is the increment in the fluorescence signal at saturation (measured at high substrate loads where E0 = ∼[ES]), and Fx is the increment in signal in a titration experiment with a given cellulose load (Fig. S1). Because the signals in the titration experiments were allowed to become constant, we assume that θ represents the equilibrium distribution. However, the equilibrium constant for Scheme 1 is not straightforward to define because the substrate load, S, is in mass units (the accessible molar concentration of sites at the surface of the insoluble substrate is unknown). To address this, we introduce a parameter, Γ, which specifies the density of sites on the substrate surface (in mol/(g cellulose)), to which the enzyme can bind and form the ES complex (sometimes called an attack site). The total (molar) concentration of attack sites is then S0*Γ, where S0* is the (known) initial cellulose load in g/liter. We may then write the following mass balance,
| (Eq. 2) |
where [S] is the (molar) concentration of unoccupied attack sites. The overall strength of cellulase binding can be described by the so-called partition coefficient, KP (14), which may be expressed as follows.
| (Eq. 3) |
In Equation 3, Kd is the usual dissociation constant (Kd = [E][S]/[ES]) for Scheme 1). The partitioning coefficient takes into account both intrinsic binding strength and the availability of sites and hence provides a weighted affinity parameter. This is an important property because distinctly different Γ values among cellulases (15, 16) tend to decouple Kd and the overall binding capacity. For this reason, we will use KP in discussions of the relative binding strength of the investigated variants. We note, however, that according to Equation 3, KP can be readily converted to a dissociation constant (in units of m−1), Kd = KP/Γ. This latter parameter carries larger uncertainty because it requires conversion to molar substrate concentration, and it is hence subject to error propagation through division of two parameters from the regression analysis (Γ and Kp). However, it is useful to use Kd in comparisons with other studies that reports affinity through the dissociation constant.
To derive experimental values of KP and Γ from the titration measurements, we combine Equations 1–3. This yields.
| (Eq. 4) |
Solving the quadratic Equation 4 for θ and combining with Equation 1 gives the following.
| (Eq. 5) |
| (Eq. 6) |
Equations 5 and 6, which show a standard relationship for ligand binding (17), were implemented in a nonlinear regression routine (Origin 2018b; OriginLab, Wellesley Hills, MA) and used to derive maximum likelihood values for KP, Γ, and Fmax. We consistently found that Equations 5 and 6 accounted well for the experimental data, and examples of measurements and regression results are shown in Fig. 2 (a schematic representation of how the raw data from the titration experiments were converted into binding curves can be found in Fig. S2). The parameters (Kp, Γ, and Fmax) for all investigated enzymes are listed in Table 1. Note that Fmax is reported as the ratio (in %) of variant and Cel7AWT.
Figure 2.

Examples of binding curves obtained from the titration experiments. Each point represents the apparent equilibrium fluorescence emission (in arbitrary units) at a given load of amorphous cellulose (RAC). The data are shown for the WT Cel7A and the W40A mutant at starting concentrations of 250 nm enzyme. The lines show the best fits of Equations 5 and 6 to the experimental data.
Time-course experiments
Fig. 3 shows representative examples of the real-time data for ligand binding; the results for other enzymes may be found in Fig. S3. We used 250 nm enzyme, and at t = 0, we added enough regenerated amorphous cellulose (RAC)3 suspension (always 100 μl) to reach the total substrate load listed in the legend of Fig. 3. To analyze the data, we first assessed the instrument dead time in control experiments with a nonbinding protein. As detailed in Fig. S4, effects of mixing tapered off with a half-time of 150 ms and became undetectable (compared with the experimental scatter) after ∼0.5 s. Hence, we discarded data points for t < 0.5 s for all runs. The results could be described by a single exponential function of the type Fx(t) = Feq(1 − e−kt), where Fx(t) is the real-time fluorescence signal, and Feq is the equilibrium value specified by the plateau level for each RAC load as illustrated in Fig. 3. In some cases, a slight improvement of the variance of the fits could be gained by using the sum of two exponential terms. We did not associate any theoretical meaning with the exponential fitting parameters but used them as a practical way to find the initial slope of the fluorescence traces as the mathematical derivative for t → 0. Combining with Equation 1 and Fmax from the titration experiments (Table 1), we converted slopes for t → 0 to the initial rate of complex formation, von, in units m/s. We plotted von as a function of the RAC load as exemplified in Fig. 4. These plots consistently showed that von scaled proportionally to the RAC load and hence confirmed that the reaction was first order with respect to the substrate at least in the concentration range studied here.
Figure 3.

Real-time fluorescence data for the complexation of RAC and, respectively, the Cel7A WT and the W40A mutant (250 nm enzyme). The ordinate, θ, shows the fraction of enzyme molecules in an ES complex (c.f. Equation 1). Analogous data for the other enzymes are shown in Fig. S3. The black lines represent the best fit to an exponential function.
Figure 4.

Initial rate of complexation, von, derived from Fig. 3 and plotted as a function of the RAC load for two enzymes, Cel7AWT and W40A. The observed proportionality supports the interpretation that the complexation is first order with respect to the load of cellulose, and the slope signifies the parameter masskonE0 (see main text).
According to Scheme 1, the initial on rate may be expressed as von = konS0E0, and it follows that the slope, α, of the lines in Fig. 4 is α = konE0. We used α values from Fig. 4 and (known) E0 to calculate the kon values listed in Table 1. On-rate constants determined in this way are in the somewhat unusual (mass-based) units of (g/liter)−1 s−1, and to emphasize this, we will henceforth use the symbol masskon for this parameter. However, because we know the density of attack sites on the substrate (Γ in μmol/g cellulose) from the titration experiments, we may convert masskon to an on-rate constant, molarkon, in the usual units of m−1 s−1 (molarkon = masskon/Γ). This value is also listed in Table 1. Finally, combination of Equation 3 and the general relation between Kd and rate constants, Kd = koff/molarkon, allows us to determine the off-rate constant, koff = masskon/KP. We note in passing that all parameters could have been derived from the time-course measurements without conducting titration measurements at all. However, we found that the experimental scatter was lessened by making separate titration experiments with repeated additions of RAC to the same enzyme sample, and we hence preferred this procedure.
Cellulase kinetics is known to depend on the physical properties of the substrate, and to investigate this aspect we attempted to repeat the above experiments on bacterial microcrystalline cellulose (BMCC), which is mainly crystalline. Unfortunately, excessive light scattering from BMCC limited this work to fairly low loads of cellulose (i.e. far from saturation with superimposed curves at increasing loads as in Fig. 3). This prevented systematic analysis, but raw data for Cel7A WT at low BMCC loads suggested kinetics comparable with that observed on RAC (Fig. S5). In fact, the movement toward equilibrium was slightly faster (half-time of ∼5 s) on this more crystalline substrate.
Discussion
Cellulases and other enzymes that attack solids must break interactions in the substrate surface before a complex can be formed, and this “excavation” of the ligand is likely to be important for the energy landscape of heterogeneous enzyme reactions. Heterogeneous reactions are widespread both in vivo and in technical enzyme applications (18–22), and insights into the thermodynamics and kinetics of ligand binding appear particularly important for mechanistic understanding. Earlier works on this topic for cellulases have mostly reported adsorption data derived from assays that distinguish respectively bulk- and surface-adsorbed enzymes. The results from this type of work have provided quite consistent conclusions regarding the strength of binding (see below), but the picture has been less clear with respect to dynamics. Some works have found that Cel7A and other cellulases build up quite slowly on the substrate surface, with apparent adsorption equilibrium established after tens of minutes (23–27). Others have reported a faster process, which leveled off toward a constant adsorbed population within seconds or tens of seconds (28, 29). Recently, more detailed insights have emerged from single-molecule imaging methods (24, 30–33). This work has elucidated key parameters such as the rate of movement and residence times of enzymes on the substrate, although on- and off-rate constants derived in different studies have been quite divergent (24, 30, 31, 33). Other studies have used specialized biochemical assays, which enables distinction between cellulases that are either free in solution, complexed with substrate, or surface-adsorbed with empty binding tunnel (i.e. not complexed; Fig. 1) (29, 34–36). This type of work has elucidated the population of these three states and the dynamics of their interconversion, but the necessary assays are very labor-intensive and hence not apt for comparative investigations. In the current work, we address the complexation and decomplexation of Cel7A through a new fluorescence-based method that monitors ligand binding in real time. The observed changes in fluorescence signal occur because the ligand causes dequenching of Trp residues, when it enters the binding tunnel, and the method hence distinguishes threaded enzyme from apoenzyme, whereas it is insensitive to whether the enzyme is adsorbed with empty binding tunnel or free in the bulk. We argue that this makes it particularly useful in studies of complexation dynamics. We first focus on the rate of threading of Cel7AWT and subsequently discuss the roles of the conserved Trp residues and the possible structure of the transition state for the complexation step.
Wildtype Cel7A and variants with native Trp pattern
The partitioning coefficient, KP, for Cel7AWT was 122 ± 33 liters/g (Table 1), which corresponds to a dissociation constant, Kd = KP/Γ of ∼52 nm. This binding strength falls in the same range as earlier reports on Cel7A (14, 27, 36–38). Affinity data from these and other references are listed in Table S1. This table shows that earlier work with submicromolar enzyme concentrations (like the current work) found Kd values in the low nanomolar range in accordance with the results reported here. Experiments with tens or hundreds of micromolar enzyme, on the other hand, indicate much weaker binding (Kd in the micromolar range). This difference probably reflects heterogeneity of the binding sites and thus a tendency to detect weaker, unproductive binding at higher concentrations (37, 39). The value for the attack site density on amorphous cellulose (Γ = 6.4 ± 0.6 μmol attack sites per gram of RAC; Table 1) is in excellent accordance with earlier adsorption studies and biochemical assessments of productive binding capacities (13, 40). Thus, results from the titration experiments generally supported the validity of the approach and interpretation based on Scheme 1. This simplified interpretation is in line with the argument that the method only differentiates complexed and uncomplexed states and further supported by the observation that the WT and the E212Q variant have almost the same on/off-rate constants (Table 1). Thus, the E212Q variant is practically inactive on insoluble cellulose (41) and hence formally meets the premises of Scheme 1.
The off-rate constant for WT Cel7A was 0.0048 ± 0.0013 s−1 (Table 1), and this corresponds to a mean ES lifetime (1/koff) of ∼200 s. This number is in good agreement with recent measurements of Cel7A residence times based on single-molecule fluorescence imaging, and it is also in line with biochemical data (4, 33). The low koff value has the important corollary that slow dissociation governs the reaction rate at saturation (4, 28), and as a result, the maximal turnover number may be approximated Vmax/E0 = ∼nkoff (42), where n is the average processivity number. Earlier work has suggested that n = ∼15–20 for Cel7A acting on RAC (42–45), and multiplying this value by koff from Table 1 predicts a maximal turnover of ∼0.1 s−1. This matches Vmax/E0 values measured directly in biochemical assays (3, 4), and this prediction of the maximal turnover from the current ligand-binding studies (without any activity measurements) further supports applicability of the method. The on-rate constant for Cel7AWT determined from the initial slope in Fig. 3 was 0.59 ± 0.01 (g/liter)−1 s−1 (Table 1). As seen directly in Fig. 3, this corresponds to a rather swift complexation process, which moves toward equilibrium with a half-time of ∼10 s under the conditions studied here. As argued above, the mass-based on-rate constants (masskon) in Table 1 can readily be converted to molarkon in the conventional units of m−1 s−1. The values of molarkon calculated in this way are also listed in Table 1. We posit that the rate of complexation scales with the molar concentrations of enzyme and attack sites like a normal bimolecular rate constant and hence that it could be meaningful to compare it with on-rate constants for other enzyme reaction. Typical values for on-rate constants fall in the (1–50) × 106 m−1 s−1 range for enzymes binding small, soluble ligands such as amino acids, nucleotides, small metabolites, or hydrogen peroxide (46). The current molarkon for Cel7A was 0.1 × 10⁶ m−1 s−1 (Table 1), and thus, 1–2 orders of magnitude slower than typical values for small-molecule ligands. This slower complexation probably reflects energy barriers associated with the polymeric nature of the ligand and its binding to the surface prior to complexation, but we note that the difference in on-rate constants for solid cellulose and soluble ligands is not exceptionally large. This obviously suggests that Cel7A has developed an effective stabilization of the transition state for complexation, and we return to this below. We may also compare the off-rate constant in Table 1 with typical values for small, soluble ligands. This comparison suggests that Cel7A is far more atypical with respect to decomplexation, because typical off-rate constants for small ligands are in the 103–104 s−1 range (46) and hence larger than koff for Cel7A by some 6 orders of magnitude. Overall, these numbers illustrate the slow complexation/decomplexation dynamics of Cel7A, and the uncommonly low value of koff underscores that Cel7A binds its substrate more tightly than average enzymes (as Kd = koff/molarkon). This latter point is confirmed by comparing the standard free energy of binding for Cel7AWT, ΔG° = RTlnKd = ∼−42 kJ/mol, with values in a recent meta-analysis of literature data for hydrolases acting on soluble substrates (47). Thus, only a few percent of the hydrolases bound their cognate substrate as strongly as Cel7AWT, and the average ΔG° was approximately −20 kJ/mol.
Trp variants and Φ-factor analysis
Tryptophan residues play a key role as driver of protein–carbohydrate interactions. This is reflected, for example, in a distinct overrepresentation of Trp in contact regions of noncovalently bound carbohydrates in protein crystal structures (48). This special role of the indole side chain of Trp for carbohydrate binding is also evident in Cel7A, which has four Trp residues along the substrate-binding tunnel (11, 49) as illustrated in Fig. 1. Functional roles of these Trp residues in Cel7A and analogous Trp residues in other processive glycoside hydrolases have been widely discussed, and several mutational studies have highlighted their importance for e.g. ligand-binding strength, initial threading, processivity number, and processive sliding (10, 32, 50–57). We first notice that the maximal change in fluorescence emission, Fmax, differed markedly among the investigated enzymes (Table 1 and Fig. S1). The WT and variants with a native Trp pattern (i.e. E212Q and catalytic domain (CD)) all showed approximately the same Fmax, whereas the Trp variants had smaller changes. This is in line with the interpretation that the fluorescence changes represent dequenching of these Trp residues. The most conspicuous effect was in the two variants that included the W38A mutation. In these cases, Fmax was reduced to respectively 15% (W38A/W376A) and 26% (W38A) of the WT value (Table 1), and this suggested that Trp-38 makes a particularly large contribution to measured Fmax values in Cel7AWT. This may reflect a particularly strong dehydration of Trp-38 upon ligand binding, and this interpretation was confirmed by MD simulations as described in Fig. S6. Thus, in the complex, no water was found within 5 Å of the center of mass of Trp-38, whereas the other three Trp residues showed some residual hydration with 1–3 water molecules within this cutoff (Fig. S6).
Although the parameters in Table 1 generally revealed a role of the Trp residues for the thermodynamics and kinetics of ligand binding, the observed effects were moderate, and this is in contrast to some earlier suggestions on the roles of these residues. In particular, the on-rate constants, masskon, were quite similar and fell within 30% of the WT for all Trp point mutants. We note that masskon is a robust, model-free, parameter and that the low sensitivity of the on rate to Trp point mutations appeared directly from the initial slopes of the raw data in Fig. 3 and Fig. S3. Variants with two Trp replacements showed some reduction in the rate of complexation, but again the changes were not dramatic, and the drop in masskon for both W367A/W376A and W38A/W376A was less than 3-fold compared with Cel7AWT. We conclude that at least on amorphous cellulose, one Trp residue can be replaced with limited effect on the threading rate of Cel7A. Even two replacements resulted in on rates of the same order of magnitude, and this suggests that maintaining a high on rate is not the major evolutionary driving force for the conservation of Trp in the binding tunnel of Cel7A. Binding affinity of the Trp point mutants was similar or moderately lowered compared with the WT. The relative ligand affinity was Cel7AWT ∼ W376A > W367A ∼ W40A > W38A. The difference in standard free energy of binding, ΔΔG°, between the boundaries in this sequence (i.e. between W38A and the WT) was ∼4 kJ/mol. This ΔΔG° is in line with an earlier kinetic investigation of these two enzymes (53). For the variants W367A and W40A, the free energy of ligand binding was ∼2 kJ/mol, higher than the WT, thus signifying weak favorable interactions from the Trp residues in these positions.
The results in Table 1 lists both rate constants and ligand affinities for variants with mutations in different regions of the binding area, and this opens for the application of so-called Φ-factor analysis to elucidate the transition state (TS) of the complexation/decomplexation reactions. This approach has been successfully used in protein folding studies, and the basic idea is to compare changes in respectively binding and activation energy. Principles and practices of the approach have been lucidly discussed elsewhere (58, 59) and will not be reiterated here, except for some key aspects of the current application, which are sketched out in Fig. 5. For the present data, we may define Φ as follows.
| (Eq. 7) |
If we first insert on-rate constants for different mutants in Equation 7, we obtain Φ-factors for complexation, Φon. A Φon value of ∼1 for a given point mutation suggests that ligand interactions at this position are established before the TS (the mutation affects the free energy of ES and ES≠ equally; Fig. 5B). Conversely, if ligand interactions are established in the downhill part of the energy diagram after the TS, the Φon value will be at ∼0 (only ES is affected; Fig. 5C). The analogous values for decomplexation (i.e. going from right to left in Fig. 5, B and C) are Φoff = 0 and Φoff = −1, respectively. We plotted the Φ-factors derived by Equation 7 from the data in Table 1 in the histogram in Fig. 5A. In this figure, the columns are organized according to the position of the mutation along the binding tunnel, and the horizontal axis hence represents the reaction coordinate of the essentially one-dimensional threading process (the ligand enters the tunnel opening near the CBM and Trp-40 and gradually moves forward to fill the tunnel). Although Φ-factors are usually calculated for point mutations, we include the CD variant in this analysis as the CD is a distinct domain separated by a linker (the CD retains its native structure without the CBM (11)). As other Φ-factor analyses (60), interpretation of Fig. 5A was challenged by experimental errors, but we see that Φon is ∼1 for the CD variant, attains an intermediate for W40A, and is close to 0 for the next three Trp residues. This suggests that the transition state for ligand binding occurs early in the threading process at a stage where the CBM is interacting with the substrate and the cellulose reducing end makes contact with Trp-40 at the tunnel entrance. This implies that upon further forward movement, favorable enzyme–ligand interactions in the tunnel compensate the work required to release more glucose moieties from the cellulose surface and hence makes this part of the complexation process thermodynamically downhill. This interpretation is supported by analyzing Φoff values derived from the decomplexation rate constants (Table 1). Thus, Φoff for residues near the middle or exit of the tunnel (Trp-376, Trp-367, Glu-212, and Trp-38) were approximately −1 (Fig. 5A), suggesting that the TS of decomplexation occurs after ligand interaction of these residues have been broken. W40A has an intermediate value, whereas the CBM-less variant (CD) has Φoff near 0, and this again points toward a TS with the reducing end near the tunnel entry and Trp-40.
Figure 5.

Φ-factor analysis. A shows experimental Φ-factors for complexation (Φon) and decomplexation (Φoff). The cartoon above the histogram indicates the location of the investigated mutations. B and C illustrate the interpretation of Φ-factors on the basis of two hypothetical transition states for the complexation process. In B, the TS is late in the process just before the ligand fully fills the tunnel, whereas in C, it is early in the complexation process. If we mutate a residue located at the yellow star, which interacts with the ligand, the energy landscape changes differently in the two cases (dashed lines). Thus, in B the free energies of the bound state (ES) and the TS (ES≠) will shift in parallel because the mutated residue interacts with the ligand in both states, and this yields Φon = 1. Conversely, in C, only ES (and not ES≠) will be affected by the mutation, and Φon will be 0. This difference allowed us to assess whether a given mutation was located before or after the reaction coordinate of the TS. An analogous analysis may be conducted for decomplexation. In this case, the Φoff-factors that indicate whether the mutation is before or after the TS are 0 and −1, respectively.
Fig. 6 provides a structural interpretation of results from the Φ-factor analysis. We stress that this is a coarse representation and that other structures could be in accord with the data, but the figure serves to illustrate that the TS has several glucose moieties broken away from the cellulose surface. However, the TS does not involve ligand interactions at the middle of the tunnel or near the catalytic residues. This observation of a TS (in both directions) with limited ligand penetration was also proposed in an enzyme kinetic study (61), and it is interesting to note that ligand interactions with Trp-40, which are established around the TS in Fig. 6, have been highlighted for their role in Cel7A efficacy in different earlier works (10, 32, 44, 62). The unfavorable free energy of the structure in Fig. 6 relies on a balance between attractive ligand interactions in the cellulose surface layer and the enzyme complex, respectively. Strong interactions in the complex are illustrated by the large binding free energy found here (ΔG° = ∼−42 kJ/mol) and elsewhere (14, 27, 36–38), but for the complex to form, several pyranose moieties must be dislodged from a bound state in the solid surface.
Figure 6.
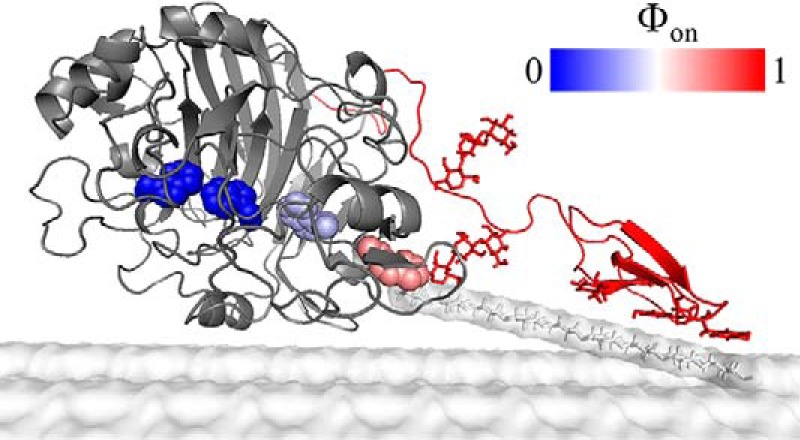
Structural interpretation of the Φ-factor analysis. The transition state of complexation and decomplexation of Cel7A is proposed to occur at a stage in which the reducing end is near Trp-40, whereas the rest of the tunnel is empty. The unfavorable free energy of this structure arises from the (uncompensated) detachment of several glucose moieties from the cellulose surface. At a higher reaction coordinate of the complexation process (when the tunnel fills), compensating ligand interactions occur in the tunnel and hence lower the free energy. At a lower reaction coordinate, the free energy becomes more favorable as the ligand interacts with the cellulose surface.
The current results suggest that before the reducing end reaches Trp-40, it is favorable for the cellulose strand to flick back to a bound state on the cellulose surface. However, when the reducing end has passed Trp-40, it is thermodynamically downhill to proceed forward and establish enzyme–ligand interactions.
To address this interpretation quantitatively, one may (as a first approximation) estimate the free energy of this TS by inserting molarkon in the Eyring equation (although this approach may be questionable for a diffusive process like complexation). Doing so suggests an activation free energy of ∼45 kJ/mol, and it is interesting to compare this with computational estimates of the work required to pull off cellooligosaccharides from the surface of crystalline cellulose. This work is in the range of 12–18 kJ/(mol glucose moieties) (5, 63), and these numbers suggest that the activation free energy of complexation corresponds to pulling off 3–4 glucose moieties. Although this is only a very coarse estimate, this stretch of cellulose strand seems to be in a realistic order of magnitude
Conclusions
The intrinsic fluorescence of Cel7A has previously been shown to change distinctively upon ligand binding (64, 65). Based on this, we have implemented a novel, real-time method and a simple kinetic analysis, which provides on and off rates for Cel7A on its insoluble substrate. The approach appears robust and derives on rates directly from initial slopes of raw progress curves, independent of models or regression analyses. The setup used a stirred cuvette, hence obviating potential problems of handling insoluble particles in stopped-flow systems, for example. The setup had subsecond dead time, and that was sufficient to monitor essentially the full complexation process in real time. We envision that the method could be broadly applicable to cellulases and other glycosyl hydrolases because changes in tryptophan fluorescence are quite common for these enzymes (66). We found that complexation occurred fairly rapidly with an on-rate constant of the WT of 0.59 (g/liter)−1 s−1. Taking the density of attack sites on RAC into account, this on-rate constant corresponded to ∼0.1 × 10⁶ m−1 s−1, and this is only moderately slower than typical on-rate constants for enzymes and small, soluble substrates. The off-rate constant was 0.0048 s−1, and this is similar to some values reported earlier for Cel7A and many orders of magnitude slower than typical off rates for soluble substrates. The roles of the four highly conserved Trp residues in the binding tunnel were elucidated through the characterization of several mutants. We found that these Trp residues promoted the strength and rate of complexation, but the contributions were low or moderate, and we propose that their high conservation must rely on other functional factors than rapid complexation. Finally, we used the kinetic and thermodynamic data for the mutants in a so-called Φ-factor analysis, which suggested that the transition state for the on/off step occurred when the reducing end of the ligand reached the tunnel entrance near Trp-40, and the remainder of the tunnel was empty. Because earlier work has suggested that complexation or decomplexation (rather than the chemical changes associated with bond breakage) govern the maximal turnover of Cel7A, we propose that a structure akin to the one in Fig. 6 underlies the apex of the complex free energy landscape of this enzyme.
Experimental procedures
Enzymes, substrate, and buffer
The cellobiohydrolase Cel7A form T. reesei and a number of Cel7A variants specified below were expressed in Aspergillus oryzae as detailed elsewhere (67). The enzymes were purified from fermentation broth, validated to show a single band on NuPAGE 4–12% Bis-Tris SDS-PAGE, and quantified by UV absorption as described previously (8). We expressed and purified nine enzymes for this work. In addition to the WT (denoted Cel7AWT), we made six enzymes with variations in the pattern of Trp residues shown in Fig. 1. Specifically, we made four mutants in which each of the Trp residues had been replaced with Ala (W38A, W40A, W367A, and W376A) and two mutants with two replacements of Trp (W367A/W376A and W38A/W376A). Finally, we expressed the CD form Cel7A (i.e. a variant with truncated linker and carbohydrate binding module, CBM) and a point mutant in which the catalytic nucleophile, Glu-212, had been replaced with Gln. This latter variant, E212Q, has previously been shown to retain WT-like structure while being essentially inactive on insoluble cellulose (41). The substrates were RAC and BMCC, and both were prepared by standard methods (68). The load of cellulose in the stocks was determined as dry matter content. All experiments were conducted in 50 mm sodium acetate buffer, pH 5, referred to as standard buffer.
Fluorescence spectroscopy
Fluorescence measurements were conducted in a Jasco FP-8200 spectrofluorometer equipped with a custom-made injection inlet directly to the cuvette, as well as a standard thermostat and magnetic stirrer (Jasco STR-811). The experimental temperature was 20 °C. All measurements relied on changes in the emission spectrum, when Cel7A binds the ligand, and to assess this, we initially recorded full spectra (310–500 nm) for all investigated enzymes at several (typically 10) different loads of RAC. We used an excitation wavelength of 295 nm, which primarily probes Trp residues (12). In accordance with earlier reports on Cel7A, (64, 65), the emission spectra (see supporting information) showed blue shift and increased intensity upon ligand binding. The changes were particularly pronounced ∼328 nm (Fig. S1), and we used this wavelength in all subsequent measurements. The strength of ligand binding was assessed from titration measurements. In these trials, 2 ml of enzyme dissolved in pure standard buffer was initially transferred to a stirred 1 × 1-cm quartz cuvette. Subsequently, the enzyme solution was successively titrated with 10–20 aliquots of RAC suspension until we did not observe further changes in the signal (typically at a total RAC load of 0.2–0.4 g/liters). After each RAC addition, we waited for the fluorescence signal to reach a constant value (i.e. apparent binding equilibrium) and then measured the average emission over 20 s. These titration trials were conducted for all variants at two enzyme concentrations (0.25 and 0.50 μm) and used to derive binding constants and binding site densities as described below. The rate of ligand–enzyme binding was investigated in real-time in a separate series of time-course experiments. In this case, the fluorescence from 2 ml of 0.25 μm enzyme solution with vigorous stirring was monitored continuously. When the signal was stable, one 100-μl aliquot of cellulose suspension was added quickly from a syringe, and the changes in fluorescence were recorded (10 data points/s) over ∼500 s. The experiment was repeated (with a fresh enzyme solution) for ∼10 different RAC loads for each enzyme variant so that the kinetics of binding was monitored for RAC loads between 0.005 and 0.3 g/liter (the concentration of the injected RAC aliquot was adjusted to reach the desired final load upon addition of 100 μl sample in all cases). We made a number of control measurements with similar additions of RAC suspension to either pure standard buffer or a solution of a nonbinding protein (BSA; Sigma–Aldrich catalog no. 05470). These results were used partly to estimate the instrument dead time (i.e. the time required to mix the reactants in the cuvette) and partly to quantify the loss emission associated with light scattering from RAC particles.
Author contributions
N. R., J. K., T. H. S., and P. W. conceptualization; N. R., J. K., J. P. M., and A. M. C. data curation; N. R., J. K., K. S., and P. W. formal analysis; N. R., J. K., J. P. M., and P. W. methodology; N. R., J. K., and P. W. writing-original draft; N. R. project administration; N. R., J. K., S. F. B., A. M. C., and P. W. writing-review and editing; J. K., T. H. S., S. F. B., K. B., and P. W. supervision; J. K. and K. S. visualization; J. P. M. and K. B. resources; P. W. funding acquisition.
Supplementary Material
This work was supported by Innovation Fund Denmark Grant 5150-00020B (to P. W.), Novo Nordisk Foundation Grants NNF15OC0016606 and NNFSA170028392 (to P. W.), and Independent Research Fund Denmark Grant 8022-00165B (to P. W.). T. H. S., A. M. C., and K. B. work at Novozymes, a major enzyme-producing company.
This article contains supporting text, Table S1, and Figs. S1–S6.
- RAC
- regenerated amorphous cellulose
- BMCC
- bacterial microcrystalline cellulose
- TS
- transition state
- CD
- catalytic domain
- CBM
- carbohydrate binding domain.
References
- 1. Jeoh T., Cardona M. J., Karuna N., Mudinoor A. R., and Nill J. (2017) Mechanistic kinetic models of enzymatic cellulose hydrolysis: a review. Biotechnol. Bioeng. 114, 1369–1385 10.1002/bit.26277 [DOI] [PubMed] [Google Scholar]
- 2. Nill J., Karuna N., and Jeoh T. (2018) The impact of kinetic parameters on cellulose hydrolysis rates. Process Biochem. 74, 108–117 10.1016/j.procbio.2018.07.006 [DOI] [Google Scholar]
- 3. Badino S. F., Kari J., Christensen S. J., Borch K., and Westh P. (2017) Direct kinetic comparison of the two cellobiohydrolases Cel6A and Cel7A from Hypocrea jecorina. Biochim. Biophys. Acta Proteins Proteomics 1865, 1739–1745 10.1016/j.bbapap.2017.08.013 [DOI] [PubMed] [Google Scholar]
- 4. Kurasin M., and Väljamäe P. (2011) Processivity of cellobiohydrolases is limited by the substrate. J. Biol. Chem. 286, 169–177 10.1074/jbc.M110.161059 [DOI] [PMC free article] [PubMed] [Google Scholar]
- 5. Payne C. M., Himmel M. E., Crowley M. F., and Beckham G. T. (2011) Decrystallization of oligosaccharides from the cellulose I β surface with molecular simulation. J. Phys. Chem. Lett. 2, 1546–1550 10.1021/jz2005122 [DOI] [Google Scholar]
- 6. Cruys-Bagger N., Tatsumi H., Ren G. R., Borch K., and Westh P. (2013) Transient kinetics and rate-limiting steps for the processive cellobiohydrolase Cel7A: effects of substrate structure and carbohydrate binding domain. Biochemistry 52, 8938–8948 10.1021/bi401210n [DOI] [PubMed] [Google Scholar]
- 7. Kari J., Olsen J. P., Jensen K., Badino S. F., Krogh K. B. R. M., Borch K., and Westh P. (2018) Sabatier principle for interfacial (heterogeneous) enzyme catalysis. ACS Catal. 8, 11966–11972 10.1021/acscatal.8b03547 [DOI] [Google Scholar]
- 8. Sørensen T. H., Cruys-Bagger N., Windahl M. S., Badino S. F., Borch K., and Westh P. (2015) Temperature effects on kinetic parameters and substrate affinity of Cel7A cellobiohydrolases. J. Biol. Chem. 290, 22193–22202 10.1074/jbc.M115.658930 [DOI] [PMC free article] [PubMed] [Google Scholar]
- 9. Payne C. M., Knott B. C., Mayes H. B., Hansson H., Himmel M. E., Sandgren M., Ståhlberg J., and Beckham G. T. (2015) Fungal cellulases. Chem. Rev. 115, 1308–1448 10.1021/cr500351c [DOI] [PubMed] [Google Scholar]
- 10. Nakamura A., Tsukada T., Auer S., Furuta T., Wada M., Koivula A., Igarashi K., and Samejima M. (2013) The tryptophan residue at the active site tunnel entrance of Trichoderma reesei cellobiohydrolase Cel7A is important for initiation of degradation of crystalline cellulose. J. Biol. Chem. 288, 13503–13510 10.1074/jbc.M113.452623 [DOI] [PMC free article] [PubMed] [Google Scholar]
- 11. Divne C., Ståhlberg J., Teeri T. T., and Jones T. A. (1998) High-resolution crystal structures reveal how a cellulose chain is bound in the 50 angstrom long tunnel of cellobiohydrolase I from Trichoderma reesei. J. Mol. Biol. 275, 309–325 10.1006/jmbi.1997.1437 [DOI] [PubMed] [Google Scholar]
- 12. Lakowicz J. R. (2006) Principles of Fluorescence Spectroscopy, 3rd Ed., Springer-Verlag, New York Inc., New York [Google Scholar]
- 13. Pellegrini V. O., Lei N., Kyasaram M., Olsen J. P., Badino S. F., Windahl M. S., Colussi F., Cruys-Bagger N., Borch K., and Westh P. (2014) Reversibility of substrate adsorption for the cellulases Cel7A, Cel6A, and Cel7B from Hypocrea jecorina. Langmuir 30, 12602–12609 10.1021/la5024423 [DOI] [PubMed] [Google Scholar]
- 14. Palonen H., Tenkanen M., and Linder M. (1999) Dynamic interaction of Trichoderma reesei cellobiohydrolases Cel6A and Cel7A and cellulose at equilibrium and during hydrolysis. Appl. Environ. Microbiol. 65, 5229–5233 10.1128/AEM.65.12.5229-5233.1999 [DOI] [PMC free article] [PubMed] [Google Scholar]
- 15. Schiano-di-Cola C., Røjel N., Jensen K., Kari J., Sørensen T. H., Borch K., and Westh P. (2019) Systematic deletions in the cellobiohydrolase (CBH) Cel7A from the fungus Trichoderma reesei reveal flexible loops critical for CBH activity. J. Biol. Chem. 294, 1807–1815 10.1074/jbc.RA118.006699 [DOI] [PMC free article] [PubMed] [Google Scholar]
- 16. Kari J., Andersen M., Borch K., and Westh P. (2017) An inverse Michaelis Menten approach for general description of interfacial enzyme kinetics. ACS Catal. 7, 4904–4914 10.1021/acscatal.7b00838 [DOI] [Google Scholar]
- 17. Klostermeier D., and Rudolph M. G. (2017) Biophysical Chemistry, CRC Press, Taylor & Francis Group, Boca Raton, Florida [Google Scholar]
- 18. Kirk O., Borchert T. V., and Fuglsang C. C. (2002) Industrial enzyme applications. Curr. Opin. Biotechnol. 13, 345–351 10.1016/S0958-1669(02)00328-2 [DOI] [PubMed] [Google Scholar]
- 19. Sinsabaugh R. L., Belnap J., Findlay S. G., Shah J. J. F., Hill B. H., Kuehn K. A., Kuske C. R., Litvak M. E., Martinez N. G., Moorhead D. L., and Warnock D. D. (2014) Extracellular enzyme kinetics scale with resource availability. Biogeochemistry 121, 287–304 10.1007/s10533-014-0030-y [DOI] [Google Scholar]
- 20. Marangoni A. G. (1994) Enzyme kinetics of lipolysis revisited: the role of lipase interfacial binding. Biochem. Biophys. Res. Commun. 200, 1321–1328 10.1006/bbrc.1994.1595 [DOI] [PubMed] [Google Scholar]
- 21. Illanes A., Fernández-Lafuente R., Guisán R., and Wilson L. (2008) Heterogeneous enzyme kinetics. In Enzyme Biocatalysis (Illanes A., ed) Springer-Verlag, New York Inc., New York [Google Scholar]
- 22. McLaren A. D., and Packer L. (1970) Some aspects of enzyme reactions in heterogenous systems. Adv. Enzymol. Relat. Areas Mol. Biol. 33, 245–308 [DOI] [PubMed] [Google Scholar]
- 23. Liu H., Zhu J. Y., and Chai X. S. (2011) In situ, rapid, and temporally resolved measurements of cellulase adsorption onto lignocellulosic substrates by UV-vis spectrophotometry. Langmuir 27, 272–278 10.1021/la103306v [DOI] [PubMed] [Google Scholar]
- 24. Zhu P., Moran-Mirabal J. M., Luterbacher J. S., Walker L. P., and Craighead H. G. (2011) Observing Thermobifida fusca cellulase binding to pretreated wood particles using time-lapse confocal laser scanning microscopy. Cellulose 18, 749–758 [Google Scholar]
- 25. Moran-Mirabal J. M., Santhanam N., Corgie S. C., Craighead H. G., and Walker L. P. (2008) Immobilization of cellulose fibrils on solid substrates for cellulase-binding studies through quantitative fluorescence microscopy. Biotechnol. Bioeng. 101, 1129–1141 10.1002/bit.21990 [DOI] [PubMed] [Google Scholar]
- 26. Steiner W., Sattler W., and Esterbauer H. (1988) Adsorption of Trichoderma reesei cellulase on cellulose: experimental data and their analysis by different equations. Biotechnol. Bioeng. 32, 853–865 10.1002/bit.260320703 [DOI] [PubMed] [Google Scholar]
- 27. Nidetzky B., Steiner W., and Claeyssens M. (1994) Cellulose hydrolysis by the cellulases from Trichoderma reesei: adsorptions of two cellobiohydrolases, two endocellulases and their core proteins on filter paper and their relation to hydrolysis. Biochem. J. 303, 817–823 10.1042/bj3030817 [DOI] [PMC free article] [PubMed] [Google Scholar]
- 28. Cruys-Bagger N., Elmerdahl J., Praestgaard E., Tatsumi H., Spodsberg N., Borch K., and Westh P. (2012) Pre-steady state kinetics for the hydrolysis of insoluble cellulose by Trichoderma reesei Cel7A. J. Biol. Chem. 287, 18451–18458 10.1074/jbc.M111.334946 [DOI] [PMC free article] [PubMed] [Google Scholar]
- 29. Jalak J., Kurašhin M., Teugjas H., and Väljamäe P. (2012) Endo-exo synergism in cellulose hydrolysis revisited. J. Biol. Chem. 287, 28802–28815 10.1074/jbc.M112.381624 [DOI] [PMC free article] [PubMed] [Google Scholar]
- 30. Shibafuji Y., Nakamura A., Uchihashi T., Sugimoto N., Fukuda S., Watanabe H., Samejima M., Ando T., Noji H., Koivula A., Igarashi K., and Iino R. (2014) Single-molecule imaging analysis of elementary reaction steps of Trichoderma reesei cellobiohydrolase I (Cel7A) hydrolyzing crystalline cellulose I (α) and III (I). J. Biol. Chem. 289, 14056–14065 10.1074/jbc.M113.546085 [DOI] [PMC free article] [PubMed] [Google Scholar]
- 31. Moran-Mirabal J. M., Corgie S. C., Bolewski J. C., Smith H. M., Cipriany B. R., Craighead H. G., and Walker L. P. (2009) Labeling and purification of cellulose-binding proteins for high resolution fluorescence applications. Anal. Chem. 81, 7981–7987 10.1021/ac901183b [DOI] [PubMed] [Google Scholar]
- 32. Igarashi K., Koivula A., Wada M., Kimura S., Penttilä M., and Samejima M. (2009) High speed atomic force microscopy visualizes processive movement of Trichoderma reesei cellobiohydrolase I on crystalline cellulose. J. Biol. Chem. 284, 36186–36190 10.1074/jbc.M109.034611 [DOI] [PMC free article] [PubMed] [Google Scholar]
- 33. Jung J., Sethi A., Gaiotto T., Han J. J., Jeoh T., Gnanakaran S., and Goodwin P. M. (2013) Binding and movement of individual Cel7A cellobiohydrolases on crystalline cellulose surfaces revealed by single-molecule fluorescence imaging. J. Biol. Chem. 288, 24164–24172 10.1074/jbc.M113.455758 [DOI] [PMC free article] [PubMed] [Google Scholar]
- 34. Kostylev M., Moran-Mirabal J. M., Walker L. P., and Wilson D. B. (2012) Determination of the molecular states of the processive endocellulase Thermobifida fusca Cel9A during crystalline cellulose depolymerization. Biotechnol. Bioeng. 109, 295–299 10.1002/bit.23299 [DOI] [PubMed] [Google Scholar]
- 35. Kuusk S., Sørlie M., and Väljamäe P. (2015) The predominant molecular state of bound enzyme determines the strength and type of product inhibition in the hydrolysis of recalcitrant polysaccharides by processive enzymes. J. Biol. Chem. 290, 11678–11691 10.1074/jbc.M114.635631 [DOI] [PMC free article] [PubMed] [Google Scholar]
- 36. Cruys-Bagger N., Alasepp K., Andersen M., Ottesen J., Borch K., and Westh P. (2016) Rate of threading a cellulose chain into the binding tunnel of a cellulase. J. Phys. Chem. B 120, 5591–5600 10.1021/acs.jpcb.6b01877 [DOI] [PubMed] [Google Scholar]
- 37. Jalak J., and Väljamäe P. (2014) Multi-mode binding of cellobiohydrolase Cel7A from Trichoderma reesei to cellulose. PLoS One 9, e108181 10.1371/journal.pone.0108181 [DOI] [PMC free article] [PubMed] [Google Scholar]
- 38. Ståhlberg J., Johansson G., and Pettersson G. (1991) A new model for enzymatic hydrolysis of cellulose based on the two-domain structure of cellobiohydrolase I. Nat. Biotechnol. 9, 286–290 10.1038/nbt0391-286 [DOI] [Google Scholar]
- 39. Medve J., Ståhlberg J., and Tjerneld F. (1997) Isotherms for adsorption of cellobiohydrolase I and II from Trichoderma reesei on microcrystalline cellulose. Appl. Biochem. Biotechnol. 66, 39–56 10.1007/BF02788806 [DOI] [PubMed] [Google Scholar]
- 40. Karuna N., and Jeoh T. (2017) The productive cellulase binding capacity of cellulosic substrates. Biotechnol. Bioeng. 114, 533–542 10.1002/bit.26193 [DOI] [PubMed] [Google Scholar]
- 41. Ståhlberg J., Divne C., Koivula A., Piens K., Claeyssens M., Teeri T. T., and Jones T. A. (1996) Activity studies and crystal structures of catalytically deficient mutants of cellobiohydrolase I from Trichoderma reesei. J. Mol. Biol. 264, 337–349 10.1006/jmbi.1996.0644 [DOI] [PubMed] [Google Scholar]
- 42. Cruys-Bagger N., Elmerdahl J., Praestgaard E., Borch K., and Westh P. (2013) A steady-state theory for processive cellulases. FEBS J. 280, 3952–3961 10.1111/febs.12397 [DOI] [PubMed] [Google Scholar]
- 43. Nakamura A., Watanabe H., Ishida T., Uchihashi T., Wada M., Ando T., Igarashi K., and Samejima M. (2014) Trade-off between processivity and hydrolytic velocity of cellobiohydrolases at the surface of crystalline cellulose. J. Am. Chem. Soc. 136, 4584–4592 10.1021/ja4119994 [DOI] [PubMed] [Google Scholar]
- 44. von Ossowski I., Ståhlberg J., Koivula A., Piens K., Becker D., Boer H., Harle R., Harris M., Divne C., Mahdi S., Zhao Y., Driguez H., Claeyssens M., Sinnott M. L., and Teeri T. T. (2003) Engineering the exo-loop of Trichoderma reesei cellobiohydrolase, Ce17A: a comparison with Phanerochaete chrysosporium Cel7D. J. Mol. Biol. 333, 817–829 10.1016/S0022-2836(03)00881-7 [DOI] [PubMed] [Google Scholar]
- 45. Kurasin M. (2017) Processivity of Cellulases and Chitinases, Ph.D thesis, Tartu University, Tartu, Estonia [Google Scholar]
- 46. Fersht A. (1998) Structure and Mechanism in Protein Science, 2nd Ed., W. H. Freeman and Company, New York [Google Scholar]
- 47. Sousa S. F., Ramos M. J., Lim C., and Fernandes P. A. (2015) Relationship between enzyme/substrate properties and enzyme efficiency in hydrolases. ACS Catal. 5, 5877–5887 10.1021/acscatal.5b00923 [DOI] [Google Scholar]
- 48. Hudson K. L., Bartlett G. J., Diehl R. C., Agirre J., Gallagher T., Kiessling L. L., and Woolfson D. N. (2015) Carbohydrate–aromatic interactions in proteins. J. Am. Chem. Soc. 137, 15152–15160 10.1021/jacs.5b08424 [DOI] [PMC free article] [PubMed] [Google Scholar]
- 49. Knott B. C., Haddad Momeni M., Crowley M. F., Mackenzie L. F., Götz A. W., Sandgren M., Withers S. G., Ståhlberg J., and Beckham G. T. (2014) The mechanism of cellulose hydrolysis by a two-step, retaining cellobiohydrolase elucidated by structural and transition path sampling studies. J. Am. Chem. Soc. 136, 321–329 10.1021/ja410291u [DOI] [PubMed] [Google Scholar]
- 50. Sorlie M., Zakariassen H., Norberg A. L., and Eijsink V. G. H. (2012) Processivity and substrate-binding in family 18 chitinases. Biocatalysis and Biotransformation 30, 353–365 10.3109/10242422.2012.676282 [DOI] [Google Scholar]
- 51. Zakariassen H., Aam B. B., Horn S. J., Vårum K. M., Sørlie M., and Eijsink V. G. (2009) Aromatic residues in the catalytic center of chitinase A from Serratia marcescens affect processivity, enzyme activity, and biomass converting efficiency. J. Biol. Chem. 284, 10610–10617 10.1074/jbc.M900092200 [DOI] [PMC free article] [PubMed] [Google Scholar]
- 52. Kont R., Kari J., Borch K., Westh P., and Väljamäe P. (2016) Inter-domain synergism is required for efficient feeding of cellulose chain into active site of cellobiohydrolase Cel7A. J. Biol. Chem. 291, 26013–26023 10.1074/jbc.M116.756007 [DOI] [PMC free article] [PubMed] [Google Scholar]
- 53. Kari J., Olsen J., Borch K., Cruys-Bagger N., Jensen K., and Westh P. (2014) Kinetics of cellobiohydrolase (Cel7A) variants with lowered substrate affinity. J. Biol. Chem. 289, 32459–32468 10.1074/jbc.M114.604264 [DOI] [PMC free article] [PubMed] [Google Scholar]
- 54. Taylor C. B., Payne C. M., Himmel M. E., Crowley M. F., McCabe C., and Beckham G. T. (2013) Binding site dynamics and aromatic–carbohydrate interactions in processive and non-Processive family 7 glycoside hydrolases. J. Phys. Chem. B 117, 4924–4933 10.1021/jp401410h [DOI] [PubMed] [Google Scholar]
- 55. Zhang S., Irwin D. C., and Wilson D. B. (2000) Site-directed mutation of noncatalytic residues of Thermobifida fusca exocellulase Cel6B. Eur. J. Biochem. 267, 3101–3115 10.1046/j.1432-1327.2000.01315.x [DOI] [PubMed] [Google Scholar]
- 56. Koivula A., Kinnari T., Harjunpää V., Ruohonen L., Teleman A., Drakenberg T., Rouvinen J., Jones T. A., and Teeri T. T. (1998) Tryptophan 272: an essential determinant of crystalline cellulose degradation by Trichoderma reesei cellobiohydrolase Cel6A. FEBS Lett. 429, 341–346 10.1016/S0014-5793(98)00596-1 [DOI] [PubMed] [Google Scholar]
- 57. Davies G. J., Ducros V., Lewis R. J., Borchert T. V., and Schülein M. (1997) Oligosaccharide specificity of a family 7 endoglucanase: insertion of potential sugar-binding subsites. J. Biotechnol. 57, 91–100 10.1016/S0168-1656(97)00092-8 [DOI] [PubMed] [Google Scholar]
- 58. Fersht A. R., and Sato S. (2004) Φ-Value analysis and the nature of protein-folding transition states. Proc. Natl. Acad. Sci. U.S.A. 101, 7976–7981 10.1073/pnas.0402684101 [DOI] [PMC free article] [PubMed] [Google Scholar]
- 59. Ferguson N., and Fersht A. (2009) Φ-Value analysis of protein folding transition states. In Protein Engineering Handbook (Lutz S., and Bornscheuer U., eds) pp. 81–120, Wiley-VCH, Weinheim, Germany [Google Scholar]
- 60. Naganathan A. N., and Muñoz V. (2010) Insights into protein folding mechanisms from large scale analysis of mutational effects. Proc. Natl. Acad. Sci. U.S.A. 107, 8611–8616 10.1073/pnas.1000988107 [DOI] [PMC free article] [PubMed] [Google Scholar]
- 61. Sørensen T. H., Cruys-Bagger N., Borch K., and Westh P. (2015) Free energy diagram for the heterogeneous enzymatic hydrolysis of glycosidic bonds in cellulose. J. Biol. Chem. 290, 22203–22211 10.1074/jbc.M115.659656 [DOI] [PMC free article] [PubMed] [Google Scholar]
- 62. Ghattyvenkatakrishna P. K., Alekozai E. M., Beckham G. T., Schulz R., Crowley M. F., Uberbacher E. C., and Cheng X. (2013) Initial recognition of a cellodextrin chain in the cellulose-binding tunnel may affect cellobiohydrolase directional specificity. Biophys. J. 104, 904–912 10.1016/j.bpj.2012.12.052 [DOI] [PMC free article] [PubMed] [Google Scholar]
- 63. Bergenstråhle M., Thormann E., Nordgren N., and Berglund L. A. (2009) Force pulling of single cellulose chains at the crystalline cellulose–liquid interface: a molecular dynamics study. Langmuir 25, 4635–4642 10.1021/la803915c [DOI] [PubMed] [Google Scholar]
- 64. Yan B. X., Sun Y. Q., and Gao P. (1997) Intrinsic fluorescence in endoglucanase and cellobiohydrolase from Trichoderma pseudokiningii S-38: effects of pH, quenching agents, and ligand binding. J. Protein Chem. 16, 681–688 10.1023/A:1026354403952 [DOI] [PubMed] [Google Scholar]
- 65. Boer H., and Koivula A. (2003) The relationship between thermal stability and pH optimum studied with wild-type and mutant Trichoderma reesei cellobiohydrolase Cel7A. Eur. J. Biochem. 270, 841–848 10.1046/j.1432-1033.2003.03431.x [DOI] [PubMed] [Google Scholar]
- 66. Zolotnitsky G., Cogan U., Adir N., Solomon V., Shoham G., and Shoham Y. (2004) Mapping glycoside hydrolase substrate subsites by isothermal titration calorimetry. Proc. Natl. Acad. Sci. U.S.A. 101, 11275–11280 10.1073/pnas.0404311101 [DOI] [PMC free article] [PubMed] [Google Scholar]
- 67. Borch K., Jensen K., Krogh K., Mcbrayer B., Westh P., Kari J., Olsen J. P., Sørensen T. H., Windahl M. S., and Xu H. (2014) WIPO Patent WO 2,014,138,672
- 68. Zhang Y. H., Cui J., Lynd L. R., and Kuang L. R. (2006) A transition from cellulose swelling to cellulose dissolution by o-phosphoric acid: evidence from enzymatic hydrolysis and supramolecular structure. Biomacromolecules 7, 644–648 10.1021/bm050799c [DOI] [PubMed] [Google Scholar]
Associated Data
This section collects any data citations, data availability statements, or supplementary materials included in this article.