Abstract
Objective
To study the social determinants and cardiovascular risk factors for multimorbidity and the acquisition sequence of multimorbidity.
Design
Longitudinal study based on anonymised primary care data.
Setting
General practices in an urban multiethnic borough in London, UK.
Participants
332 353 patients aged ≥18 years.
Main outcome measures
Clinical and sociodemographic characteristics of patients with multimorbidity, defined as ≥3 of 12 long-term conditions (LTCs) selected according to high predicted healthcare use. Multilevel logistic regression was used to model social determinants and cardiovascular risk factors. Alluvial plots were constructed to illustrate multimorbidity acquisition sequences according to age, ethnicity and social deprivation.
Results
5597 (1.7%) patients had ≥3 selected LTCs, the ‘multimorbidity cohort’. The the most common LTCs were diabetes (63.0%) and chronic pain (CP) (42.8%). Social deprivation and ethnicity were independent determinants of multimorbidity: most compared with the least deprived quintile (adjusted OR (AOR) 1.56 (95% CI 1.41 to 1.72)); South Asian compared with white ethnicity (AOR 1.44 (95% CI 1.29 to 1.61)); and black compared with white ethnicity (AOR 0.86 (95% CI 0.80 to 0.92)). The included cardiovascular risk factors were relatively strong determinants of multimorbidity: hypertension (AOR 5.05 (95% CI 4.69 to 5.44)), moderate obesity (AOR 3.41 (95% CI 3.21 to 3.63)) and smoking (AOR 2.30 (95% CI 2.16 to 2.45)). The most common initial onset conditions were diabetes and depression; diabetes particularly in older and black ethnic groups; and depression particularly in younger, more deprived and white ethnicity groups. CP was less common as an initial condition.
Conclusion
Our findings confirm the importance of age, social deprivation and ethnicity as determinants of multimorbidity. Smoking, obesity and hypertension as cardiovascular risk factors were stronger determinants of multimorbidity than deprivation or ethnicity. The acquisition sequence of multimorbidity is patterned by sociodemographic determinants. Understanding onset conditions of multimorbidity and cardiovascular cardiovascular risk factors may lead to the development of interventions to slow the progression of multimorbidity.
Keywords: primary care, multimorbidity, demographic factors, risk factors
Strengths and limitations of this study.
This study uses a definition of multimorbidity based on long-term conditions with high predicted healthcare use rates.
Multimorbidity is studied in a deprived, multiethnic community.
Longitudinal data are used to identify the acquisition sequence of multimorbidity and how this is influenced by sociodemographic determinants.
Difficulties gaining access to anonymised primary care data limited the sample size and may have contributed to selection bias.
Coding validation and completeness restricted the analysis of available primary care data.
Background
Healthcare use is increasingly driven by multimorbidity.1 Each long-term condition (LTC) included within a definition of multimorbidity is likely to generate multiple primary care consultations with general practitioners (GPs), practice nurses and other healthcare professionals, and may result in accident and emergency attendances, referral to outpatient appointments and hospital admissions.
Estimates of healthcare use attributable to multimorbidity vary according to the LTCs included within a definition of multimorbidity. There is no standard definition of multimorbidity. One systematic review noted that the number of included LTCs ranged from 5 to 185 with estimates of population prevalence ranging from 13.1% to 71.8%, depending on the number of included conditions.2 In one recent UK study in which multimorbidity was defined as two or more of a selection of 36 LTCs, 27.2% of the population had multimorbidity, accounting for 52.9% of GP consultations and generating a median of nine annual GP consultations.3 LTCs also contribute to the development of frailty, itself a driver of healthcare use.4
In response to high demand for health and social care, many healthcare providers and commissioners have sought to identify those patients with the greatest needs through a process termed ‘risk stratification’. Several electronic tools have been developed to offer population-based risk stratification.5 An alternative approach is the use of expert panels to define high-demand patient groups.6 Having identified the cohort of patients with the greatest requirement for health and social care services, the purpose of this process was to guide resource allocation on a needs basis, often with the implicit assumption that additional investment in a primary care setting may reduce demand for more expensive secondary care services. Although funding and healthcare need should align, there is little evidence that investment in additional community resources for those most at risk of hospital attendance results in overall reductions in secondary care use.7
Following a consultation exercise and report from an expert panel, two inner London boroughs and their commissioning groups made the decision to define multimorbidity based on predicted high healthcare and social care demands. Multimorbidity in this context consisted of three or more LTCs considered most likely to result in functional impairment and high service demand. This ‘high service demand’ definition was used to identify a cohort to receive a package of integrated care, termed ‘care coordination’. A focus on this narrowly defined category of multimorbidity would inevitably mean that the proportion of patients defined as ‘multimorbid’ would be lower than reported in studies based on broader definitions of multimorbidity.2 3
The aim was to study the characteristics of this multimorbidity cohort. The main objectives were to define both the sociodemographic determinants and cardiovascular risk factors associated with multimorbidity acquisition and also to determine the acquisition sequence of multimorbidity and the influence of demographic factors on this sequence.
Methods
Study setting
Our study was set in Lambeth, one of the two inner London UK boroughs adopting the care coordination definition of multimorbidity.8 The population sample consisted of all patients registered at all general practices (n=44) in Lambeth, with the exception of patients who had opted out of anonymised data sharing for research purposes.
Study design
We conducted a longitudinal analysis based on anonymised coded primary care data extracted from electronic health records (EHRs) held in primary care.
Study population
We included data on all patients aged 18 years and over registered with a general practice. For the population with multimorbidity, we included all those with LTCs recorded in the EHR and included in the care coordination definition of multimorbidity: atrial fibrillation, chronic obstructive pulmonary disease (COPD), chronic pain (CP), chronic kidney disease, coronary heart disease (CHD), diabetes mellitus (DM), dementia, depression, heart failure (HF), serious mental illness (SMI), stroke and morbid obesity. The definition and specified codes for each condition were that used by the Quality and Outcomes Framework (QOF), based on ‘QOF38’ definitions.9 Two of the conditions selected for inclusion within the definition of multimorbidity were not included within the QOF: CP, defined on the basis of two or more repeat prescriptions for opioid analgesics (British National Formulary, chapter 4.7.2) or neuropathic pain medication (British National Formulary, chapter 4.7.3)10; and morbid obesity, defined as a Body Mass Index (BMI) of ≥40 kg/m2. For each LTC, the date of onset was obtained from the EHR and was used in the longitudinal analysis.
Demographic data consisted of gender, age in years (on the date of data extraction) and self-ascribed ethnicity obtained from the EHR. Social deprivation data derived from residency data were based on the Index of Multiple Deprivation 2010 classification at lower super output area (LSOA), stratified into locally based quintiles.11 Local deprivation quintiles were used in place of national quintiles since mean deprivation levels are high in Lambeth, the 22nd most deprived local authority (out of 326) in England.12
Cardiovascular risk factors included in the analysis were hypertension (defined as patients on the QOF Hypertension register); moderate obesity (defined as a BMI of 30.0–39.9; note that patients with a BMI of ≥40 were included as one of the LTCs within the definition of multimorbidity and therefore were not included as a cardiovascular risk factor); and smoking (patients with any record of being a smoker).
Data variables
The data consisted of ‘real-world’, routinely collected, anonymised, patient-level Read, Egton Medical Information Systems (EMIS) and SNOMED coded information. Routinely collected electronic data were available from all included practices from 2004. Data were extracted from the EHR into a secure data warehouse and contained information on patient demographic characteristics, LTCs, clinical values and medication. The data used in this study were extracted in May 2018 and were related to all patients registered at each of the included practices on that date.
Data analysis
We analysed sociodemographic (age, gender and ethnicity), social (area-level deprivation) and cardiovascular risk factor (hypertension, moderate obesity and smoking status) data for the multimorbidity cohort and general population using univariable statistical methods applied at patient level. Sociodemographic and cardiovascular risk factor determinants of multimorbidity were analysed using multilevel logistic regression models to model practice-level variation. We also conducted a sensitivity analysis using logistic regression models adjusted for clustering at the practice level. The sensitivity analysis allowed pseudo-r2 values and receiver operating characteristic (ROC) curves to be derived. Analysis was conducted using the statistical software package STATA IC V.15.13
The acquisition sequence for patients in the multimorbidity cohort was established by searching the EHR for the date of onset of each LTC. For this analysis, we established the order of acquisition and tabulated the frequency of first, second and third LTCs. Patients with identical dates of onset recorded for two or more LTCs were excluded from this analysis. We displayed findings using alluvial plots, an infographic allowing representation of multiple pathways. These were constructed using the software R, and the packages ‘ggplot2’ and ‘ggalluvial’.14
Patient and public involvement
The borough based and statutory organisation, Lambeth HealthWatch, represented the interests of patients and the public in this work; they contributed to the original protocol design and shared in the dissemination of the findings.
Results
Multimorbidity cohort characteristics
The final study population consisted of 332 353 patients aged ≥18 years. Data from 13 369 (4.0%) patients had been excluded because a data sharing opt-out code was recorded in their EHR. Patients were included in the final sample even though some sociodemographic data were missing: 3289 (0.99%) patients could not be linked to a LSOA and therefore had missing Index of Multiple Deprivation (IMD)-2015 score data; ≤10 patients had missing coded gender data; ≤10 patients had missing coded age data. Patients with any category of missing data (n=3301) were excluded from the multivariable analysis.
In all, 5597 (1.7%) patients had a record of three or more of the selected LTCs, the ‘multimorbidity cohort’. Most (n=3542) of this cohort had three LTCs (63.3%); 1333 (23.8%) had four LTCs; 492 (8.8%) had five LTCs; and the remaining 230 (4.1%) had more than five LTCs. Of the remaining population, 45 241 (13.6%) had one LTC and 10 992 (3.3%) had two LTCs.
A summary of LTC frequencies within the multimorbidity cohort is displayed in table 1. The most common LTCs within this cohort were DM (63.0%) and CP (42.8%). In contrast, the most common of the included LTCs in the adult general population were depression (8.4%), DM (5.4%) and morbid obesity (3.2%).
Table 1.
Frequencies of LTCs included in the multimorbidity cohort (n=5597 patients) compared with the remainder of the registered population and with the general population aged ≥18 years
| LTC | Multimorbidity cohort: frequency (valid %) n=5597 |
Non-multimorbidity cohort: frequency (valid %) n=326 756 | Total population values: frequency (valid %) n=332 353 |
| DM | 3525 (63.0) | 14 405 (4.4) | 17 930 (5.4) |
| Chronic pain | 2397 (42.8) | 5813 (1.8) | 8210 (2.5) |
| CKD | 2101 (37.5) | 3470 (1.1) | 5571 (1.7) |
| CHD | 2099 (37.5) | 2668 (0.8) | 4767 (1.4) |
| Depression | 2086 (37.3) | 25 877 (7.9) | 27 963 (8.4) |
| Morbid obesity | 1653 (29.5) | 8883 (2.7) | 10 486 (3.2) |
| AF | 1254 (22.4) | 1493 (0.5) | 2747 (0.8) |
| COPD | 1247 (22.3) | 2387 (0.7) | 3634 (1.1) |
| Heart failure | 1186 (21.2) | 544 (0.2) | 1730 (0.5) |
| Stroke | 1095 (19.6) | 1571 (0.5) | 2666 (0.8) |
| SMI | 692 (12.4) | 4099 (1.3) | 4791 (1.4) |
| Dementia | 616 (11.0) | 738 (0.2) | 1354 (0.4) |
AF, atrial fibrillation; CHD, coronary heart disease; CKD, chronic kidney disease; COPD, chronic obstructive pulmonary disease; DM, diabetes mellitus; LTC, long-term condition; SMI, serious mental illness.
The sociodemographic characteristics of the multimorbidity cohort are displayed in table 2. Within the cohort, 33.9% were aged under 65 years (compared with 91.7% in the sample population); 27.7% were of a ‘black’ ethnicity (18.0% in the sample population); and 46.0% were born in the UK (45.2% in the sample population). The mean age for the multimorbid cohort was 69.9 years (compared with a mean of 41.6 years in the sample population). The mean ages for multimorbid patients in least and most deprived quintiles was 73.0 (SD 13.5) and 69.3 (SD 12.9) years, respectively; and those for the white, black and South Asian populations were 71.2 (SD 13.3), 69.4 (SD 14.3) and 71.9 (SD 11.8) years, respectively.
Table 2.
Sociodemographic characteristics of multimorbidity cohort, compared with remainder of registered population aged ≥18 years
| Demographic characteristic | Multimorbidity cohort: frequency (valid %) n=5597 | Non-multimorbidity cohort: frequency (valid %) n=326 756 |
| Female gender | 3042 (54.4) | 161 445 (49.4) |
| Age <65 years | 1899 (33.9) | 299 742 (91.7) |
| Age ≥65–74 years | 1249 (22.3) | 15 992 (4.9) |
| Age ≥75–84 years | 1479 (26.4) | 8038 (2.5) |
| Age ≥85 years | 970 (17.3) | 2884 (0.9) |
| White | 3022 (54.0) | 179 859 (55.0) |
| Black | 1553 (27.7) | 58 939 (18.0) |
| South Asian | 469 (8.4) | 22 323 (6.8) |
| Mixed | 197 (3.5) | 15 177 (4.6) |
| Other | 100 (1.8) | 9804 (3.0) |
| Unknown | 256 (4.6) | 40 654 (12.4) |
| Country of origin: UK* | 1413 (46.0) | 69 675 (45.2) |
| Language preference: English* | 3755 (84.0) | 240 287 (73.8) |
| Social deprivation: first quintile (most deprived)* |
1500 (26.8) | 63 374 (19.4) |
| Social deprivation: second quintile* |
1232 (22.0) | 63 073 (19.3) |
| Social deprivation: third quintile* |
995 (17.8) | 66 409 (20.3) |
| Social deprivation: fourth quintile* |
1013 (18.1) | 66 334 (20.3) |
| Social deprivation: fifth quintile (least deprived)* |
828 (14.8) | 64 306 (19.7) |
*Missing data with reduction in denominator number.
Multimorbidity cohort sociodemographic determinants
Sociodemographic determinants of the multimorbidity cohort were dominated by the effect of older age groups but also included social deprivation and ethnicity (online supplementary table 1). Based on the adjusted OR (AOR) derived from the multilevel regression model, the strongest determinant for multimorbidity was related to age. After adjustment for age, both social deprivation (the more deprived quintiles) and ethnicity (black and South Asian ethnicities) remained significant determinants, although with much smaller ORs. The AORs for black and South Asian compared with white ethnicity were 1.15 (95% CI 1.07 to 1.23) and 1.19 (95% CI 1.07 to 1.33), respectively; for most compared with the least deprived quintile, the AOR was 1.83 (95% CI 1.66 to 2.02).
bmjopen-2019-031649supp001.pdf (1.6MB, pdf)
Multimorbidity cohort cardiovascular risk factor determinants
Addition of the three cardiovascular risk factors included in the study attenuated the ORs for multimorbidity related to age (table 3). Social deprivation remained a determinant of multimorbidity: for most compared with the least deprived quintile, the AOR was 1.56 (95% CI 1.41 to 1.72). South Asian ethnicity remained a significant determinant of multimorbidity: AOR 1.44 (95% CI 1.29 to 1.61), but black ethnicity was no longer a positive determinant: AOR 0.86 (95% CI 0.80 to 0.92).
Table 3.
Sociodemographic determinants of the multimorbidity cohort: ORs derived from multilevel logistic regression modelling with addition of three cardiovascular risk factors: hypertension, obesity (moderate) and smoking (ever)
| Demographic characteristic | AOR | 95% CIs for AOR |
| Female gender | 1.10 | 1.01 to 1.19 |
| Age <65 years | (Reference group) | |
| Age ≥65–74 years | 4.01 | 3.69 to 4.36 |
| Age ≥75–84 years | 8.12 | 7.46 to 8.83 |
| Age ≥85 years | 15.71 | 14.20 to 17.38 |
| White | (Reference group) | |
| Black | 0.86 | 0.80 to 0.92 |
| South Asian | 1.44 | 1.29 to 1.61 |
| Mixed | 0.95 | 0.81 to 1.11 |
| Other | 0.83 | 0.67 to 1.03 |
| Unknown | 0.60 | 0.52 to 0.69 |
| Social deprivation: first quintile (most deprived) |
1.56 | 1.41 to 1.72 |
| Social deprivation: second quintile |
1.35 | 1.22 to 1.50 |
| Social deprivation: third quintile |
1.18 | 1.06 to 1.31 |
| Social deprivation: fourth quintile |
1.18 | 1.06 to 1.30 |
| Social deprivation: fifth quintile (least deprived) |
(Reference group) | |
| Hypertension register | 5.05 | 4.69 to 5.44 |
| Moderate obesity | 3.41 | 3.21 to 3.63 |
| Smoker (ever) | 2.30 | 2.16 to 2.45 |
AOR, adjusted odds ratio.
The three cardiovascular risk factors that were significant determinants of multimorbidity were hypertension (AOR 5.05 (95% CI 4.69 to 5.44)), moderate obesity (AOR 3.41 (95% CI 3.21 to 3.63)) and smoking (AOR 2.30 (95% CI 2.16 to 2.45)).
Sensitivity analyses
Reanalysis of the determinants of multimorbidity using regression modelling adjusted for clustering at practice level resulted in AORs similar to those obtained in the primary analyses (online supplementary table 2). We explored goodness of fit through derived pseudo-r2 values for demographic determinants, pseudo-r2=0.22, and for cardiovascular risk factor adjusted determinants (hypertension, moderate obesity and smoking), pseudo-r2=0.32. The areas under the ROC curve for each model were 0.84 and 0.93, respectively (online supplementary figures 1 and 2).
Multimorbidity acquisition sequence
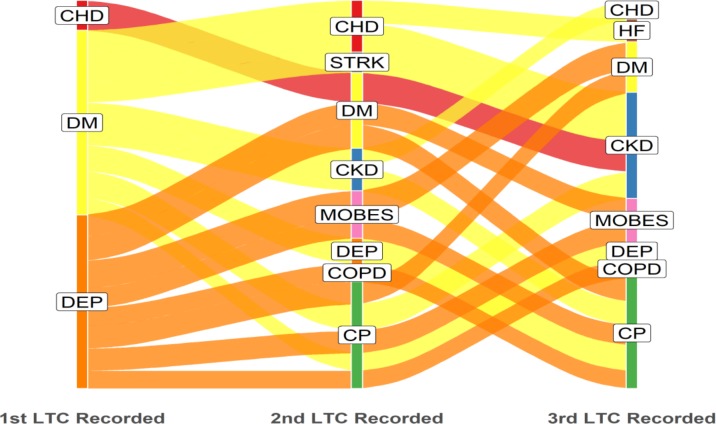
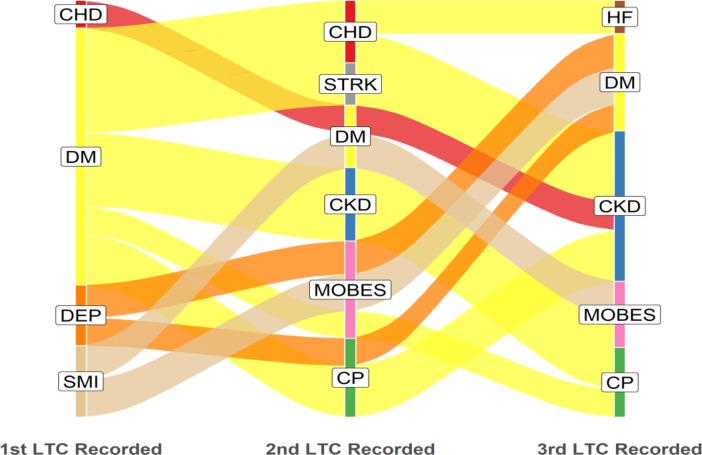
Of the 5597 patients in the multimorbidity cohort, 5196 had three distinct dates of onset for each of their three or more component LTCs. The remaining 401 (7.2%) patients had identical dates of onset recorded for two or three of their first three LTCs and therefore could not be classified into a sequence. Alluvial plots were constructed displaying the acquisition sequence for LTCs and edited to display dominant flows of patients in each category. Figure 1 displays the three most common starting conditions and subsequent most commonly acquired second and third LTCs. Unedited alluvial plots displaying all patient flows are shown in the online supplementary figure 3.
Figure 1.
Acquisition sequence of LTCs; dominant pathways displayed with patient flows ≥35 (n=769). LTC label abbreviations (n=12): CHD, coronary heart disease; CKD, chronic kidney disease; COPD, chronic obstructive pulmonary disease; CP, chronic pain; DEM, dementia; DEP, depression; DM, diabetes mellitus; HF, heart failure; LTC, long-term condition; MOBES, morbid obesity; STRK, stroke.
The alluvial plots illustrate that diabetes and depression were the most common starting conditions for patients with multimorbidity; diabetes was also relatively common as the second or third acquired LTC, whereas depression was predominantly a first-onset LTC (figure 1).
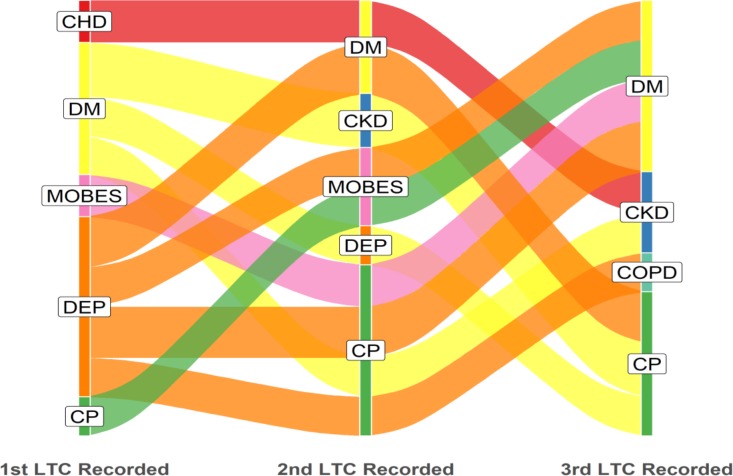
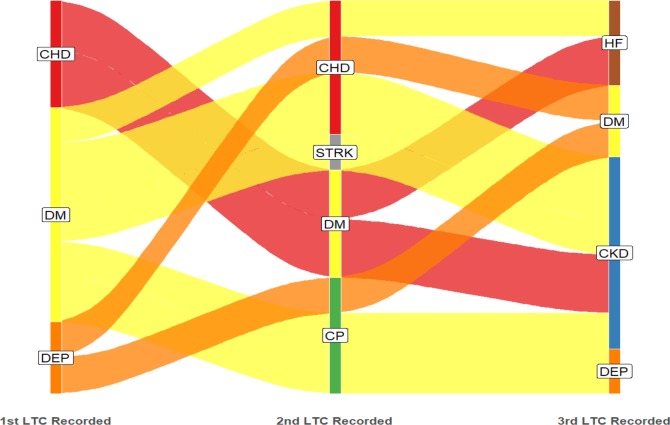
In the most deprived quintile, diabetes and depression were the most common starting conditions, whereas in the least deprived quintile, diabetes and CHD were more common as starting conditions than depression (figures 2 and 3). Unedited alluvial plots comparing most and least deprived quintiles are shown in online supplementary figures 4 and 5.
Figure 2.
Most deprived quintile: dominant pathways displayed with patient flows ≥13 (n=145). LTC label abbreviations (n=12): CHD, coronary heart disease; CKD, chronic kidney disease; COPD, chronic obstructive pulmonary disease; CP, chronic pain; DEP, depression; DM, diabetes mellitus; HF, heart failure; LTC, long-term condition; MOBES, morbid obesity.
Figure 3.
Least deprived quintile: dominant pathways displayed with patient flows ≥8 (n=89). LTC label abbreviations (n=12): CHD, coronary heart disease; CKD, chronic kidney disease; CP, chronic pain; DEP, depression; DM, diabetes mellitus; HF, heart failure; LTC, long-term condition; STRK, stroke.
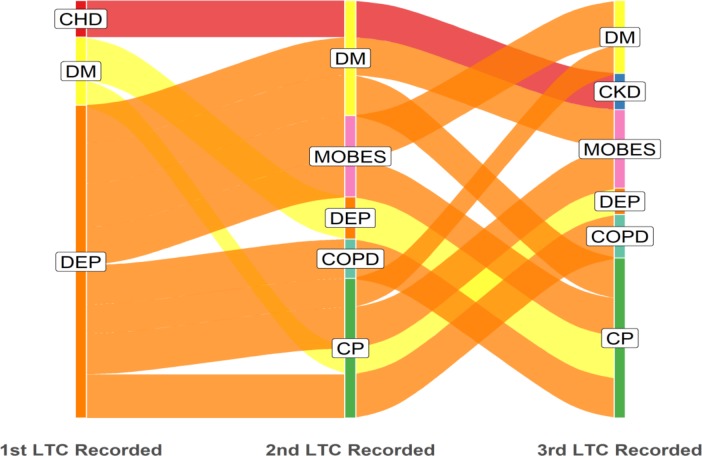
Multimorbidity in the white ethnic group was dominated by depression as the starting condition, whereas in the black ethnic group, diabetes was the most common starting condition, with depression and SMI also relatively common (figures 4 and 5). Relatively small numbers resulted in poor definition of the alluvial plot in the South Asian group, and this figure is not presented. Unedited alluvial plots comparing black and white ethnic groups are shown in online supplementary figures 6 and 7.
Figure 4.
‘White’ ethnic group: dominant pathways displayed with patient flows ≥18 (n=287). LTC label abbreviations (n=12): CHD, coronary heart disease; CKD, chronic kidney disease; COPD, chronic obstructive pulmonary disease; CP, chronic pain; DEP, depression; DM, diabetes mellitus; LTC, long-term condition; MOBES, morbid obesity.
Figure 5.
‘Black’ ethnic group: dominant pathways displayed with patient flows ≥15 (n=227). LTC label abbreviations (n=12): CHD, coronary heart disease; CKD, chronic kidney disease; CP, chronic pain; DEP, depression; DM, diabetes mellitus; HF, heart failure; LTC, long-term condition; MOBES, morbid obesity; SMI, serious mental illness; STRK, stroke.
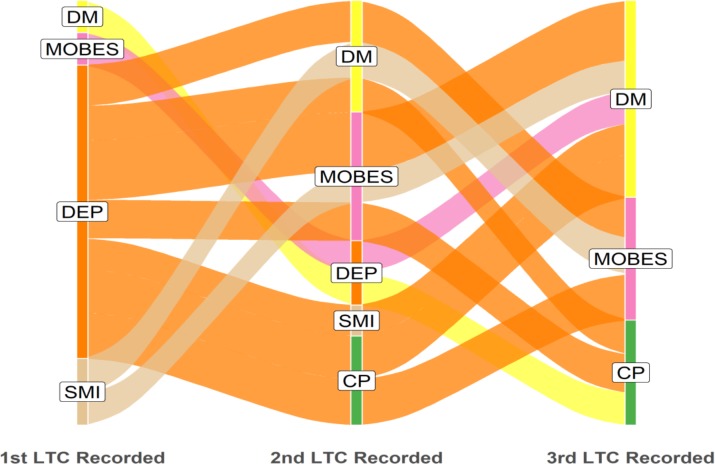
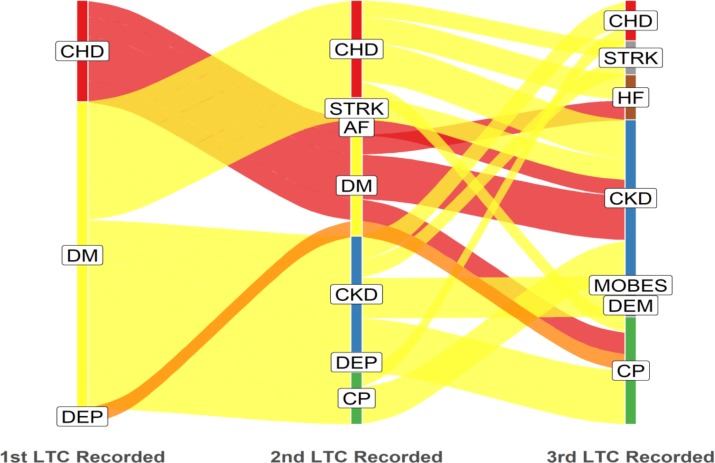
Multimorbidity in the under 65-year-old cohort was dominated by depression as the starting condition, with SMI also relatively common; in the ≥65-year-old cohort, diabetes and CHD were the most common starting conditions (figures 6 and 7).
Figure 6.
Age under 65 years: dominant pathways displayed with patient flows ≥25 (n=343). LTC label abbreviations (n=12): CP, chronic pain; DM, diabetes mellitus; LTC, long-term condition; MOBES, morbid obesity; SMI, serious mental illness.
Figure 7.
Age 65 years and over: dominant pathways displayed with patient flows ≥20 (n=536). LTC label abbreviations (n=12): AF, atrial fibrillation; CHD, coronary heart disease; CKD, chronic kidney disease; CP, chronic pain; DEP, depression; DM, diabetes mellitus; HF, heart failure; LTC, long-term condition; MOBES, morbid obesity; STRK, stroke.
CP appeared to be more common as a second or third acquired LTC but less common as a first LTC. This sequence was apparent in the overall picture, in the pattern displayed by least and most deprived quintiles, for black and white ethnicities and for younger and older age cohorts.
Morbid obesity was among the more common starting conditions in the most deprived cohort and younger age cohort. However, in other sociodemographic samples, morbid obesity was more common as second and third acquired LTCs.
Discussion
We report on multimorbidity using a definition originating from a health service commissioning perspective, consisting of 3 or more of 12 LTCs selected because of likely high impact on health service and social care use. In total, 1.7% of the adult population in our study sample had multimorbidity according to these narrowly defined criteria. Diabetes and CP were the most prevalent LTCs within this cohort. Independent of age, both ethnicity and social deprivation were significant determinants of multimorbidity. However, the cardiovascular risk factors of hypertension, obesity and smoking were more strongly associated with multimorbidity than social deprivation or ethnicity.
The acquisition sequence of multimorbidity differed substantially according to age, ethnicity and social deprivation. Diabetes and depression were the most common starting conditions overall. Diabetes as a starting condition was notably more common in the older and black ethnic group. Depression as a starting condition was notably more common in patients who were younger, more deprived and in the white ethnic group. Differences in acquisition sequence between most and least deprived areas and white and black ethnicities (figures 2–5) are unlikely to have been strongly influenced by age differences since mean age was similar for each of these cohorts.
Strengths and limitations
Data access was a limitation to this analysis. We were only able to obtain data from one of the two boroughs adopting this approach to multimorbidity; the other lacked a data extraction system, preventing us from analysing large datasets of patient-level data. Had we gained access to the data, this would have approximately doubled our sample size and enabled further analysis of multimorbidity in deprived, multiethnic populations. This difficulty in accessing anonymised data hampers the analysis of patient-level data in many areas of the UK.15 Data coding constrains the analysis of primary care data, and we were only able to study the association of multimorbidity with a limited range of cardiovascular risk factors, while other known risk factors such as exercise and diet could not be captured. We aimed to display the acquisition sequence of LTCs using alluvial plots. Although these plots clearly display the sequence in which patients develop LTCs, they do not readily display time data and thus fail to distinguish between rapidly and slowly progressing multimorbidity. A time-to-event analysis is required for identifying those patients who progress rapidly from first LTC into multimorbidity, which is the subject of further study. Similarly, the acquisition sequence could not be determined for a small minority of patients with identical LTC date-of-onset recording by GPs, whereas in reality, it is unlikely that the LTC onset dates were simultaneous. Furthermore, as with all studies based on primary care data, there may be coding anomalies which introduce bias into the estimates of LTC prevalence. QOF coding criteria were used for 10 of the included LTCs, standardising the definition. However, the prevalence of conditions such as depression may be underestimated using QOF criteria.16 For the two LTCs not included in the QOF, the definition is dependent on GP coding. Thus,‘morbid obesity’ was only included in our study if there was a BMI recording which may have resulted in an underestimate of prevalence. ‘CP’ was defined based on medication consumption, whereas many patients with CP may have sought alternatives to analgesic medication resulting in an underestimate of prevalence; conversely, our inclusion criteria of ‘two or more prescriptions over the preceding year’ may have resulted in an overestimate of prevalence, with some patients recovering from CP during the course of the year. In common with other observational studies, significant associations between multimorbidity and sociodemographic or cardiovascular risk factor determinants may imply, but cannot prove, causality. While interventional studies are required to obtain stronger evidence of causality, causal inference may be derived by time series analyses and further study of potential confounding and residual variance. Finally, the richness of locally based data covering a whole borough with unique sociodemographic characteristics has to be offset against possible loss of generalisability to other areas with very different social deprivation and ethnicity characteristics.
Comparison with the literature
Our cross-sectional data, although conducted in a deprived, multiethnic population, are similar to the findings of others reporting on increased multimorbidity prevalence associated with age, social deprivation and ethnic minority status.17 Comparison with other multimorbidity studies is difficult because of the highly restricted definition of multimorbidity used in the current study. Nevertheless, other studies have reported the high prevalence of both diabetes and depression in multimorbidity cohorts.3 17 A higher prevalence of mental health and physical health LTC combinations has been noted in deprived areas, although in our own study we did not conduct an analysis to identify specific LTC combinations.18 Certain conditions have been found to be more prevalent in deprived communities, also contributing to higher prevalence of multimorbidity in these areas, such as depression and addiction issues in younger deprived populations,19 or more generally, depression, drugs, anxiety, dyspepsia, CP, CHD and DM.20 These findings are aligned to our own reporting of high proportions of multimorbid patients in deprived areas with depression and diabetes. The known influence of population age profiles on the demography of multimorbidity19 is illustrated by our finding of markedly differing alluvial plot profiles describing multimorbidity acquisition in a younger cohort dominated by mental health-related conditions (figure 6) and an older cohort dominated by CHD and DM (figure 7). The inner city population in our study is characterised by a much younger overall age profile compared with the national population: 8% of the population of Lambeth is aged 65 years or more compared with a mean of 18% in England.21 Added to this, the most socially deprived and black ethnic minority groups in our sample were somewhat younger. Both factors are likely to have reduced the overall study prevalence of conditions associated with ageing, such as diabetes and CHD. Many multimorbidity studies do not include morbid obesity within their definition3 17; we found morbid obesity was particularly associated with social deprivation.
Several publications have reported on combinations and clusters of LTCs, but few longitudinal analyses have been reported.22 One study from Australia reported the order of appearance for eight LTCs, reporting in detail for asthma and mood-related disorders, the two LTCs most strongly associated with the risk of developing a second LTC. For those with baseline asthma, there was a higher subsequent risk of developing COPD and hypercholesterolaemia; for those with baseline mood disorders, their risk of subsequent asthma, diabetes and other mental disorders was increased.23 In a study of cardiometabolic conditions in Australia, nearly one-quarter of women initially diagnosed with stroke subsequently progressed to other conditions, which was a much larger proportion progressing to other conditions than in those initially diagnosed with diabetes (9.9%) or heart disease (11.4%).24 A further US study explored the acquisition sequence of 20 LTCs describing dyads and triads of conditions and reporting, for example, that the most common triad sequence in 20–39 year olds was depression, asthma and substance misuse, whereas in 50–59 year olds, it was hyperlipidaemia, hypertension and diabetes.25 They concluded that combinations of LTCs vary extensively by age and sex. Our own findings confirm variation by age and sex, with ethnicity adding to the pattern of variation. Some authors have suggested that the study of acquisition sequence may imply potential interventions to prevent, minimise or delay progression toward multimorbidity.23 Our findings that three cardiovascular risk factors are more strongly associated with multimorbidity than deprivation and ethnicity suggest that interventions to reduce the impact of these cardiovascular risk factors may contribute to a reduction in the prevalence of multimorbidity. The control of hypertension, smoking and obesity are often perceived in terms of primary cardiovascular disease prevention or of secondary prevention of single LTCs but may also be conceptualised in terms of multimorbidity prevention. However, a focus on cardiovascular risk factors should not detract from ‘the causes of the causes’, since social conditions themselves generate causal pathways leading from socioeconomic determinants to risk behaviours26 and interventions which address health behaviours, while failing to engage in social determinants may paradoxically result in increased health inequalities.27
Conclusion
We have confirmed the role of age, social deprivation and ethnicity as determinants of multimorbidity in an inner city multiethnic population and have extended previous findings demonstrating the way in which the acquisition sequence of multimorbidity is patterned by these determinants. Three cardiovascular risk factors, hypertension, obesity and smoking, were stronger determinants of multimorbidity than either deprivation or ethnicity. The strength of these cardiovascular risk factors as determinants suggests interventions which may be effective in reducing the prevalence, delaying the onset or slowing the progression of multimorbidity.
Supplementary Material
Footnotes
Contributors: MA, HD and MW contributed to the idea and design of the study. SD, DW and JC led the data extraction and preparation. Statistical analysis was conducted by MA and HD. MA produced the first draft of the paper; all coauthors contributed and approved the final draft. MA was the guarantor. The corresponding author attests that all listed authors meet authorship criteria and that no others meeting the criteria have been omitted.
Funding: This work was supported by the Guy’s and St Thomas’ Charity with a grant awarded in November 2017.
Disclaimer: The views expressed are those of the authors and not necessarily those of the funders. The findings presented are independent from the funders who have had no role in data collection, data analysis or writing of the paper.
Competing interests: None declared.
Patient consent for publication: Not required.
Ethics approval: All data were extracted under the terms of a signed data sharing agreement with each practice and with project-specific approval following submission of a data privacy impact assessment, approved by Lambeth Clinical Commissioning Group in 2 November 2017. Information governance approval required ‘low number suppression’, ensuring that data could not be displayed if the patient number was 10 or less in any given category; in these circumstances, data reporting would state: ‘≤10 patients’. Separate ethical committee approval was not required (Health Research Authority, personal correspondence, 29 September 2017) since all data were fully anonymised for the purposes of research access, and all patient identifiable data had been removed.
Provenance and peer review: Not commissioned; externally peer reviewed.
Data availability statement: No data are available.
References
- 1. Palladino R, Tayu Lee J, Ashworth M, et al. Associations between multimorbidity, healthcare utilisation and health status: evidence from 16 European countries. Age Ageing 2016;45:431–5. 10.1093/ageing/afw044 [DOI] [PMC free article] [PubMed] [Google Scholar]
- 2. Fortin M, Stewart M, Poitras M-E, et al. A systematic review of prevalence studies on multimorbidity: toward a more uniform methodology. The Annals of Family Medicine 2012;10:142–51 https://doi.org/ 10.1370/afm.1337 [DOI] [PMC free article] [PubMed] [Google Scholar]
- 3. Cassell A, Edwards D, Harshfield A, et al. The epidemiology of multimorbidity in primary care: a retrospective cohort study. Br J Gen Pract 2018;68:e245–51 https://doi.org/ 10.3399/bjgp18X695465 [DOI] [PMC free article] [PubMed] [Google Scholar]
- 4. Hanlon P, Nicholl BI, Jani BD, et al. Frailty and pre-frailty in middle-aged and older adults and its association with multimorbidity and mortality: a prospective analysis of 493 737 UK Biobank participants. The Lancet Public Health 2018;3:e323–32 https://doi.org/ 10.1016/S2468-2667(18)30091-4 [DOI] [PMC free article] [PubMed] [Google Scholar]
- 5. Billings J, Blunt I, Steventon A, et al. Development of a predictive model to identify inpatients at risk of re-admission within 30 days of discharge (PARR-30). BMJ Open 2012;2:e001667 10.1136/bmjopen-2012-001667 [DOI] [PMC free article] [PubMed] [Google Scholar]
- 6. Huntley AL, Johnson R, Purdy S, et al. Measures of multimorbidity and morbidity burden for use in primary care and community settings: a systematic review and guide. Ann Fam Med 2012;10:134–41. 10.1370/afm.1363 [DOI] [PMC free article] [PubMed] [Google Scholar]
- 7. Roland M, Abel G. Reducing emergency admissions: are we on the right track? BMJ 2012;345:e6017 10.1136/bmj.e6017 [DOI] [PubMed] [Google Scholar]
- 8. From one to many Exploring people’s progression to multiple long-term conditions in an urban environment. Guy's and St Thomas' Charity. London, 2018. Available: https://www.gsttcharity.org.uk/sites/default/files/GSTTC_MLTC_Report_2018.pdf
- 9. NHS Digital Quality and outcomes framework (QOF) business rules v 38 2017-2018 October code release, 2018. Available: https://digital.nhs.uk/data-and-information/data-collections-and-data-sets/data-collections/quality-and-outcomes-framework-qof/quality-and-outcome-framework-qof-business-rules/quality-and-outcomes-framework-qof-business-rules-v-38-2017-2018-october-code-release
- 10. MedicinesComplete Joint formulary Committee: British National formulary (online). London: BMJ group and pharmaceutical press. Available: http://www.medicinescomplete.com
- 11. English Indices of Deprivation 2015 - LSOA Level Ministry of housing, communities and local government. London, 2018. Available: https://data.gov.uk/dataset/8f601edb-6974-417e-9c9d-85832dd2bbf2/english-indices-of-deprivation-2015-lsoa-level
- 12. Lambeth State of the Borough, 2016. London: Lambeth Council, 2017. https://www.lambeth.gov.uk/sites/default/files/State%20of%20Borough%202016%20-%20v3.pdf [Google Scholar]
- 13. Statacorp Stata statistical software: release 14 2015. Available: http://www.stata.com/
- 14. Brunson JC. Alluvial diagrams in ggplot2, 2018. Available: https://cran.r-project.org/web/packages/ggalluvial/vignettes/ggalluvial.html
- 15. Harwich E, Lasko-Skinner R. Making NHS data work for everyone. London: Reform, 2018. https://reform.uk/sites/default/files/2018-12/Making%20NHS%20data%20work%20for%20everyone%20WEB_1.pdf [Google Scholar]
- 16. Kendrick T, Stuart B, Newell C, et al. Changes in rates of recorded depression in English primary care 2003-2013: time trend analyses of effects of the economic recession, and the GP contract quality outcomes framework (QOF). J Affect Disord 2015;180:68–78. 10.1016/j.jad.2015.03.040 [DOI] [PubMed] [Google Scholar]
- 17. Barnett K, Mercer SW, Norbury M, et al. Epidemiology of multimorbidity and implications for health care, research, and medical education: a cross-sectional study. Lancet 2012;380:37–43. 10.1016/S0140-6736(12)60240-2 [DOI] [PubMed] [Google Scholar]
- 18. McLean G, Guthrie B, Mercer SW, et al. General practice funding underpins the persistence of the inverse care law: cross-sectional study in Scotland. Br J Gen Pract 2015;65:e799–805. 10.3399/bjgp15X687829 [DOI] [PMC free article] [PubMed] [Google Scholar]
- 19. Leiser S, Déruaz-Luyet A, N’Goran AA, et al. Determinants associated with deprivation in multimorbid patients in primary care-a cross-sectional study in Switzerland. PLoS One 2017;12:e0181534 10.1371/journal.pone.0181534 [DOI] [PMC free article] [PubMed] [Google Scholar]
- 20. McLean G, Gunn J, Wyke S, et al. The influence of socioeconomic deprivation on multimorbidity at different ages: a cross-sectional study. Br J Gen Pract 2014;64:e440–7. 10.3399/bjgp14X680545 [DOI] [PMC free article] [PubMed] [Google Scholar]
- 21. Lambeth Demographic factsheet, May 2015. Lambeth & Southwark's Public Health Intelligence Team, 2015. https://www.lambeth.gov.uk/sites/default/files/ssh-lambeth-demography-2015.pdf [Google Scholar]
- 22. Academy of medical sciences Multimorbidity: a priority for global health research. London, 2018. https://acmedsci.ac.uk/file-download/82222577 [Google Scholar]
- 23. Ruel G, Lévesque J-F, Stocks N, et al. Understanding the evolution of multimorbidity: evidences from the North West Adelaide health longitudinal study (NWAHS). PLoS One 2014;9:e96291 10.1371/journal.pone.0096291 [DOI] [PMC free article] [PubMed] [Google Scholar]
- 24. Xu X, Mishra GD, Dobson AJ, et al. Progression of diabetes, heart disease, and stroke multimorbidity in middle-aged women: a 20-year cohort study. PLoS Med 2018;15:e1002516 10.1371/journal.pmed.1002516 [DOI] [PMC free article] [PubMed] [Google Scholar]
- 25. St Sauver JL, Boyd CM, Grossardt BR, et al. Risk of developing multimorbidity across all ages in an historical cohort study: differences by sex and ethnicity. BMJ Open 2015;5:e006413 10.1136/bmjopen-2014-006413 [DOI] [PMC free article] [PubMed] [Google Scholar]
- 26. Ferraro KF, Schafer MH, Wilkinson LR. Childhood disadvantage and health problems in middle and later life: early imprints on physical health? Am Sociol Rev 2016;81:107–33. 10.1177/0003122415619617 [DOI] [PMC free article] [PubMed] [Google Scholar]
- 27. Link BG, Phelan J. Social conditions as fundamental causes of disease. J Health Soc Behav 1995;35:80–94. (Extra Issue) 10.2307/2626958 [DOI] [PubMed] [Google Scholar]
Associated Data
This section collects any data citations, data availability statements, or supplementary materials included in this article.
Supplementary Materials
bmjopen-2019-031649supp001.pdf (1.6MB, pdf)


