

Abstract
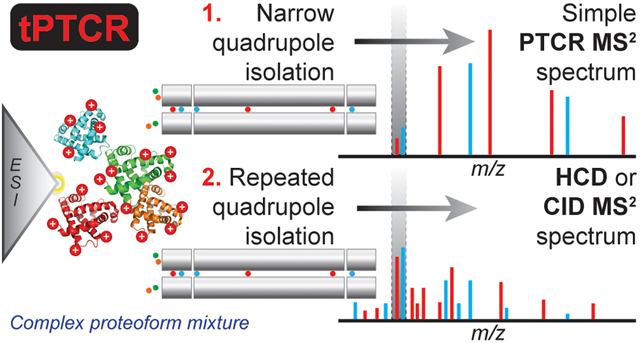
Despite the recent technological advances in Fourier transform mass spectrometry (FTMS) instrumentation, top-down proteomics (TDP) is currently mostly applied to the characterization of proteoforms <30 kDa due to the poor performance of high-resolution FTMS for the analysis of larger proteoforms and the high complexity of intact proteomes in the 30–60 kDa mass range. Here, we propose a novel data acquisition method based on ion–ion proton transfer, herein termed proton transfer charge reduction (PTCR), to investigate large proteoforms of Pseudomonas aeruginosa in a high-throughput fashion. We designed a data acquisition strategy, named tPTCR, which applies two consecutive gas phase fractionation steps for obtaining intact precursor masses: first, a narrow (1.5 m/z-wide) quadrupole filter m/z transmission window is used to select a subset of charge states from all ionized proteoform cations; second, this aliquot of protein cations is subjected to PTCR in order to reduce their average charge state: upon m/z analysis in an Orbitrap, proteoform mass spectra with minimal m/z peak overlap and easy-to-interpret charge state distributions are obtained, simplifying the proteoform mass calculation. Subsequently, the same quadrupole-selected narrow m/z region of analytes is subjected to collisional dissociation to obtain proteoform sequence information, which used in combination with intact mass information leads to proteoform identification through an off-line database search. The newly proposed method was benchmarked against the previously developed “medium/high” data-dependent acquisition strategy and doubled the number of UniProt entries and proteoforms >30 kDa identified on the liquid chromatography time scale.
Graphical Abstract
High expectations1 are currently placed on top-down proteomics (TDP),2,3 a mass spectrometry (MS)-based technology which entails the characterization of intact proteoforms.4 TDP can theoretically overcome5 the well-known “protein inference” problem afflicting bottom-up proteomics (BUP),6 while the so-called “proteoform hypothesis” posits that the direct analysis of the actual proteins present in a living system holds a much tighter mechanistic connection with biological processes than the analysis of their surrogates (i.e., proteolytic peptides).7,8 This represents the rationale for recent applications of TDP to biomedical and translational research.9-14 However, technological challenges have so far limited the use of TDP, as intact protein MS cannot match the analysis throughput typically obtainable through BUP (i.e., thousands of protein families identified in a single experiment).15 Despite the introduction of commercial instruments based on the Orbitrap Fourier transform mass spectrometry (FTMS)16 technology in 2005, which made high-resolution mass spectrometry available to the whole proteomic community, so far high-throughput TDP has been applied mainly to proteins <30 kDa.17-19 The major reason behind the limitation of FTMS-based TDP to the analysis of small proteins was formalized in 2011 by Compton et al.,20 who proposed a model describing how the signal dilution caused by a combination of isotopic and charge state effects increases rapidly (i.e., more than quadratically) with a protein’s mass. Consequently, when running high-resolution FTMS experiments (i.e., generating isotopically resolved spectra), the reduction in spectral signal-to-noise ratio (S/N) observed for large proteins (i.e., >30 kDa) is so pronounced as to practically impede large scale TDP. However, many proteomes of interest, including the human one, are primarily composed of proteins larger than 30 kDa (Figure S1). Therefore, extending the mass range for the proteoforms characterizable in high-throughput experiments has been one of the major objectives for TDP-focused research groups in the last years.21,22 Recently, we proposed a partial solution to this problem by introducing a novel data-dependent acquisition strategy termed “medium/high”: while fragmentation spectra are recorded using high resolving power like in standard acquisition methods, broadband spectra (MS1) are collected by averaging a large number (i.e., 10–15) of short time-domain transients (i.e., microscans) prior to Fourier transform. In this way, the S/N of MS1 spectra is substantially improved at the expense of resolving power, with the resulting non-isotopically resolved spectra leading to the determination of an average proteoform mass rather than the monoisotopic one. The medium/high data acquisition brought the identification of hundreds of large proteoforms (between 30 and 60 kDa) from human fibroblasts.23
Unfortunately, even the medium/high strategy has its own limitations. Specifically, despite prefractionation, the complexity of proteoform mixtures increases dramatically with the proteins’ mass. This is primarily due to the fact that larger proteins can, on average, carry a higher number of modifications, either chemical (such as post-translational modifications, PTMs) or genetic (arising from single nucleotide polymorphisms, presence of multiple isoforms, etc). Additionally, the reduced performance offered by singledimension nanoflow reversed-phase liquid chromatography (LC) for the separation of large biomolecules under MScompatible conditions (i.e., with formic acid replacing trifluoroacetic acid)24 further exacerbates the spectral complexity issue, as multiple proteoforms derived from the same gene typically coelute to then be ionized together in LC–MS experiments. Ultimately, considering that larger proteins are represented in the mass-over-charge (m/z) domain by a wider charge state distribution than smaller proteins when ionization is performed by electrospray (which increases the probability of signal overlap in the presence of multiple species), it becomes apparent that even reducing the resolution of broadband spectra might not be sufficient to distinguish the single components (proteoforms) present in a mass spectrum.
To improve the capability of detecting and distinguishing the different proteoforms, gas phase fractionation (GPF) has been used.25,26 Selected ion monitoring (SIM) cannot be applied as a GPF method for characterizing large proteins, because only a few charge states (typically 1 to 3, depending on SIM window width and protein mass) of each proteoform can be detected within a narrow SIM window: if charge states (and hence mass) cannot be determined using a charge state envelope, high resolution would be needed (to determine charge from isotope spacing), bringing back the aforementioned S/N issues affecting high-resolution spectral acquisition.23 Furthermore, this method would not mitigate the problem of overlapping signals due to coeluted analytes.
In the nineties, Stephenson and McLuckey described a series of ion–ion reactions in the gas phase27 using ion trap mass analyzers. In particular, they studied and developed the ion–ion proton transfer reaction, where a multiply charged cation is let to react with a singly charged anion (typically originated from a perfluorinated molecule) to generate a cation with reduced charge state and a neutral molecule (that produces no signal during m/z analysis), eq 1:28-31
| (1) |
Over the years, ion–ion proton transfer reactions have found several applications, most importantly to reduce the complexity of fragmentation spectra generated by electron transfer dissociation (ETD) by distributing charge-reduced product ions toward higher m/z values, where signal overlap is limited.32-34 However, this technique never became routinely applied to high-throughput proteomics of highly complex samples. Here, we describe the implementation of ion–ion proton transfer reaction, here termed proton transfer charge reduction (PTCR), on a modified tribrid Orbitrap mass spectrometer.35 The PTCR reagent inlet was designed as an add on to the front-end ETD reagent ion source previously equipping commercial tribrid mass spectrometers.36 The tribrid architecture allowed for the development of a targeted data acquisition strategy (here called “tPTCR”) which uses PTCR for improved GPF. In tPTCR experiments, the quadrupole m/z analyzer ensures the efficient transmission of proteoform cations over a very narrow m/z window to the central section of the high-pressure trap (HPT) of the dual region RF linear quadrupole ion trap (LTQ), followed by the pulsing on of the reagent ionization source and transmission of PTCR reagent anions from the front end reagent ion source to the front section of the HPT; the PTCR reaction is then performed in the HPT and resulting PTCR product cations are transferred to the Orbitrap mass analyzer to be m/z analyzed with high m/z accuracy. We tested the effectiveness of this data acquisition strategy by comparing it to the medium/high acquisition method for the analysis of large proteins (30–60 kDa) extracted from the bacterium Pseudomonas aeruginosa, which can theoretically express ~5500 different gene products one-third of which fall into the molecular weight (MW) window of interest (30–60 kDa, Figure S1).
EXPERIMENTAL SECTION
Cell Culture and Sample Preparation.
Pseudomonas aeruginosa PAO1 (ATCC15692) was grown in Mueller Hinton broth at 37 °C as previously described.37 Protein extraction followed a standard protocol and MW-based fractionation was performed using a GELFREE 8100 Fractionation System (Expedeon, Harston, Cambridgeshire, U.K.). Details are provided in the Supporting Information.
Liquid Chromatography.
Resuspended protein pellets were separated by reversed phase nanocapillary liquid chromatography (LC) using an Ultimate 3000 UHPLC system (Thermo Scientific, Sunnyvale, CA). About 1 μg of protein was injected per run. The monolithic column-based chromatographic setup and related gradient are described in the Supporting Information. The outlet of the analytical column was coupled through a 20 μm i.d. capillary to an EASY-Spray nano electrospray source (Thermo Scientific, San Jose, CA) where a 1.9–2.1 kV potential was applied for generating nano electrospray ionization.
Mass Spectrometry Analysis.
All mass spectrometry measurements were performed on a modified tribrid Orbitrap Fusion Lumos mass spectrometer (Thermo Scientific), equipped with PTCR capability. The PTCR reagent inlet delivered a regulated flow of perfluoroperhydrophenanthrene (PFPP, mass = 624 Da, Sigma Selectophore 56919) to the discharge ion source for anion production. A detailed description of the PTCR reagent inlet is provided in the Supporting Information. Proteomics data were recorded using two different data acquisition methods. The former is termed “medium/high” (hereinafter “med/hi” in short) and was previously described by Fornelli et al.23 Briefly, this is a data-dependent acquisition (DDA) method where the precursors are detected via “medium resolution” broadband MS1 spectra (resolving power of 7 500 at m/z 200), while fragmentation spectra of quadrupole-isolated precursors (m/z selection window width, 3 m/z units) are recorded at high resolution (60 000 at m/z 200). Ten microscans (time-domain transients) are averaged for each MS1 spectrum, while four microscans are used for MS2 fragmentation spectra. Fragmentation is performed via higher-energy collisional dissociation (HCD).38 In this implementation, automatic gain control (AGC) target values for MS1 and MS2 were set to 2 × 10⁵ and 5 × 10⁵ charges, respectively. Dynamic exclusion (60 s) was applied. The second method is based on PTCR and is a targeted method (hereinafter referred to as “tPTCR”). This method is based solely on MS2-level data acquisition (both for retrieving proteoforms’ intact masses through PTCR and sequence information via collisional dissociation, vide infra). As shown in Figure 1, the instrument acquisition cycle is composed of two segments that are repeated twice per cycle. Each segment comprises a targeted PTCR MS2 event and a subsequent associated targeted fragmentation MS2 event (performed either via HCD or resonant collision-induced dissociation, CID). Both PTCR and HCD/CID MS2 events in one segment use the same quadrupole narrow m/z selection window (width, 1.5 m/z). To perform PTCR, protein cations are first m/z selected in the quadrupole m/z filter, accumulated, and stored in the center section of the HPT of the quadrupole linear ion trap (LTQ). The reagent source is then pulsed on, instrument ion path voltages are altered to enable transmission of anions, the PTCR reagent ions are m/z selected in the quadrupole m/z filter, accumulated, and stored in the front section of the LTQ HPT. After cessation of accumulation of the reagent ions, the RF and DC voltages on the HPT are adjusted (RF-only trapping) so the protein precursor cations and the PTCR reagent anions are coconfined and allowed to react for 5–8 ms before the trapping voltages are adjusted again to eliminate the reagent ion ceasing the PTCR ion–ion reactions (Figure S2). After completion of the PTCR reaction, charge-reduced protein cations are transferred to the Orbitrap mass analyzer for medium resolution m/z analysis (resolving power, 7 500 at m/z 200). Typical target values for the proteomics experiments were 5 × 10⁶ charges for PTCR reagent (maximum injection time, 200 ms) and 5 × 10⁵ charges for the precursor (maximum injection time, 800 ms). The ensuing associated fragmentation (HCD or CID) scan is recorded at high resolution (resolving power, 60 000 at m/z 200) and uses the same quadrupole m/z selection window of the previous scan, with an AGC target for the precursor of 5 × 10⁵ charges. When this segment is repeated, the isolation window center is shifted by 1.5 m/z units (to higher values), so that a single LC–MS run should theoretically sample all protein cations with at least one charge state of appreciable intensity falling within the investigated 3 m/z units. For the full investigation of proteins from a single GELFrEE fraction, a total of 27 m/z units are sampled over 9 LC–MS runs (Table S1). For both med/hi and tPTCR methods, the normalized collision energy (NCE) for HCD was set at 19%, while NCE for CID was set between 30 and 35%. The inlet capillary temperature was set at 320 °C, and in-source CID was applied through a 15 V offset between SRIG and MP00. The instrument was operating in “protein mode” with reduced N2 pressure in the HCD cell (2–3 mTorr).39,40
Figure 1.

Design and rationale for tPTCR data acquisition. (A) Schematics of the data acquisition time: two cycles of PTCR and collisional fragmentation are performed in each experiment (i.e., LC–MS run). Within each cycle, both PTCR MS2 and the following fragmentation MS2 are based on the same 1.5 m/z-wide quadrupole selection window. The isolation center is then shifted by 1.5 m/z for the next cycle (in this example, from m/z 861.5 to m/z 863). (B) Fraction of the intact proteome in the 30–60 kDa mass range theoretically isolated (based on at least one charge state) as a function of the isolation window width and center (expressed in m/z units). The fraction is expressed as “% isolated” according to the color legend. Total number of theoretical proteins considered: 3001.
Experimental Design and Data Analysis.
Each sample (i.e., GELFrEE fraction) was injected multiple times: for med/hi LC–MS experiments, a minimum of three injections (i.e., technical replicates) to a maximum of nine were run (see the Results and Discussion for further details). In tPTCR experiments, sample injections were nine per sample, with each LC–MS run using two different m/z selection windows (Table S1). The two data sets, med/hi and tPTCR-based, were analyzed through the supercomputing-based TDPortal environment provided by the National Resources for Translational and Developmental Proteomics (NRTDP) at Northwestern University. The database search (based on an UniProt-curated flat file for P. aeruginosa PAO1) was performed as previously described for med/hi RAW files and further adapted to function on tPTCR-based RAW files (see the Supporting Information). For all RAW files, medium resolution spectra (i.e., non-isotopically resolved) were deconvoluted using the kDecon algorithm, while high-resolution spectra (i.e., MS2 fragmentation spectra) were deconvoluted with Xtract (Thermo Scientific). For both data sets, grouped precursor mass + fragment masses were used for searching a proteoform database constructed on-the-fly by allowing up to 11 modifications (among those annotated in UniProt) per proteoform. When multiple precursors were coisolated, separate searches were performed using individual precursor masses. Database search parameters are provided in the Supporting Information. Proteoforms passing the 1% false-discovery rate (FDR) cutoff41 were associated with a p-score, an E-value, and a C-score.42 Results were exported as .tdReport files that can be visualized using TDViewer, freely downloadable at http://topdownviewer.northwestern.edu.
RESULTS AND DISCUSSION
Design of a Targeted PTCR-Based Acquisition Strategy for Top-Down MS.
A schematic representation of the targeted data acquisition method is shown in Figure 1A. Rather than detecting all species present across a large m/z window to subsequently select them for fragmentation based on their relative abundances (i.e., as during data-dependent acquisition), in targeted PTCR (tPTCR) experiments the analytes are investigated always using a narrow m/z selection window (1.5 m/z-wide) corresponding to a first step of GPF. Unlike data-independent acquisition, where only fragmentation spectra are recorded,43 the tPTCR method retrieves information about the intact precursor masses by performing PTCR on all cations transmitted through the narrow quadrupole m/z selection window, while in a separate and subsequent event, ions from the same m/z selection window are subjected to collisional fragmentation (CID or HCD) to provide proteoform sequence information. PTCR products are analyzed in the Orbitrap at “medium” resolving power (i.e., 7 500 at m/z 200, leading to determination of proteoform average masses), while fragmentation spectra are recorded at high resolution (i.e., for monoisotopic mass determination of product ions). After the first, a second tPTCR cycle is performed shifting the m/z selection window of 1.5 m/z units. The choice of two tPTCR cycles per LC run is explained based on the time required to complete a single cycle, which is ~10 s (vide infra). Due to the very limited m/z space investigated in a single tPTCR run, multiple experiments have to be performed to theoretically obtain chemical information (i.e., to encounter at least one charge state per proteoform) for all the proteins falling in the MW range of interest (i.e., 30–60 kDa). Theoretical calculations suggest that for large proteins it is necessary to sample about 25 m/z units when centering the isolation windows around 850–900 m/z, Figure 1B. For our simulations we considered a total of 3001 distinct proteins, with mass increased in steps of 10 Da within the 30–60 kDa mass range. The results presented in Figure 1B were based on a model to calculate protein charge state distributions as a function of the protein mass (using a Gaussian distribution),20 with the highest intensity charge state in the distribution calculated (as the closest integer) considering 1 charge per kDa of mass. Such results are substantially confirmed when the simulation was repeated by simply considering all the theoretical charge states between 5+ and 60+ that the same 3001 theoretical proteins could produce within a 700–1500 m/z window (see Figure S3 for details). The 850–900 m/z window center was selected for tPTCR runs based on the analysis of experimental data from previous studies23 that showed that the highest intensity charge states for most proteins ionized by nanoflow electrospray were localized in that m/z region. As reported in Table S1, the final m/z region analyzed through tPTCR experiments in the present studies was comprised between m/z 860.75 and 887.75, corresponding to 27 m/z units sampled across 9 LC–MS runs.
PTCR Simplifies Spectra for Efficiently Detecting Large Protein Cations.
After prefractionation via GELFrEE (Figure S4), proteins were analyzed using both the med/hi and the tPTCR strategies. A single GELFrEE fraction, fraction 7, was used for a preliminary comparison of the two data acquisition methods. Figure 2A shows a typical broadband mass spectrum recorded in the middle of the sample chromatographic elution (min 52). Although the presence of an extremely complex mixture of different proteoforms can be presumed, it is hard to visually distinguish individual charge state envelopes. Off-line deconvolution of this medium-resolution MS1 spectrum returned one proteoform mass. Figure 2B-D shows the PTCR MS2 spectra obtained at the same elution time using three 1.5 m/z-wide quadrupole selection windows centered at m/z 878, 879.5, and 882.5, respectively. In these PTCR MS2 spectra, multiple charge state distributions were clearly distinguishable after PTCR and the Advanced Peak Determination algorithm44 was able to assign the charge states of the most abundant proteoforms on-the-fly. The off-line deconvolution of the three PTCR MS2 spectra depicted in panels B, C, and D returned four, three, and three unique masses, respectively. Shifting the center of the m/z selection windows used for PTCR MS2 allowed for the detection of proteoforms otherwise not clearly distinguishable. As a confirmation of the capability of the dual GPF strategy (i.e., narrow quadrupole selection followed by PTCR) to detect large proteoforms, Figure S5 shows the PTCR MS2 total ion chromatogram (TIC) traces for GELFrEE fraction 7 obtained by shifting the center of m/z selection windows from 861.5 to 869 m/z in six 1.5 m/z-wide steps (i.e., equivalent to three LC–MS runs). The TIC traces all look unique, suggesting that different proteoforms were selected and subsequently detected in the six PTCR MS2 experiments.
Figure 2.

Comparison between broadband MS1 and PTCR MS2 spectra for the detection of large proteoforms from GELFrEE fraction 7. MS1 is used for med/hi data acquisition, while PTCR MS2 is used for tPTCR experiments. Both types of spectra were recorded at 7 500 resolving power (at m/z 200). (A) MS1 spectrum at 52 min retention time (TIC chromatogram in the inset). (B, C, and D) PTCR MS2 spectra obtained by quadrupole selection of analyte cations around m/z 878, 879.5, and 882.5, respectively, at the same elution time.
tPTCR Increasing of Proteoform Identifications.
To demonstrate the value of the tPTCR data acquisition strategy for proteoform identification, we performed a database search comparing med/hi and tPTCR data sets acquired using GELFrEE fraction 7 (expected protein MW estimated by SDSPAGE, ~25–40 kDa, Figure S4). As a full tPTCR experimental set requires nine LC–MS runs (to sample a total 27 m/z-wide window), nine technical replicates were acquired using the med/hi method to provide a fair comparison. Ultimately, the PTCR-based acquisition drastically outperformed the standard DDA med/hi method, leading to an increase of +74% in UniProt entries (67 vs 117 for med/hi and PTCR, respectively) and +47% in unique proteoforms (94 vs 138), both identified at 1% FDR. Notably, Figure 3A shows that while the tPTCR-based acquisition strategy returned more identifications of the DDA counterpart across the entire mass range of the identified proteoforms (6.9–56.9 kDa), the new method was particularly more effective than med/hi for identifying larger proteins (>25 kDa). Interestingly, when comparing the number of new UniProt entries identified in each consecutive LC–MS run, it is apparent how the DDA med/hi method rapidly reaches a plateau (the first three technical replicates produced 60 out of the 67 total identifications). Conversely, the tPTCR method returns fewer protein identifications per run but with the number of new identifications growing almost linearly across the nine total experiments because each successive LC–MS run interrogates a new region of the proteoform (i.e., m/z) space (Figure 3B). Therefore, while a strategy based on nine consecutive LC injections using a med/hi DDA method would be highly inefficient (89.5% of the total protein identifications were generated within three runs, with the last two of this series not adding a single new UniProt entry) and triplicate injections would therefore represent an optimized use of instrument time, the extra acquisition time spent to sample the 27 m/z units over nine tPTCR runs seems fully justified.
Figure 3.

Comparison of database search results for nine DDA med/hi (blue) vs nine tPTCR (red) LC–MS runs based on GELFrEE fraction 7. Both data acquisition methods used HCD for proteoform fragmentation. (A) Mass distribution of the 94 and 138 unique proteoforms identified at 1% FDR by med/hi and tPTCR, respectively. (B) Number of newly identified UniProt accession numbers from each of the consecutive nine LC–MS runs using the two data acquisition methods. Med/hi and tPTCR identified 67 and 117 UniProt entries at 1% FDR, respectively.
We then sought to optimize the tPTCR method by identifying the best fragmentation method for large proteoforms in high-throughput TDP: HCD was used when the med/hi strategy was originally developed to investigate 30–60 kDa proteoforms as it was the only ion activation technique available on a Q Exactive mass spectrometer.23 However, tribrid Orbitrap instruments offer a variety of ion activation methods,45 and we used proteins from GELFrEE Fraction 8 to compare HCD with resonant collision-induced dissociation (CID) performed in the LTQ and also with CID followed by PTCR (an MS3 experiment aimed at spreading multiply charged fragment ions along the m/z axis, Figure S6). As illustrated in Figure S7, based on duplicate tPTCR runs (isolation window centered on 882.5 and 884 m/z), CID resulted as the best fragmentation technique. The comparative mass distribution of proteoforms identified with the three fragmentation methods, shown in Figure S8, suggests that CID, alone or followed by PTCR, outperformed HCD particularly when characterizing large proteoforms. It is worthwhile to underscore that the HCD algorithm implemented in the version of the instrument control software used for those experiments (Tune 3.0) does not compensate for high charge states when calculating the actual axial acceleration in the HCD cell, therefore overfragmentation of protein cations is more likely than in slow-heating CID even when the normalized collision energy for HCD is kept low (we used NCE = 19%, a particularly low value when compared to both BUP and even 0–30 kDa TDP studies).10,15,17 The CID-PTCR MS3 method likely returned fewer identifications than the CID MS2 one due to a ~35% average reduction in signal intensity of fragment spectra. Even using CID MS2, a large fraction (~50%) of PTCR-determined intact masses could not be associated with a confident proteoform identification due to poor quality of related fragmentation spectra.
Characterization of Four High-Molecular Weight GELFrEE Fractions.
A full top-down MS characterization of the P. aeruginosa proteome in the 30–60 kDa mass range was finally performed by analyzing GELFrEE fractions 6–9 via tPTCR using CID as the fragmentation method. For comparison, each of the four GELFrEE fractions was also analyzed by DDA med/hi (with HCD fragmentation, according to its original development)23 in triplicate. A summary of the results is displayed in Figure 4. The DDA med/high method led to the identification of 85 UniProt entries, while the tPTCR method to 192 identifications at 1% FDR (a + 125% increase). Notably, of the total 217 UniProt entries collectively identified, only a small group (25, corresponding to 29% of those identified by the med/hi method and 12% of the total) was identified uniquely by DDA med/hi (Figure 4A). Regarding unique proteoforms, the tPTCR method returned more identifications across the whole mass range considered (Figure 4B), and it allowed to pass from the 102 unique proteoforms identified by med/hi at 1% FDR to 230 (+125% increase). In tPTCR experiments, 123 identified proteoforms had mass >30 kDa (54% of the total). Notably, tPTCR data acquisition cycle was found to be substantially slower than DDA med/hi one: from the analysis of all 36 RAW files used for the analysis of the four high MW GELFrEE fractions, the average time spent for performing the two targeted PTCR MS2 events and the two CID MS2 events is ~20 s, whereas for the 12 recorded DDA med/hi RAW files the average data acquisition time (composed of one MS1 and two HCD MS2 events) required an average of 10 s. This difference, which is readily explained by the injection time required for accumulating a large number of charges using a very narrow m/z selection window in tPTCR experiments, makes the boost in performance obtained by tPTCR even more remarkable.
Figure 4.

Results comparison from the analysis of GELFrEE fractions 6–9 of P. aeruginosa using med/high (blue) and tPTCR (red) LC–MS data acquisition. Three technical replicates per sample were used when testing DDA med/high (with HCD), versus nine LC–MS run/GELFrEE fraction using tPTCR (with CID). (A) Venn diagram of the UniProt entries identified at 1% FDR and (B) mass distribution for the 102 and 230 unique proteoforms identified at 1% FDR by med/hi and tPTCR, respectively.
CONCLUSIONS
We presented here the first application of PTCR specifically designed for facilitating the high-throughput top-down analysis of large proteoforms by Orbitrap FTMS. The described tPTCR strategy heavily outperforms the previous state-of-the-art for TDP of large proteoforms represented by medium/high DDA, which was the only data acquisition method rivaling results achieved by customized instrumentation such as the 21 T Fourier transform ion cyclotron resonance (FT-ICR) mass spectrometer at the National High Magnetic Field Lab (that in a recent study led to the identification of 228 human proteoforms >30 kDa)46 using commercial Orbitrap instruments. Furthermore, tPTCR has the merit of unveiling the true complexity (that until now could only be speculated) of intact proteomes beyond the 30 kDa barrier. Significantly, the results of this study were not obtained by “simply” increasing the capabilities and performance of high-resolution and m/z accuracy instrumentation, certainly an aspect of pivotal importance that is leveraged particularly by bottom-up proteomics, but by implementing an ad hoc data acquisition method for TDP based on sophisticated manipulation of ions in the gas phase. Data acquisition strategies alternative to the most commonly applied data-dependent acquisition (DDA) are emerging within the TDP community, and data-independent fragmentation has been tested in the past in several top-down MS studies;47,48 however, those works relied on the in-source fragmentation of all intact proteoforms ionized simultaneously after LC elution, with no m/z filtering and limited possibility of obtaining precursor information. Differently, we opted for a dual GPF strategy (i.e., narrow m/z selection of precursors using a quadrupole m/z filter followed by PTCR) for reducing spectral complexity. Our data acquisition method allowed the analysis of large biomolecules >30 kDa in a large-scale fashion, and unlike DDA med/hi acquisition, which reaches the vast majority of the total identifications it is capable of after only a few technical replicates, tPTCR returns new identifications through each LC–MS experiment by shifting the applied m/z selection windows, demonstrating that GPF can contribute to top-down proteomics in a similar manner to sophisticated multidimensional liquid phase separations.49-51 Finally, considering the recent successful implementation of parallel ion parking in top-down proteomic experiments,52 we expect that in the near future tPTCR will become an even more powerful strategy for the analysis of complex protein mixtures. With a reagent source and an ion trapping device as the only hardware modifications/requirements, the tPTCR strategy could be implemented in many top-down capable MS platforms (e.g., selected q-TOFs and FT-ICR instruments); furthermore, our experiments can be directly reproduced using the latest generation of Tribrid Orbitrap mass spectrometers (Orbitrap Eclipse Tribrid), which includes the here described PTCR source along with a redesigned linear ion trap optimized for such ion–ion reactions.
Supplementary Material
ACKNOWLEDGMENTS
The work performed in this study was supported by The National Institute of General Medical Sciences, under Grant P41 GM108569.
Footnotes
Supporting Information
The Supporting Information is available free of charge at https://pubs.acs.org/doi/10.1021/acs.analchem.9b03925.
Extended experimental section, list of isolation windows for tPTCR experiments, protein mass distribution in human and P. aeruginosa proteomes, schematics of a PTCR experiment, isolation window required to obtain protein information in the 30–60 kDa mass range, GELFrEE fractionation of P. aeruginosa proteins, total ion chromatograms of six PTCR MS2 experiments, identification of a 35.2 kDa proteoform by different fragmentations, identifications in tPTCR experiments using different ion fragmentations, and mass distribution of proteoforms identified by different ion fragmentations in tPTCR experiments (PDF)
The authors declare the following competing financial interest(s): R.H., C.M., K.S., V.Z., and J.E.P.S. are Thermo Scientific employees. Several authors are involved in the commercialization of the software with Thermo Scientific.
REFERENCES
- (1).Fornelli L; Toby TK; Schachner LF; Doubleday PF; Srzentic K; DeHart CJ; Kelleher NL J. Proteomics 2018, 175, 3–4. [DOI] [PMC free article] [PubMed] [Google Scholar]
- (2).Toby TK; Fornelli L; Kelleher NL Annu. Rev. Anal. Chem 2016, 9, 499–519. [DOI] [PMC free article] [PubMed] [Google Scholar]
- (3).Chen B; Brown KA; Lin Z; Ge Y Anal. Chem 2018, 90, 110–127. [DOI] [PMC free article] [PubMed] [Google Scholar]
- (4).Smith LM; Kelleher NL Nat. Methods 2013, 10, 186–187. [DOI] [PMC free article] [PubMed] [Google Scholar]
- (5).Compton PD; Kelleher NL; Gunawardena J J. Proteome Res 2018, 17, 2727–2734. [DOI] [PMC free article] [PubMed] [Google Scholar]
- (6).Nesvizhskii AI; Aebersold R Mol. Cell. Proteomics 2005, 4, 1419–1440. [DOI] [PubMed] [Google Scholar]
- (7).Aebersold R; Agar JN; Amster IJ; Baker MS; Bertozzi CR; Boja ES; Costello CE; Cravatt BF; Fenselau C; Garcia BA; Ge Y; Gunawardena J; Hendrickson RC; Hergenrother PJ; Huber CG; Ivanov AR; Jensen ON; Jewett MC; Kelleher NL; Kiessling LL; et al. Nat. Chem. Biol 2018, 14, 206–214. [DOI] [PMC free article] [PubMed] [Google Scholar]
- (8).Smith LM; Kelleher NL Science 2018, 359, 1106–1107. [DOI] [PMC free article] [PubMed] [Google Scholar]
- (9).Ntai I; Fornelli L; DeHart CJ; Hutton JE; Doubleday PF; LeDuc RD; van Nispen AJ; Fellers RT; Whiteley G; Boja ES; Rodriguez H; Kelleher NL Proc. Natl. Acad. Sci. U. S. A 2018, 115, 4140–4145. [DOI] [PMC free article] [PubMed] [Google Scholar]
- (10).Toby TK; Fornelli L; Srzentic K; DeHart CJ; Levitsky J; Friedewald J; Kelleher NL Nat. Protoc 2019, 14, 119–152. [DOI] [PMC free article] [PubMed] [Google Scholar]
- (11).Wang Z; Liu X; Muther J; James JA; Smith K; Wu S Sci. Rep 2019, 9, 2345. [DOI] [PMC free article] [PubMed] [Google Scholar]
- (12).Seckler HDS; Fornelli L; Mutharasan RK; Thaxton CS; Fellers R; Daviglus M; Sniderman A; Rader D; Kelleher NL; Lloyd-Jones DM; Compton PD; Wilkins JT J. Proteome Res 2018, 17, 2156–2164. [DOI] [PMC free article] [PubMed] [Google Scholar]
- (13).Cai W; Hite ZL; Lyu B; Wu Z; Lin Z; Gregorich ZR; Messer AE; McIlwain SJ; Marston SB; Kohmoto T; Ge Y J. Mol. Cell. Cardiol 2018, 122, 11–22. [DOI] [PMC free article] [PubMed] [Google Scholar]
- (14).Gao L; Gregorich ZR; Zhu W; Mattapally S; Oduk Y; Lou X; Kannappan R; Borovjagin AV; Walcott GP; Pollard AE; Fast VG; Hu X; Lloyd SG; Ge Y; Zhang J Circulation 2018, 137, 1712–1730. [DOI] [PMC free article] [PubMed] [Google Scholar]
- (15).Hebert AS; Richards AL; Bailey DJ; Ulbrich A; Coughlin EE; Westphall MS; Coon JJ Mol. Cell. Proteomics 2014, 13, 339–347. [DOI] [PMC free article] [PubMed] [Google Scholar]
- (16).Scigelova M; Hornshaw M; Giannakopulos A; Makarov A Mol. Cell. Proteomics 2011, 10, M111.009431. [DOI] [PMC free article] [PubMed] [Google Scholar]
- (17).Durbin KR; Fornelli L; Fellers RT; Doubleday PF; Narita M; Kelleher NL J. Proteome Res 2016, 15, 976–982. [DOI] [PMC free article] [PubMed] [Google Scholar]
- (18).Ahlf DR; Compton PD; Tran JC; Early BP; Thomas PM; Kelleher NL J. Proteome Res 2012, 11, 4308–4314. [DOI] [PMC free article] [PubMed] [Google Scholar]
- (19).Ansong C; Wu S; Meng D; Liu X; Brewer HM; Deatherage Kaiser BL; Nakayasu ES; Cort JR; Pevzner P; Smith RD; Heffron F; Adkins JN; Pasa-Tolic L Proc. Natl. Acad. Sci. U. S. A 2013, 110, 10153–10158. [DOI] [PMC free article] [PubMed] [Google Scholar]
- (20).Compton PD; Zamdborg L; Thomas PM; Kelleher NL Anal. Chem 2011, 83, 6868–6874. [DOI] [PMC free article] [PubMed] [Google Scholar]
- (21).Cai W; Tucholski T; Chen B; Alpert AJ; McIlwain S; Kohmoto T; Jin S; Ge Y Anal. Chem 2017, 89, 5467–5475. [DOI] [PMC free article] [PubMed] [Google Scholar]
- (22).Schaffer LV; Tucholski T; Shortreed MR; Ge Y; Smith LM Anal. Chem 2019, 91, 10937–10942. [DOI] [PMC free article] [PubMed] [Google Scholar]
- (23).Fornelli L; Durbin KR; Fellers RT; Early BP; Greer JB; LeDuc RD; Compton PD; Kelleher NL J. Proteome Res 2017, 16, 609–618. [DOI] [PMC free article] [PubMed] [Google Scholar]
- (24).Shou WZ; Naidong W J. Chromatogr. B: Anal. Technol. Biomed. Life Sci 2005, 825, 186–192. [DOI] [PubMed] [Google Scholar]
- (25).Spahr CS; Davis MT; McGinley MD; Robinson JH; Bures EJ; Beierle J; Mort J; Courchesne PL; Chen K; Wahl RC; Yu W; Luethy R; Patterson SD Proteomics 2001, 1, 93–107. [DOI] [PubMed] [Google Scholar]
- (26).Davis MT; Spahr CS; McGinley MD; Robinson JH; Bures EJ; Beierle J; Mort J; Yu W; Luethy R; Patterson SD Proteomics 2001, 1, 108–117. [DOI] [PubMed] [Google Scholar]
- (27).Pitteri SJ; McLuckey SA Mass Spectrom. Rev 2005, 24, 931–958. [DOI] [PubMed] [Google Scholar]
- (28).Stephenson JL Jr.; McLuckey SA Anal. Chem 1996, 68, 4026–4032. [DOI] [PubMed] [Google Scholar]
- (29).Stephenson JL; McLuckey SA J. Am. Chem. Soc 1996, 118, 7390–7397. [Google Scholar]
- (30).Stephenson JL; McLuckey SA Int. J. Mass Spectrom. Ion Processes 1997, 165, 419–431. [Google Scholar]
- (31).Stephenson JL; Van Berkel GJ; McLuckey SA J. Am. Soc. Mass Spectrom 1997, 8, 637–644. [Google Scholar]
- (32).Anderson LC; English AM; Wang WH; Bai DL; Shabanowitz J; Hunt DF Int. J. Mass Spectrom 2015, 377, 617–624. [DOI] [PMC free article] [PubMed] [Google Scholar]
- (33).Anderson LC; Karch KR; Ugrin SA; Coradin M; English AM; Sidoli S; Shabanowitz J; Garcia BA; Hunt DF Mol. Cell. Proteomics 2016, 15, 975–988. [DOI] [PMC free article] [PubMed] [Google Scholar]
- (34).Coon JJ; Ueberheide B; Syka JEP; Dryhurst DD; Ausio J; Shabanowitz J; Hunt DF Proc. Natl. Acad. Sci. U. S. A 2005, 102, 9463–9468. [DOI] [PMC free article] [PubMed] [Google Scholar]
- (35).Senko MW; Remes PM; Canterbury JD; Mathur R; Song Q; Eliuk SM; Mullen C; Earley L; Hardman M; Blethrow JD; Bui H; Specht A; Lange O; Denisov E; Makarov A; Horning S; Zabrouskov V Anal. Chem 2013, 85, 11710–11714. [DOI] [PubMed] [Google Scholar]
- (36).Earley L; Anderson LC; Bai DNL; Mullen C; Syka JEP; English AM; Dunyach JJ; Stafford GC; Shabanowitz J; Hunt DF; Compton PD Anal. Chem 2013, 85, 8385–8390. [DOI] [PMC free article] [PubMed] [Google Scholar]
- (37).Durbin KR; Fellers RT; Ntai I; Kelleher NL; Compton PD Anal. Chem 2014, 86, 1485–1492. [DOI] [PMC free article] [PubMed] [Google Scholar]
- (38).Olsen JV; Macek B; Lange O; Makarov A; Horning S; Mann M Nat. Methods 2007, 4, 709–712. [DOI] [PubMed] [Google Scholar]
- (39).Scheffler K; Viner R; Damoc E J. Proteomics 2018, 175, 42–55. [DOI] [PubMed] [Google Scholar]
- (40).Fornelli L; Ayoub D; Aizikov K; Liu X; Damoc E; Pevzner PA; Makarov A; Beck A; Tsybin YO J. Proteomics 2017, 159, 67–76. [DOI] [PMC free article] [PubMed] [Google Scholar]
- (41).LeDuc RD; Fellers RT; Early BP; Greer JB; Shams DP; Thomas PM; Kelleher NL Mol. Cell. Proteomics 2019, 18, 796–805. [DOI] [PMC free article] [PubMed] [Google Scholar]
- (42).LeDuc RD; Fellers RT; Early BP; Greer JB; Thomas PM; Kelleher NL J. Proteome Res 2014, 13, 3231–3240. [DOI] [PMC free article] [PubMed] [Google Scholar]
- (43).Chapman JD; Goodlett DR; Masselon CD Mass Spectrom. Rev 2014, 33, 452–470. [DOI] [PubMed] [Google Scholar]
- (44).Hebert AS; Thoing C; Riley NM; Kwiecien NW; Shiskova E; Huguet R; Cardasis HL; Kuehn A; Eliuk S; Zabrouskov V; Westphall MS; McAlister GC; Coon JJ Anal. Chem 2018, 90, 2333–2340. [DOI] [PMC free article] [PubMed] [Google Scholar]
- (45).Fornelli L; Srzentic K; Huguet R; Mullen C; Sharma S; Zabrouskov V; Fellers RT; Durbin KR; Compton PD; Kelleher NL Anal. Chem 2018, 90, 8421–8429. [DOI] [PMC free article] [PubMed] [Google Scholar]
- (46).Anderson LC; DeHart CJ; Kaiser NK; Fellers RT; Smith DF; Greer JB; LeDuc RD; Blakney GT; Thomas PM; Kelleher NL; Hendrickson CL J. Proteome Res 2017, 16, 1087–1096. [DOI] [PMC free article] [PubMed] [Google Scholar]
- (47).Lakshmanan R; Wolff JJ; Alvarado R; Loo JA Proteomics 2014, 14, 1271–1282. [DOI] [PMC free article] [PubMed] [Google Scholar]
- (48).Patrie SM; Ferguson JT; Robinson DE; Whipple D; Rother M; Metcalf WW; Kelleher NL Mol. Cell. Proteomics 2006, 5, 14–25. [DOI] [PubMed] [Google Scholar]
- (49).Tucholski T; Knott SJ; Chen B; Pistono P; Lin Z; Ge Y Anal. Chem 2019, 91, 3835–3844. [DOI] [PMC free article] [PubMed] [Google Scholar]
- (50).Wu Q; Yuan H; Zhang L; Zhang Y Anal. Chim. Acta 2012, 731, 1–10. [DOI] [PubMed] [Google Scholar]
- (51).Tran JC; Zamdborg L; Ahlf DR; Lee JE; Catherman AD; Durbin KR; Tipton JD; Vellaichamy A; Kellie JF; Li M; Wu C; Sweet SM; Early BP; Siuti N; LeDuc RD; Compton PD; Thomas PM; Kelleher NL Nature 2011, 480, 254–258. [DOI] [PMC free article] [PubMed] [Google Scholar]
- (52).Ugrin SA; English AM; Syka JEP; Bai DL; Anderson LC; Shabanowitz J; Hunt DF J. Am. Soc. Mass Spectrom 2019, 30, 2163–2173. [DOI] [PMC free article] [PubMed] [Google Scholar]
Associated Data
This section collects any data citations, data availability statements, or supplementary materials included in this article.