

Abstract
Aim:
The present study was done to evaluate and compare the stability of the implant and the loss of crestal bone in the implants placed using OD drilling and traditional drilling technique.
Setting and Design:
In vivo-comparative study.
Materials and Methods:
A total of 20 implants were placed in the anterior maxilla, and the patients were divided into two groups. In Group I, the implants were placed using traditional drilling technique, and in Group II, implant placement was done using OD drilling technique. Primary stability was measured in both the groups at baseline (immediate postoperative), and at an interval of 6 months, while crestal bone levels were measured at baseline, 6, and 8 months.
Statistical Analysis Used:
The data obtained were subjected to unpaired t-test to make intergroup comparisons, while one-way ANOVA F-test was used to make intragroup comparisons.
Results:
The primary stability of implant placed using OD drills was found to be slightly higher than implant placed with traditional drilling; however, there was no statistical significance (P > 0.05). When the data obtained for crestal bone levels were statistically analyzed, no significant difference between the two groups was obtained (P > 0.05).
Conclusion:
Within the limitations of this study following conclusions were drawn: there was no statistically significant difference in implant stability between the traditional drilling and OD drilling (P < 0.05). On comparison of crestal bone levels between OD and traditional drilling, no statistically significant difference was found between the two groups (P < 0.05).
Keywords: Crestal bone levels, implant stability, osseodensification, resonance frequency analysis
INTRODUCTION
Immediate loading has revolutionized implant dentistry by fulfilling the patients need for restoration of the edentulous site without much delay. However, the decisive factor for immediate loading is an optimum primary stability[1] which in turn is effected mostly by the surgical procedures and the quality of the bone. Maintaining bone bulk and density during implant site preparation is essential for initial bone-implant contact and biomechanical stability. Hence, in order to achieve an optimum stability to allow for immediate loading, an adequate volume of bone in the implant bed is essential. The challenges for achieving primary stability are often found in maxilla where bone is deficient both in terms of quality and quantity. However, there are several surgical techniques introduced in the past for enhancing primary stability in such low-density areas. Undersizing the osteotomy is a common practice, especially in narrow ridges to preserve bone bulk and to achieve increase in the primary stability; however, undersizing the osteotomy does creates a high degree of bone mechanical strain.[2] Drilling protocol as a whole, be it undersizing osteotomy or conventional method for dental implant placement, has several drawbacks such as heat generation and bone removal, which worsens the stability in low-density bone. Osteotome technique is one of the alternatives, which was introduced by Summers et al.[3] for low-density bone, particularly the maxilla. This technique compresses the trabecular bone laterally and apically with minimal trauma, leading to improved bone density.[4] Although alveolar ridge expansion is achieved by the osteotome technique, the pressure exerted on the crestal cortical bone could cause increased peri-implant marginal bone loss, which eventually decreases secondary stability.[5] The osteotomy preparation with the traditional drill is subtractive which cut the bone and produce osteotomies which are elongated and elliptical in shape due to chatter of the drills. A new concept for osteotomy preparation known as osseodensification (OD) utilizes custom-designed burs, which allow bone preservation and condensation through compaction autografting during osteotomy preparation, thereby increasing primary stability.[6] Therefore, this study was planned to compare and evaluate the crestal bone level and primary stability of implant placed using traditional drills and osseodensification drills. The null hypothesis was that there is no difference in stability and bone loss between the two drilling techniques.
MATERIALS AND METHODS
The study was approved by institutional review board. The study was conducted in the department of prosthodontics, to evaluate and compare the stability and crestal bone loss (CBL) of implants placed using traditional and OD drilling technique.
Selection of subjects
For the purpose of the study, a total number of 20 patients who required implant-supported prosthesis in maxillary anterior region were selected from the outpatient department. Patients with signs of parafunctional habits, untreated periodontal disease, heavy smoker (more than10 cigarettes/day), and pregnant or lactating women were excluded from the study. Furthermore, all patients met the following inclusion criteria: good oral hygiene, single tooth missing in the maxillary region with D3 (350–850 HU) and D4 (150–350 HU) bone with adjacent and opposite tooth present. Patients were given oral and written information regarding the risk of surgery and written informed consent and ethical clearance was obtained.
Procedure
For the purpose of the study, patients were divided into two groups, i.e., Group I and Group II. In Group I, 10 implants were placed in maxilla using traditional drilling technique, while in Group II, 10 implants were placed using OD drilling technique following the standard two-stage procedure of implant placement. The patients selected for Group II were mainly with narrow ridges. Preoperative analysis of surgical site was done clinically and by using cone-beam computed tomography (CBCT). To reduce the postoperative swelling, patients were given antibiotic therapy, i.e., 500 mg amoxicillin + 125 mg clavulanate potassium (AUGMENTIN 625 mg Duo, Galaxo SmithKline) 24 h prior to surgery which was continued for 5 days postsurgery. Paracetamol 325 mg and dexamethasone 0.75 mg were given half an hour before commencing the surgery. The surgical site was prepared following standard surgical protocol. A crestal incision was made and a full-thickness mucoperiosteal flap was raised at the site of implant placement. Following elevation of flap, surgical stent was placed at the site and optimal implant location was then marked using a surgical round bur with the guidance of surgical stent. ADIN Touareg S spiral dental implants of various diameter and length were used for the study. Decision tree for osseodensification protocol [Table 1] was followed. For Group I (traditional drilling technique), the osteotomy was prepared up to the desired depth using the Pilot Drill (speed of 800–1000 rpm at 1:20 reduction torque), thereafter, traditional drills were used in sequence as per the implant diameter protocol. For example, if a 3.75-mm diameter of implant was to be placed, the traditional drills (Alpha Bio – DFI, Israel) of gradually wider diameter ranging from D2.8, D3.2, and D3.65 were used. After final implant placement, veneer grafting was done (Bio-Oss granules, Geistlich) using membrane (periocol–GTR) and primary closure was achieved.
Table 1.
Decision tree for osseodensification protocol
| Implant diameter | Drill | Bur 1 | Bur 2 | Bur 3 | Bur 4 |
|---|---|---|---|---|---|
| 3.5, 3.7, 3.8 | Pilot drill | VT1525 | VT2535 | ||
| 4.0, 4.2, 4.3 | Pilot drill | VT1828 | VT2838 | ||
| 4.5, 4.7, 4.8 | Pilot drill | VT1525 | VT2535 | VT3545 | |
| 5.0, 5.2, 5.3 | Pilot drill | VT1828 | VT2838 | VT3848 |
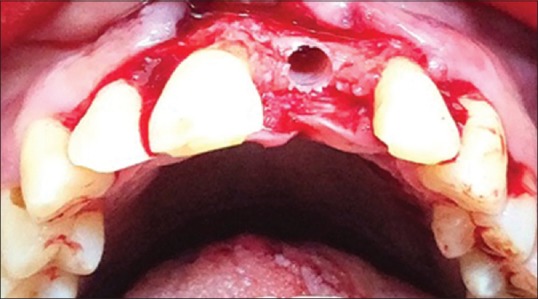
For Group II, [Figure 1a and 1b] Osteotomy was prepared to the desired depth using the pilot drill (clockwise drill speed 800–1500 rpm with copious irrigation) thereafter Osseodensification drills were used in sequence as per the implant diameter protocol).[7] For example, if a 3.75-mm implant was to be placed, drilling is performed in a clockwise direction.
Figure 1.

(a) DENSAH KIT. (b) Preoperative frontal view
Using VT1525, then depending on the density of the bone (soft or medium), the drill motor is reversed (counterclockwise drill speed 800–1500 rpm with copious irrigation). Gradually wider diameter burs were used, i.e., VT1828, VT2535, and VT2838 [Figure 2]. The final placement of implant [Figure 3] was done, and simultaneous buccal veneer grafting was performed.
Figure 2.
Osteotomy preparation using osseodensifying drilling technique
Figure 3.

Three-dimensional placement of implant
The second stage was done after 6 months[8] and standard prosthetic protocol is followed for fabrication of implant prosthesis. During the course of study, implant healing was uneventful. All 20 implants remained stable and showed no sign of pain, suppuration, or peri-implant infection throughout the study.
Stability of implants
The stability of each implant was measured clinically using resonance frequency analysis (RFA) [Figure 4](Osstell™, Integration Diagnostics, Savedalen, Sweden). RFA was carried out at the time of implant placement and 6 months after surgery. It was recorded three times for each implant at every interval. The system frequency response was measured by attaching transducer to the implant in buccolingual direction. The excitation sign was given over a range of frequencies (typically 5–15 KHz with peak amplitude of 1 V), and the first flexural resonance was measured.
Figure 4.

Resonance frequency analysis measurement using Ostell
Crestal bone level
The crestal bone levels were evaluated around the implant at baseline, after 6 and 8 months (postloading) using CBCT. The palatal and labial measurements were done on the sagittal section, while mesial and distal measurements were done on the tangential or coronal sections in the CBCT using measuring tools. The CBL was indicated by a negative value (−) and bone growth was indicated by a positive (+) value. The second-stage surgery was performed after 6 months of implant placement. All the observations relevant to each parameter, i.e., RFA values and crestal bone levels which were recorded at baseline, 6 and 8 months were expressed in the form of mean, standard deviations, and maximum and minimum scores. Unpaired t-test was used to make intergroup comparisons, while one-way ANOVA F-test was used to make intragroup comparisons. Standard prosthetic procedure were used for the fabrication of prosthesis [Figure 5], and implant protected occlusion was given [Figure 6].
Figure 5.

Abutment in place
Figure 6.
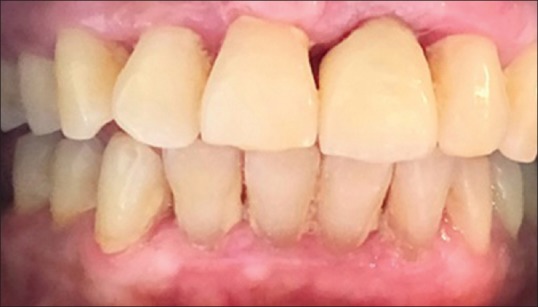
Final prosthesis in place
RESULTS
In the present study for Group II, the mean values of implant stability RFA1 (baseline) and RFA2 (6 months) was 65.6 Ncm and 66 Ncm, respectively, however, in the Group I, the mean values RFA1 and RFA2 are 57.6 Ncm and 64.8 Ncm [Graph 1]. The primary stability of implant placed using OD drills was found to be slightly higher than implant placed with traditional drill. On comparison, there was no statistical significance of primary stability obtained at baseline and 6 months when subjected to unpaired t-test (P > 0.05) [Tables 2a-d] The crestal bone levels showed positive bone growth in all the cases which was comparatively slightly higher for Group II as compared to Group I [Graph 2]. After 6 months of implant placement, crestal bone levels for Group II were 35.52% and in Group I was 7.18% of baseline. After 8 months, these values were 36.90% for Group II and 29.84% for Group I. However, when the data were subjected to unpaired t-test, there was no significant difference between the two groups (P > 0.05) [Table 3], in the intragroup comparison the data was found to be statistically significant at 4 months for Group II and at 8 months for Group I (P < 0.05) [Tables 4 and 5].
Graph 1.

Comparative evaluation of the stability of implants placed using osseodensification and traditional drilling technique
Table 2a.
Table with values measured
| Serial number | Osseodensification method | Traditional method | ||
|---|---|---|---|---|
| Immediate postoperative (RFA1) | Before loading (RFA2) | Immediate postoperative (RFA1) | Before loading (RFA2) | |
| 1 | 58 | 57 | 58 | 57 |
| 2 | 72 | 62 | 35 | 61 |
| 3 | 35 | 61 | 75 | 68 |
| 4 | 75 | 68 | 39 | 62 |
| 5 | 69 | 70 | 76 | 75 |
| 6 | 72 | 62 | 35 | 55 |
| 7 | 69 | 68 | 62 | 65 |
| 8 | 73 | 68 | 58 | 65 |
| 9 | 75 | 65 | 76 | 75 |
| 10 | 59 | 75 | 76 | 75 |
| Mean | 65.7 | 65.6 | 59 | 65.8 |
| SD | 12.36 | 5.23 | 17.28 | 7.39 |
| Maximum | 75 | 75 | 76 | 75 |
| Minimum | 35 | 57 | 35 | 55 |
RFA1: Resonance frequency analysis at baseline, RFA2: Resonance frequency analysis at 6 months, SD: Standard deviation
Table 2d.
Crestal bone levels from first implant thread after 8 months
| Serial number | Post loading (Osseodensification method) | Post loading (Traditional drilling method) | ||||||
|---|---|---|---|---|---|---|---|---|
| Labial buccal | Palatal | Mesial | Distal | Labial buccal | Palatal | Mesial | Distal | |
| 1 | 0.34 | 0 | −0.21 | 0 | 0.34 | 0 | −0.21 | 0 |
| 2 | −0.81 | 0 | 0.58 | 0 | 0 | 0 | −1.14 | −1.24 |
| 3 | 0 | 0 | −1.14 | −1.24 | 0.38 | 0 | −0.32 | 0 |
| 4 | 0.38 | 0 | −0.32 | 0 | 0 | 0 | −1.18 | −1.23 |
| 5 | 2.31 | 1.02 | −1.02 | 0.88 | 4.57 | 1.51 | 2.08 | 0 |
| 6 | 1.76 | −0.98 | −0.57 | −2.58 | 2.53 | 2.21 | −0.52 | −0.23 |
| 7 | −1.27 | −1.98 | −1.34 | 1.09 | 0 | 0 | 0 | 2.01 |
| 8 | 1.34 | 1.21 | 0.21 | −1.01 | 0 | 0 | 1.02 | 1.62 |
| 9 | 0.53 | 1.01 | −0.21 | 1.21 | 1.35 | 2.01 | −1.01 | 1.02 |
| 10 | 1.34 | 2.01 | 0.3 | 1.01 | 4.57 | 1.51 | 2.08 | 0 |
| Mean | 0.592 | 0.229 | −0.372 | −0.064 | 1.374 | 0.724 | 0.080 | 0.195 |
| SD | 1.122 | 1.151 | 0.644 | 1.230 | 1.867 | 0.957 | 1.236 | 1.076 |
| Maximum | 2.31 | 2.01 | 0.58 | 1.21 | 4.57 | 2.21 | 2.08 | 2.01 |
| Minimum | −1.27 | −1.98 | −1.34 | −2.58 | 0 | 0 | −1.18 | −1.24 |
Positive values denote above and negative values denote bone levels below the first thread. SD: Standard deviation
Graph 2.

Evaluation of the crestal bone levels on the labial/buccal site using osseodensification and traditional drilling technique
Table 3.
Comparison of implant stability at baseline and 6 months for osseodensification and traditional drilling technique
| Stability | Probable values of unpaired t-test between osseodensification and traditional drilling technique | Significance |
|---|---|---|
| RFA1 | 0.1820**, P>0.05 (NS) | NS |
| RFA2 | 0.6428**, P>0.05 (NS) | NS |
**The values came out to be not significant i.e., >0.05. NS: Not significant, RFA: Resonance frequency analysis
Table 4.
Comparison of crestal bone levels for labial/buccal, palatal, mesial, and distal sites of implant at baseline, after 6 months, and 8 months between osseodensification and traditional drilling technique
| Sites | Probable values of unpaired t-test between osseodensification and traditional drilling technique | ||
|---|---|---|---|
| At baseline | After 6 months | After 8 months | |
| Labial buccal | 0.7933**, P>0.05 (NS) | 0.3998**, P>0.05 (NS) | 0.8738**, P>0.05 (NS) |
| Palatal | 0.7842**, P>0.05 (NS) | 0.0673**, P>0.05 (NS) | 0.7935**, P>0.05 (NS) |
| Mesial | 0.0503**, P>0.05 (NS) | 0.9249**, P>0.05 (NS) | 0.5698**, P>0.05 (NS) |
| Distal | 0.0158*, P<0.05 (S) | 0.5219**, P>0.05 (NS) | 0.4071**, P>0.05 (NS) |
**No significant difference between groups, i.e., >0.05, *A significant difference between groups, i.e., <0.05. NS: Not significant, S: Significant
Table 5.
Comparison (by one-way ANOVA-F-test) among the different sites for different time points (at baseline, 6 months and 8 months) for osseodensification and traditional drilling technique
| Time points | Source of variation | P | F (Cal.) | df |
|---|---|---|---|---|
| At base line | Between groups (traditional drill method) | 0.079**, P>0.05 (NS) | 2.448 | 3 |
| Between groups (osseodensifying drill technique) | 0.172**, P>0.05 (NS) | 1.764 | 3 | |
| After 6 months | Between groups (traditional drilling technique) | 0.407**, P>0.05 (NS) | 0.992 | 3 |
| Between groups (osseodensifying drilling technique) | 0.017*, P<0.05 (S) | 3.872 | 3 | |
| After 8 months | Between groups (traditional drilling technique) | 0.017*, P<0.05 (S) | 3.869 | 3 |
| Between groups (osseodensifying drilling technique) | 0.183**, P>0.05 (NS) | 1.707 | 3 |
**No significant difference between groups, i.e., >0.05, *A significant difference between groups, i.e., <0.05. NS: Not significant, S: Significant, P: Probability, F-cal: F calculated statistics are based on the ratio of mean squares, df: Degree of freedom
Table 2b.
Crestal bone levels from first implant thread after immediate post op
| Serial number | At baseline (Osseodensification method) | At baseline (Traditional drilling method) | ||||||
|---|---|---|---|---|---|---|---|---|
| Labial buccal | Palatal | Mesial | Distal | Labial buccal | Palatal | Mesial | Distal | |
| 1 | 2.01 | 1.81 | 0.38 | 0.72 | 2.01 | 1.81 | 0.38 | 0.72 |
| 2 | 0 | 0.35 | 0.23 | 1.28 | −4.53 | 0.64 | 0 | −0.97 |
| 3 | −4.53 | 0.69 | 0 | −0.97 | 0.37 | 1.02 | 0 | −0.72 |
| 4 | 0.37 | 1.2 | 0 | −0.72 | −1.63 | 1.02 | −0.38 | −3.09 |
| 5 | 2.62 | 2.43 | −2.34 | −0.88 | 1.08 | 2.01 | 0.35 | 0.61 |
| 6 | 0 | 0.35 | 0.28 | 1.28 | −1.28 | −0.98 | −1.28 | −4.28 |
| 7 | −0.57 | 0 | 0.37 | 0.31 | −3.25 | 1 | −1.82 | 0.81 |
| 8 | −0.81 | 0 | 0.58 | 0 | 1.09 | 0.37 | 2.81 | −1.37 |
| 9 | 2.62 | 2.43 | −2.34 | −0.88 | 1.21 | 1.28 | 2.1 | 2.11 |
| 10 | −2.72 | 1.77 | −1.04 | 1.39 | 1.08 | 2.01 | 0.35 | 0.61 |
| Mean | −0.101 | 1.103 | −0.388 | 0.153 | −0.385 | 1.018 | 0.251 | −0.557 |
| SD | 2.278 | 0.955 | 1.119 | 0.977 | 2.187 | 0.896 | 1.381 | 1.957 |
| Maximum | 2.62 | 2.43 | 0.58 | 1.39 | 2.01 | 2.01 | 2.81 | 2.11 |
| Minimum | −4.53 | 0 | −2.34 | −0.97 | −4.53 | −0.98 | −1.82 | −4.28 |
Positive values denote above and negative values denote bone levels below first thread. SD: Standard deviation
Table 2c.
Crestal bone levels from first implant thread after 6 months
| Serial number | After 6 months (Osseodensification method) | After 6 months (Traditional method) | ||||||
|---|---|---|---|---|---|---|---|---|
| Labial buccal | Palatal | Mesial | Distal | Labial buccal | Palatal | Mesial | Distal | |
| 1 | 1.02 | 0.21 | −0.41 | 1.21 | 1.02 | 0.21 | −0.41 | 1.21 |
| 2 | −0.57 | 0 | 0.37 | 0.31 | 3.34 | 0 | 0 | −0.97 |
| 3 | −3.34 | 0 | 0 | −0.97 | −2.16 | 0 | −2.47 | −1.71 |
| 4 | −2.16 | 0 | −2.47 | −1.71 | 0.58 | 1.65 | −1.1 | 1.13 |
| 5 | 1.01 | 1.28 | −1.02 | 1.11 | 0.52 | 1.01 | 0.37 | 0.52 |
| 6 | 1.01 | 1.28 | −1.02 | 1.11 | 3.53 | 2.28 | −4.8 | −1.14 |
| 7 | 2.31 | 1.02 | −1.02 | 0.88 | 0.33 | 2.01 | 0 | −0.73 |
| 8 | 1.11 | 0 | −3.54 | 1.74 | −1.83 | 3.58 | 0 | −1.69 |
| 9 | 1.96 | −0.98 | −0.52 | 1.61 | 1.5 | 1.89 | 0.91 | 2.43 |
| 10 | 2.9 | 2.06 | −2.21 | 2.05 | 0.52 | 1.01 | 0.37 | 0.52 |
| Mean | 0.525 | 0.487 | −1.184 | 0.734 | 0.735 | 1.364 | −0.713 | −0.043 |
| SD | 1.980 | 0.894 | 1.211 | 1.206 | 1.841 | 1.146 | 1.717 | 1.403 |
| Maximum | 2.9 | 2.06 | 0.37 | 2.05 | 3.53 | 3.58 | 0.91 | 2.43 |
| Minimum | −3.34 | −0.98 | −3.54 | −1.71 | −2.16 | 0 | −4.8 | −1.71 |
Positive values denote above and negative values denote bone levels below first thread. SD: Standard deviation
DISCUSSION
Primary implant stability basically depends on the quality and the quantity of bone in the immediate vicinity of the implant at the time of implant placement. Edentulous areas which are deficient in bone are always at a risk of poor primary stability after implant placement. Achieving a good primary stability is critical in areas such as posterior maxilla or regions with D3 and D4 bone.[9] Thus, in simple terms, a good amount of bone should surround the implant at the time of implant placement to provide it a good mechanical anchorage. Nevertheless, quality of bone at the surgical site is a factor that is beyond the control, quantity of bone could be manipulated by number of ways. Thus, osteotomy formation leads to inevitable loss of bone tissue to create space for implant in the bone, which will affect the implant primary stability. Traditional drilling technique has been used extensively in implantology for the past many years. It has its limitations such as removal of bone, elliptical osteotomy preparation which may have resulted in increased bone modeling time and low primary stability mainly in region of low density. Therefore, this study was planned to assess the primary stability and CBL around implants placed using traditional drilling and OD drilling techniques.
In the present study, the primary stability of implant placed in Group II was found to be slightly higher than implants placed in Group I. Implant stability depends on direct contact between implant surface and surrounding bone so that micromotion at this interface are reduced. The amount of micromotion is determined by the bone density around the implant. Traditional drilling procedure that removes bone leads to reduction in bone mineral density. In these cases, early loading of implants can cause micromotions which may lead to failure. On the other hand, OD drilling technique has shown increase in mineral density, thereby resulting in better primary stability.
After 6 months of healing, the average RFAs were increased for both groups. Change in values indicates the changes in bone-implant interface. It has been shown that the mean RFA values slightly decrease during early weeks of healing because of loss of mechanical stability due to the formation of mainly lamellar bone. In the present study, the crestal bone levels in Group II was 35.52% and in Group I was 7.18% after 6 months of implant placement, as compared to the baseline. It was found that there is an increase in crestal bone levels after 6 months from the baseline in both the groups. However, Group II showed comparatively higher crestal bone levels after 6 months. This may be due to OD. Osseous densification preserves bone bulk in two ways: compaction of cancellous bone due to viscoelastic and plastic deformation and compaction of autografting of bone particles along the length and at the apex of osteotomy.[10] The results are similar to study done by Trisi et al. on sheep.[11] This was probably due to fine boney particle in the walls of the osteotomy and in between the threads of the implant body, which act as new bone growth initiator to enhance progression to secondary stability Furthermore, osteotomy production without extraction of existing bone preserves existing collagen and bone bulk. The presence of collagen and bone bulk enhances revascularization, a critical element in new bone growth and remodeling. At 8 months of implant placement in the present study, the crestal bone levels for Group II was 36.90%, while for Group I, it was 29.84% as compared to the 6 months. This shows that the crestal bone levels in Group II were higher as compared to crestal bone levels in Group I. The reason for such differences in crestal bone levels can be attributed to the difference in the healing pattern. In Group II, there was always a thin labial bone left after creating osteotomy, while in Group I, there was dehiscence in most of the cases on labial aspects. Thus, in Group II, the osteogenic potential of the leftover labial bone, combined with the osteoconductive potential of the bone graft provided better vascularization and faster angiogenesis. This is in accordance with the study done by Maiorana et al.[12] who concluded that bio-Oss can be placed on grafted area taking advantage of its osteoconductive property and compensating for the natural bone resorption that always occurs. The autografted bone chips in the osteotomy wall of Group II were also nuclei for more and dense bone formation as compared to Group I. Since the bone graft requires a very long time for its resorption, bone healing was slower in Group I.
The results strongly indicated that the OD drilling technique had no negative influence on bone healing as compared to traditional drilling. However, OD technique has a learning curve where surgeon has to decide when to change the drill motor direction. Not many human studies are available in literature where a comparison has been made between traditional drilling and standard drilling. However, the results of the present study are limited because of the short period of investigation and short sample size. Further investigations including a large number of patients and considering long-term evaluation of peri-implant alveolar bone loss are necessary to enhance the power of the conclusion concerning use and predictability of osseodensification technique.
CONCLUSION
Within the limitation of this study following conclusions were drawn: there was no statistically significant difference in implant stability between the traditional drilling and OD drilling technique (P < 0.05). On comparison of crestal bone levels between OD and traditional drilling, no statistically significant difference was found between the two groups (P < 0.05).
Financial support and sponsorship
Nil.
Conflicts of interest
There are no conflicts of interest.
REFERENCES
- 1.Pai UY. 44. Indirect sinus lift of atrophic posterior maxilla using osseodensification: A case report. J Indian Prosthodont Soc. 2018;18:S108. doi: 10.4103/0972-4052.246620. [DOI] [PMC free article] [PubMed] [Google Scholar]
- 2.Campos FE, Gomes JB, Marin C, Teixeira HS, Suzuki M, Witek L, et al. Effect of drilling dimension on implant placement torque and early osseointegration stages: An experimental study in dogs. J Oral Maxillofac Surg. 2012;70:e43–50. doi: 10.1016/j.joms.2011.08.006. [DOI] [PubMed] [Google Scholar]
- 3.Summers RB. A new concept in maxillary implant surgery: The osteotome technique. Compendium. 1994;15:152–158. 154-6. [PubMed] [Google Scholar]
- 4.Büchter A, Kleinheinz J, Wiesmann HP, Kersken J, Nienkemper M, Weyhrother HV, et al. Biological and biomechanical evaluation of bone remodelling and implant stability after using an osteotome technique. Clin Oral Implants Res. 2005;16:1–8. doi: 10.1111/j.1600-0501.2004.01081.x. [DOI] [PubMed] [Google Scholar]
- 5.Shayesteh YS, Khojasteh A, Siadat H, Monzavi A, Bassir SH, Hossaini M, et al. A comparative study of crestal bone loss and implant stability between osteotome and conventional implant insertion techniques: A randomized controlled clinical trial study. Clin Implant Dent Relat Res. 2013;15:350–7. doi: 10.1111/j.1708-8208.2011.00376.x. [DOI] [PubMed] [Google Scholar]
- 6.Pai UY, Rodrigues SJ, Talreja KS, Mundathaje M. Osseodensification – A novel approach in implant dentistry. J Indian Prosthodont Soc. 2018;18:196–200. doi: 10.4103/jips.jips_292_17. [DOI] [PMC free article] [PubMed] [Google Scholar]
- 7. [Last accessed on 2019 Jul 24]. Available from: http://www.versah.com/densifying.reference.guide .
- 8.Piattelli M, Favero GA, Scarano A, Orsini G, Piattelli A. Bone reactions to anorganic bovine bone (Bio-Oss) used in sinus augmentation procedures: A histologic long-term report of 20 cases in humans. Int J Oral Maxillofac Implants. 1999;14:835–40. [PubMed] [Google Scholar]
- 9.Lioubavina-Hack N, Lang NP, Karring T. Significance of primary stability for osseointegration of dental implants. Clin Oral Implants Res. 2006;17:244–50. doi: 10.1111/j.1600-0501.2005.01201.x. [DOI] [PubMed] [Google Scholar]
- 10.Huwais S, Meyer EG. A novel osseous densification approach in implant osteotomy preparation to increase biomechanical primary stability, bone mineral density, and Bone-to-implant contact. Int J Oral Maxillofac Implants. 2017;32:27–36. doi: 10.11607/jomi.4817. [DOI] [PubMed] [Google Scholar]
- 11.Trisi P, Berardini M, Falco A, Podaliri Vulpiani M. New osseodensification implant site preparation method to increase bone density in low-density bone: In vivo evaluation in sheep. Implant Dent. 2016;25:24–31. doi: 10.1097/ID.0000000000000358. [DOI] [PMC free article] [PubMed] [Google Scholar]
- 12.Maiorana C, Beretta M, Salina S, Santoro F. Reduction of autogenous bone graft resorption by means of bio-oss coverage: A prospective study. Int J Periodontics Restorative Dent. 2005;25:19–25. [PubMed] [Google Scholar]