

Summary
mTORC1 controls anabolic and catabolic processes in response to nutrients through the Rag GTPase heterodimer, which is regulated by multiple upstream protein complexes. One such regulator, FLCN-FNIP2, is a GTPase activating protein (GAP) for RagC/D, but despite its important role, how it activates the Rag GTPase heterodimer remains unknown. We used cryo-EM to determine the structure of FLCN-FNIP2 in a complex with the Rag GTPases and Ragulator. FLCN-FNIP2 adopts an extended conformation with two pairs of heterodimerized domains. The Longin domains heterodimerize and contact both nucleotide binding domains of the Rag heterodimer, while the DENN domains interact at the distal end of the structure. Biochemical analyses reveal a conserved arginine on FLCN as the catalytic arginine finger, and lead us to interpret our structure as an on-pathway intermediate. These data reveal features of a GAP-GTPase interaction and the structure of a critical component of the nutrient-sensing mTORC1 pathway.
Graphical Abstract
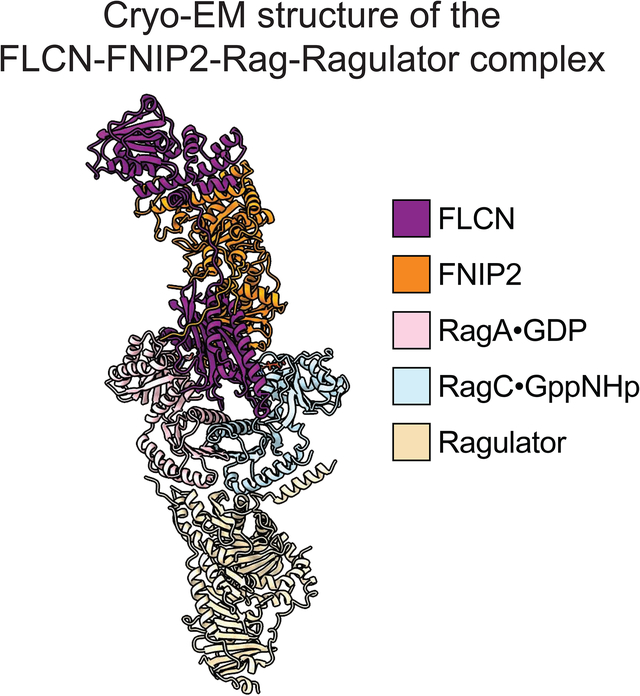
Seeing how the FLCN-FNIP2 GTPase activating proteins engage with Rag GTPases to modulate mTORC1 signaling suggests new ways to regulate GTPase function.
Introduction
The mechanistic Target of Rapamycin Complex 1 (mTORC1) is a central regulator of cell growth that integrates nutrient and growth factor signals (Gonzalez and Hall, 2017; Kim and Guan, 2019; Saxton and Sabatini, 2017; Valvezan and Manning, 2019). Nutrient-rich conditions activate mTORC1 to trigger downstream anabolic reactions and inhibit catabolic ones, such as autophagy, while in the absence of nutrients mTORC1 is turned off. Amino acids signal through upstream sensors and regulators to modulate the nucleotide loading states of the Rag GTPases, which form heterodimers consisting of RagA or RagB bound to RagC or RagD (Nakashima et al., 1996; Nakashima et al., 1999; Schurmann et al., 1995). When RagA/B binds GTP and RagC/D binds GDP, the GTPase heterodimer directly contacts and recruits mTORC1 to the lysosomal surface (Kim et al., 2008; Sancak et al., 2008; Tsun et al., 2013), where another Ras-family GTPase, Rheb, triggers internal conformational changes within mTORC1 to turn on its kinase activity (Inoki et al., 2003; Li et al., 2004; Menon et al., 2014; Saucedo et al., 2003). The heterodimer in which RagA/B is bound to GDP and RagC/D to GTP binds weakly to mTORC1, leading to loss of its lysosomal localization and inactivation (Kim et al., 2008; Sancak et al., 2008).
The intrinsic rates of conversion between the active and inactive states of the Rag GTPase are extremely slow (Shen et al., 2017), and several multi-protein complexes act on them to ensure that mTORC1 responds appropriately to changes in nutrient levels. Of these regulators, Ragulator is a pentameric protein complex that serves as a lysosomal membrane anchor for the Rag GTPases and also has non-canonical guanine exchange factor (GEF) activity towards RagC (Bar-Peled et al., 2012; Sancak et al., 2010; Shen and Sabatini, 2018). The GATOR1 and FLCN-FNIP2 complexes are GTPase activating proteins (GAPs) that stimulate GTP hydrolysis by RagA/B and RagC/D, respectively (Bar-Peled et al., 2013; Panchaud et al., 2013; Peli-Gulli et al., 2015; Petit et al., 2013; Tsun et al., 2013). With the assistance of these two GAPs, the half-lives of the nucleotide loading states of the Rag GTPases decrease to a level that matches the temporal requirements for amino acid sensing (Shen et al., 2017).
Folliculin (FLCN) was first discovered as the gene mutated in patients with Birt-Hogg-Dube (BHD) syndrome, a disease characterized by susceptibility to kidney cancer and benign hair follicle tumors (Birt et al., 1977; Scalvenzi et al., 1998; Schmidt and Linehan, 2018). Together with its partners, FNIP1 or FNIP2 (Folliculin interacting protein 1 or 2) (Baba et al., 2006; Hasumi et al., 2008; Takagi et al., 2008), FLCN can bind to AMPK to regulate the TFEB transcription factor (Hasumi et al., 2015; Mathieu et al., 2019; Young et al., 2016), as well as directly contact the Rag GTPases to stimulate GTP hydrolysis by RagC/D and thus promote the conversion to the GDP-bound state (Panchaud et al., 2013; Peli-Gulli et al., 2015; Tsun et al., 2013). Previous computational studies identified two Longin and two DENN domains within the FLCN-FNIP2 complex (Pacitto et al., 2015), and the DENN domain of FLCN was crystallized, revealing structural homology to the DENN1B protein (Nookala et al., 2012). However, there is currently neither structural information about the intact FLCN-FNIP2 complex, nor any molecular insight into the GAP mechanism.
To tackle these questions, we took advantage of cryo-electron microscopy (cryo-EM), which has been used resolve structures for other mTOR pathway components, including mTORC1 (Anandapadamanaban et al., 2019; Aylett et al., 2016; Baretic et al., 2016; Rogala et al., 2019; Yang et al., 2017; Yang et al., 2016; Yip et al., 2010), mTORC2 (Chen et al., 2018; Stuttfeld et al., 2018), and GATOR1 (Shen et al., 2018). We assembled the FLCN-FNIP2 complex with the Rag GTPases and Ragulator into a nonameric supercomplex, and used cryo-EM to determine its structure. Our work reveals the architecture of FLCN-FNIP2 as well as how it binds the Rag GTPases. Furthermore, we identified the catalytic residue necessary for the GAP activity, which leads us to interpret our structure as an on-pathway intermediate. These results provide a first depiction of the intact FLCN-FNIP2 complex and a roadmap for further mechanistic studies on its role in Birt-Hogg-Dube syndrome.
Results
Structural determination of the FLCN-FNIP2-Rag-Ragulator nonamer
To determine the structure of the FLCN-FNIP2 complex, we first co-expressed FLCN and FNIP2 in HEK-293 FreeStyle cells and purified the heterodimer using affinity chromatography followed by gel-filtration (Fig. 1A, blue line). The two subunits co-eluted as a heterodimer (Fig. 1B, blue lane). We then assembled the FLCN-FNIP2 complex with its substrate, the Rag GTPase heterodimer, and the Ragulator complex, the scaffolding complex and GEF for the Rag GTPases on the lysosomal membrane. To secure a stable interaction between FLCN-FNIP2 and the Rag GTPases, we used a point mutant of RagA, T21N, that locks it in the GDP-bound state (Shen et al., 2017). When we loaded FLCN-FNIP2 with the RagA(T21N)-RagC mutant in the presence of GDP and GppNHp (a non-hydrolyzable GTP analog), a heterotetramer formed that survived gel-filtration, suggesting a stable FLCN-FNIP2-GDPRagA(T21N)-RagCGppNHp complex was generated (Fig. 1A and 1B, orange line). This complex was further assembled with the Ragulator pentamer, which is known to bind to the Rag GTPase heterodimer through its C-terminal roadblock domains (CRDs, Fig. 1A and 1B, red line) (de Araujo et al., 2017; Yonehara et al., 2017). Coomassie blue stained gel analyses confirmed that all nine subunits are present in the final complex (~320 kD) and suitable for cryo-EM structural determination (Fig. 1B).
Figure 1. Structural determination of the FLCN-FNIP2-Rag-Ragulator nonamer.

A. Gel filtration profiles for the assembled FLCN-FNIP2-Rag-Ragulator supercomplex on a Hiload 16/60 Superdex 200 column. Cyan, FLCN-FNIP2 heterodimer only. Orange, FLCN-FNIP2 in complex with the Rag GTPases. Red, FLCN-FNIP2 in complex with the Rag GTPases and Ragulator.
B. Coomassie blue stained gel analyses to identify the protein subunits within the peaks of the gel filtration profiles in A. Lanes are labeled based on the coloring pattern in A.
C & D. Cryo-EM density map (C) and segmented map (D) for the FLCN-FNIP2-Rag-Ragulator nonamer. Subunits within the FLCN-FNIP2-Rag-Ragulator nonamer are differentiated by color as indicated: FLCN, purple; FNIP2, orange; RagA, pink; RagC, cyan; Ragulator, light brown.
We carried out single particle cryo-EM structural determination for the FLCN-FNIP2-Rag-Ragulator complex (Fig. S1A, S1B, Table 1) and resolved the cryo-EM density map at the resolution of 3.31 Å (gold-standard criteria) (Fig. 1C, 1D, and Fig. S1C). Local resolution ranges from 3.0 Å to 5.0 Å (Fig. S1C – S1E) with the side chains at the core region clearly resolved (Fig. S2A – S2C). We manually built ~35% of the complex de novo after docking of the existing structures for the Rag GTPases (Gong et al., 2011; Jeong et al., 2012; Shen et al., 2018), Ragulator (de Araujo et al., 2017; Mu et al., 2017; Su et al., 2017; Yonehara et al., 2017; Zhang et al., 2017), and the DENN domain of FLCN (Nookala et al., 2012) into our map. The resulting structural model offers a detailed visualization of the FLCN-FNIP2 complex engaging Rag-Ragulator.
Table 1.
Summary of cryo-EM data collection, 3D reconstruction, and model refinement
| FLCN-FNIP2-Rag-Ragulator | |
|---|---|
| Imaging parameters and 3D reconstruction | |
| Cryo-EM grids | Quantfoil R 1.2/1.3 Cu 400 |
| Calibrated magnification | 48,077 |
| Acceleration voltage [kV] | 300 |
| Pixel size [Å] | 1.04 |
| Total dose [e−/Å2] | 59.2 |
| Exposure time [s] | 6.4 |
| Defocus range [μm] | −1.0 to −3.5 |
| Particles in final 3D reconstruction | 126,984 |
| Resolution (‘Gold-standard’ at FSC 0.143) [Å] | 3.31 |
| Model refinement | |
| Resolution in phenix.real_space_refine [Å] | 3.6 |
| No. atoms: protein | 16353 |
| Ligands / ions | GppNHp, GDP, Mg2+ |
| r.m.s. deviations: bond lengths [Å] | 0.006 |
| r.m.s. deviations: bond angles [°] | 0.908 |
| MolProbity score | 1.78 |
| EMRinger score | 2.02 |
| Rotamer outliers [%] | 0.61 |
| Ramachandran angles: favored [%] | 91.5 |
| Ramachandran angles: allowed [%] | 8.40 |
| Ramachandran angles: outliers [%] | 0.10 |
| PDB | 6ULG |
| EMDB | EMD-20814 |
Architecture of the FLCN-FNIP2-Rag-Ragulator complex
The FLCN-FNIP2-Rag-Ragulator complex adopts an elongated conformation, with a size of 220Å×100Å×60Å. The Rag GTPase heterodimer localizes at the center (Fig. 2A). Their CRDs interact with Ragulator, similar to what was observed in previously resolved structures (Fig. 2A and 2B) (de Araujo et al., 2017; Yonehara et al., 2017). FLCN-FNIP2 binds to the Rag GTPases through their nucleotide binding domains (NBDs) (Fig. 2A and 2B). Interestingly, although FLCN-FNIP2 is a specific GAP for RagC, it enters the space in between the Rag subunits and directly contacts the NBDs of both RagA and RagC, suggesting it functions through a unique molecular mechanism.
Figure 2. General architecture of the FLCN-FNIP2-Rag-Ragulator supercomplex.

A. Atomic model, cartoon model, and domain assignment for the FLCN-FNIP2-Rag-Ragulator nonamer. Subunits of the FLCN-FNIP2-Rag-Ragulator complex are colored as following: FLCN, purple; FNIP2, orange; RagA, pink; RagC, cyan; Ragulator, brown.
B. Domain arrangement for the FLCN-FNIP2-Rag-Ragulator supercomplex. Inter- and intra-subunit interactions are shown by gray bars between domains. The DENN domain within FNIP2 is split in two, denoted as DENNn (DENN domain N-terminal fragment) and DENNc (DENN domain C-terminal fragment).
C. Structural model for the Longin domain heterodimer within the FLCN-FNIP2 complex.
D. Structural model for the DENN domain heterodimer within the FLCN-FNIP2 complex.
Based on established computational analyses (Nookala et al., 2012; Pacitto et al., 2015) and our EM density map, we readily resolved two distinct domains within both FLCN and FNIP2 (Fig. 2B and Fig. S2D, S2E). They each contain a Longin domain at the N-terminus and a DENN domain at the C-terminus. In particular, both the Longin and the DENN domains on FNIP2 are assembled by discontinued stretches of its primary sequence, and they both contain long loops that lack EM density, which could partially explain the difficulty in direct crystallization. We observed tight intramolecular interactions within FNIP2 between its Longin domain and the DENN domain (Fig. S2E), while the two domains of FLCN are physically separated and only connected through a linker (Fig. 2A and Fig. S2C, S2D).
The structural model offers insight into the heterodimerization mechanism between FLCN and FNIP2. We identified two contact surfaces between FLCN and FNIP2, each formed by heterodimerization of their corresponding domains (Fig. 2C and 2D). First, FLCN and FNIP2 each contribute a Longin domain to form a heterodimer (Fig. 2B and 2C), which directly enters the space in between the NBDs of RagA and RagC (Fig. 2A). This heterodimerization is mediated by a continuous ten-stranded β-sheet as a middle platform, sandwiched by six ahelices (Fig. 2C). Interestingly, we observed a very similar architecture of the two Longin domains of the Nprl2 and Nprl3 subunits in the GATOR1 complex that serves as a GAP for RagA (Shen et al., 2018). Second, the C-terminal DENN domains of FLCN and FNIP2 form a heterodimer at the distal end of the complex (Fig. 2B and 2D), localized away from the Rag GTPases and Ragulator (Fig. 2A). Despite sharing a similar topology with the Longin domain, the DENN domains heterodimerize via a different mechanism: the interface forms with two long α-helices at the C-terminus of the primary sequence (αD6 and αD7 of FLCN, and αD7 and αD8 of FNIP2, Fig. 2D). Such bidentate contacts between the Longin domains and the DENN domains ensures a strong intersubunit interaction.
Because FLCN-FNIP2 is a GAP for RagC and RagD (Tsun et al., 2013), we then focused on the interactions between FLCN-FNIP2 and the Rag GTPases. In our structural model, the Longin domain heterodimer of FLCN and FNIP2 inserts in between the nucleotide binding pockets of RagA and RagC, as a wedge (Fig. 3A). We first identified residues on FLCN-FNIP2 that mediate the interaction. The αL1 helix of the FLCN Longin domain directly contacts RagA-NBD, while that of FNIP2 interacts with RagC-NBD (Fig. 3B). The two αL1 helices position close to the guanine base, and extend many side chains to form an intricate network of interactions with the corresponding Rag subunit (Fig. 3C for FLCN-RagA and 3D for FNIP2-RagC). These interactions stably dock the Longin domain heterodimer between the Rag GTPases, and have two major effects: (1) forcing the Rag GTPases into a wide open conformation (see the next section), and (2) generating a physical block that interrupts the previously reported (Shen et al., 2017) intersubunit communication between RagA and RagC.
Figure 3. Structure of the Rag GTPase heterodimer within the FLCN-FNIP2-Rag-Ragulator supercomplex.

A. FLCN-FNIP2 contacts the Rag GTPases through its Longin domains. A Longin domain heterodimer inserts inbetween the NBDs of RagA and RagC like a wedge.
B. The aL1 helices of the FLCN- and FNIP2-Longin domain mediate interactions with the NBDs of RagA and RagC.
C. Residues on the αL1 helix of the FLCN-Longin domain contact the NBD of RagA near the guanine base of the bound GDP.
D. Residues on the αL1 helix of the FNIP2-Longin domain contact the NBD of RagC near the guanine base of the bound GppNHp.
E. Cartoon model for the two parameters used to characterize the conformation of the Rag GTPase heterodimer. Distance d measures the distance between the N-terminal tips of the αG5 helices on Rag subunits. Angle θ measures the angel formed between the orientation of the aG5 helix of RagA with the N-terminal tip of the αG5 helix of RagC.
F. Conformations of the Rag GTPase heterodimer and its yeast homolog, Gtr1p-Gtr2p. The available structures are aligned based on their CRDs but only the NBDs are shown. A variety of conformations can be observed when the subunits bind different nucleotides, or carry different mutations.
The Rag GTPase heterodimer is in a wide-open conformation
The Rag GTPase heterodimer in our structure shows a similar architecture as in previously resolved structures (Anandapadamanaban et al., 2019; Gong et al., 2011; Jeong et al., 2012; Rogala et al., 2019; Shen et al., 2018): their CRDs tightly heterodimerize, while the NBDs adopt a pseudo two-fold rotational symmetry. The nucleotide binding pockets face away from each other, and the bound nucleotides form a head-to-head configuration with the two guanine bases pointing towards one another (Fig. 3E). Specifically, RagA resides in the GDP-bound state, and the EM density of the Switch I region vanishes, suggesting a flexible conformation (Fig. S3A). In accordance with this, its nucleotide binding pocket is very open with the bound GDP molecule fully exposed. In sharp contrast, RagC resides in the GppNHp-bound state with a fully closed nucleotide binding pocket (Fig. S3B). Switch I of RagC is swung to the top of the nucleotide binding pocket and forms a lid. A similar conformation of Switch I has been previously observed on RagA within the GATOR1- and Raptor-bound Rag GTPases, although the nucleotide loading state in those structures is the opposite, GppNHpRagA-RagCGDP (Anandapadamanaban et al., 2019; Rogala et al., 2019; Shen et al., 2018).
The Rag GTPase heterodimer is characterized by its unique architecture and communication between the subunits (Shen et al., 2017). We were surprised to find that the Rag GTPases adopt a wide-open conformation, which is drastically different from what has been observed before, with the two NBDs located much farther away from one another. To quantify this intersubunit conformation and compare it with previously resolved structures, we employed two parameters, d, the distance between the N-terminal tips of the αG5 helices on Rag subunits, and θ, the angle formed between the αG5 helix of RagA with the N-terminal tip of the αG5 helix of RagC (Fig. 3E). The distance d represents the relative distance between the Rag subunits, while the angle q independently reflects the relative rotation.
Across the five available structural models for the Rag GTPases and their yeast homologs, Gtr1p-Gtr2p, their CRDs display similar heterodimerized architectures, so we decided to use them for structural alignment (Fig. 3F). Interestingly, when yeast Gtr1p and Gtr2p are loaded with opposite nucleotides (Jeong et al., 2012) instead of both with GppNHp (Gong et al., 2011), a rotational movement brings the two subunits close to one another, as both d and q are reduced (Fig. 3F, rows 1 vs 2). This movement converts the Gtr heterodimer from the open conformation to the closed conformation, where the two subunits communicate. In case of human Rag GTPases carrying point mutation(s) on RagC (Rogala et al., 2019; Shen et al., 2018), the global conformation is similar to that of the Gtr protein in its open conformation (Fig. 3F, rows 3 & 4 vs 1). However, the structure of RagA(T21N)-RagC bound to FLCN-FNIP2 displays a dramatically different conformation: the distance d is 1.3 nm longer (Fig. 3F, rows 5 vs 3), while the angle q remains similar (Fig. 3F, rows 5 vs 2 and rows 5 vs 3). These data suggest that the Longin domain heterodimer inserts between the NBDs by simply pushing away RagA without inducing any intersubunit rotational movement.
Arginine 164 of FLCN is the catalytic residue for its GAP activity
As we captured a snapshot of FLCN-FNIP2 bound to the Rag GTPases at their nucleotide binding pockets, we wondered whether this structural model might give insights into the mechanism for how FLCN-FNIP2 stimulates GTP hydrolysis by RagC. To this end, we first identified the GppNHp molecule bound to RagC, and observed clear EM densities corresponding to its β- and γ-phosphates (Fig. S3B). However, we could not identify any EM density extending from either FLCN or FNIP2 into the nucleotide binding pocket of RagC. In fact, the EM densities between FLCN-FNIP2 and the Rag GTPases have clearly-defined boundaries, and no side-chains crosses them (Fig. 4A), suggesting that our structure does not represent the transition state of the GAP reaction. Instead, it likely illustrates an on-pathway intermediate during GTPase activation, as also seen in other GAP-GTPase structures (see below) (Seewald et al., 2002).
Figure 4. Arg164 of FLCN is necessary for the GAP activity.

A. Cryo-EM density map (colored surface) and atomic model (colored ribbon) around the nucleotide binding pocket of RagC. Clear boundaries between RagC and FLCN-FNIP2 are observed with no EM density extending into the nucleotide binding pocket of RagC.
B. Sequence conservation of Arg164 of FLCN. Arg164 is conserved to yeast (Lst7) and localizes between the two β-strands of the Longin domain of FLCN.
C. Structural comparison between Arg164 of FLCN and Arg78 of Nprl2. Arg78 of Nprl2 is the catalytic residue for GATOR1’s GAP function on RagA. These two arginines localize at similar positions on FLCN and Nprl2, respectively.
D. Co-immunoprecipitation experiment to probe the interaction between FLCN-FNIP2 and the Rag GTPases. FLCN-FNIP2 carrying the R164A mutation binds to the Rag GTPases to a similar extent as wild-type FLCN-FNIP2. This experiment was repeated twice, and a representative data set is shown here.
E. Coomassie blue stained gel of wild-type FLCN-FNIP2 and the mutant carrying the FLCN(R164A) mutation.
F. Single turnover GTP hydrolysis assay to determine the effect of FLCN-FNIP2. The Rag GTPase heterodimer was first loaded with radiolabeled GTP. FLCN-FNIP2 was then added to stimulate the hydrolysis. Time points were taken to track the reaction process and were fitted to extract the observed reaction constants.
G & H. Time courses of GTP hydrolysis by the Rag GTPases under single turnover conditions, stimulated by wild-type FLCN-FNIP2 (G) or the mutant carrying the FLCN(R164A) mutation (H).
I. Concentration dependence of stimulated GTP hydrolysis by FLCN-FNIP2 under single turnover conditions. A 100-fold decrease was observed with the FLCN(R164A)-FNIP2 mutant under single turnover conditions. Gray numbers in parenthesis denote the SDs of the reported values calculated from at least three independent experiments.
J. Multiple turnover GTP hydrolysis assay to determine the effect of FLCN-FNIP2. The Rag GTPase heterodimer was doubly-loaded with GTP. FLCN-FNIP2 was then added to stimulate hydrolysis. Time points were taken to track the reaction process and were fitted to extract the observed reaction constants.
K & L. Time courses of GTP hydrolysis by the Rag GTPases under multiple turnover conditions, stimulated by wild-type FLCN-FNIP2 (K) or the mutant carrying the FLCN(R164A) mutation (L).
M. Concentration dependence of stimulated GTP hydrolysis by FLCN-FNIP2 under multiple turnover conditions. A 7-fold decrease was observed with the FLCN(R164A)-FNIP2 mutant under these conditions. Gray numbers in parenthesis denote the SDs of the reported values calculated from at least three independent experiments.
To identify the molecular basis for the stimulatory effect of FLCN-FNIP2 and probe its biological relevance, we sought surface exposed, conserved arginine residues on the Longin domain heterodimer of FLCN-FNIP2. Interestingly, only one arginine, Arg164 of FLCN, is conserved from human to yeast (Fig. 4B). Moreover, when we superimposed the structure of the FLCN-FNIP2 heterodimer with that of Nprl2-Nprl3, this arginine residue localizes at exactly the same position as Arg78 of Nprl2, which is the catalytic residue for activating GTP hydrolysis by RagA/B (Fig. 4C) (Shen et al., 2018; Shen et al., 2019). Mutating Arg164 to alanine maintains the integrity of the FLCN-FNIP2 complex, as well as its interaction with the Rag GTPases (Fig. 4D). Therefore, we selected it as a candidate for the catalytic arginine finger.
To directly test the catalytic function of Arg164 of FLCN, we designed a GTPase assay based on radioactively labeled GTP in the context of wild-type Rag GTPases (Fig. 4F). We first loaded wild-type Rag GTPases with a trace amount of radioactively labeled GTP. Because the on-rates for GTP of RagA and RagC are similar (Shen et al., 2017), we expected a mixture of singly GTP-loaded Rag GTPase heterodimers (Fig. 4F). These configurations resemble the opposite nucleotide loaded states of the Rag GTPases, as one of the nucleotide binding pockets is empty. Subsequently, FLCN-FNIP2 was added to this mixture to stimulate GTP hydrolysis. If we allowed the reaction to reach its end point, only ~50% of the radiolabeled GTP was hydrolyzed, suggesting that FLCN-FNIP2 catalyzes hydrolysis from only one subunit (Fig. S4A) (Shen et al., 2017; Tsun et al., 2013). This result also confirms the equal loading of radiolabelled GTP to RagA and RagC. To determine the specificity of our assay, we carried out similar assays using RagA(Q66L) or RagC(Q120L) mutants, which have been shown to suppress the stimulatory effect of GATOR1 or FLCN-FNIP2, respectively (Bar-Peled et al., 2013; Tsun et al., 2013). Indeed, RagC(Q120L), but not RagA(Q66L), completely abolishes FLCN-FNIP2-dependent stimulation of GTP hydrolysis, consistent with FLCN-FNIP2 being a specific GAP for RagC (Fig. S4B) (Tsun et al., 2013). We further tested the effect of Ragulator (Fig. S4C), and found that it only mildly impacts the stimulatory capacity of FLCN-FNIP2 on GTP hydrolysis by RagC under single turnover conditions (Fig. S4D).
Using the assay developed above, we purified the FLCN-FNIP2 complex carrying the FLCN(R164A) mutation (Fig. 4E), and tested its ability to promote GTP hydrolysis by RagC in a single turnover condition (Fig. 4F). While wild-type FLCN-FNIP2 robustly stimulates GTP hydrolysis by RagC in a dose-dependent manner (Fig. 4G), FLCN(R164A)-FNIP2 showed a >100-fold decrease in stimulation (Fig. 4H, note the differences in time-scales on the x-axis). This result suggests that the conserved Arg164 residue on FLCN is the catalytic arginine finger that simulates GTP hydrolysis by RagC (Fig. 4I).
To further probe the effect of nucleotide loading states of the Rag GTPases on the stimulatory effect of FLCN-FNIP2, we designed a multiple turnover assay (Fig. 4J). Because the Rag GTPase heterodimer prefers to stay in opposite nucleotide loaded states and the simultaneous GTP loading on both subunits is much more difficult (Shen et al., 2017), we incubated a high concentration of GTP (100 μM) with it in order to force both nucleotide binding pockets to load with GTP (Fig. 4J). Under this condition, FLCN-FNIP2 was then added to the reaction mixture, and we can test if the arginine residue we identified above is still critical. Satisfactorily, while wild-type FLCN-FNIP2 accelerates GTP hydrolysis by the Rag GTPases in the multiple turnover assay (Fig. 4K and 4M), the mutant carrying R164A fails to do so (Fig. 4L and 4M). This result suggests that Arg164 functions as a catalytic arginine finger towards RagC regardless of the nucleotide loading state of RagA.
Combining the results above, we went on to interpret our structural model. The distance between Arg164 of FLCN and the phosphates of the nucleotide bound to RagC is 14.7 Å, which is in proximity but beyond the reach of the catalytic residue (Fig. 5A). Furthermore, the relative orientation of the nucleotide binding pocket of RagC is clearly mis-positioned to allow for the insertion of Arg164 (Fig. 5A). Therefore, we interpret our structure as an on-pathway intermediate that primes the transition state of the GAP-stimulated reaction. Subsequent conformational changes are likely essential for the catalytic step, which requires further structural and biochemical investigation.
Figure 5. The resolved FLCN-FNIP2-Rag-Ragulator complex represents an on-pathway intermediate during GTP hydrolysis.

A. Relative positioning of the catalytic arginine and the nucleotide binding pocket of RagC. The distance between Arg164 and the phosphate of the GppNHp molecule bound to RagC is 14.7 Å. Nucleotide binding pocket of RagC is mis-oriented to allow for insertion of Arg164.
B. Model for stimulated GTP hydrolysis of the Rag GTPases by FLCN-FNIP2. We interpret our structure as an on-pathway intermediate. Subsequent local conformational changes are required to insert the catalytic residue into RagC-NBD.
C. Model for stimulated GTP hydrolysis of the Rag GTPases by GATOR1. We interpret our previous structure as an off-pathway intermediate during GTP hydrolysis. Global conformational change is required to access the catalytic arginine on Nprl2.
Discussion
As a positive regulator of the Rag GTPase heterodimer, FLCN-FNIP2 occupies a key position in activating mTORC1. We present the cryo-EM structure of FLCN-FNIP2 in complex with the Rag GTPases and Ragulator. FLCN and FNIP2 heterodimerize through two distinct pairs of domains, Longin and DENN. The Longin domain heterodimer enters the space between the Rag GTPases, and forms extensive contacts with the NBDs. We further show that Arg164 of FLCN is necessary to stimulate GTP hydrolysis by RagC. These results suggest a non-canonical interaction between a GAP and GTPase, as well as the molecular basis for how FLCN-FNIP2 activates the Rag GTPases. FLCN also binds to AMPK and TFEB (Hasumi et al., 2015; Mathieu et al., 2019; Young et al., 2016), and our model provides a foundation for the future structural illumination and comparison of FLCN-containing super complexes.
Canonical GAPs stimulate GTP hydrolysis by their substrates using an arginine finger or an asparagine thumb, in order to disperse the accumulated charge on the phosphate during GTP hydrolysis (Daumke et al., 2004; Pan et al., 2006; Scheffzek et al., 1997). In accordance with this, previously resolved GAP structures usually capture them bound to the nucleotide binding pocket of the GTPase. Two general paradigms are commonly seen (Mishra and Lambright, 2016). First, the catalytic residue may extend towards the β- and γ-phosphates of the bound nucleotide in an optimal conformation to disperse the charge, thus representing the ground or transition state of the hydrolysis reaction. Second, the catalytic residue may point away from the nucleotide and form interactions with other residues of the GTPase, mostly notably seen in RanGAP (Seewald et al., 2002). Our structural model resembles the second scenario: the catalytic arginine of FLCN is in proximity to the Rag GTPases near their nucleotide binding pockets, but is pointing away from the NBD (Fig. 5A). The NBD of RagC is mis-oriented and the physical block from Switch I prevents Arg164 from accessing the β- and γ-phosphates of the bound GppNHp (Fig. 5A). In a previous structural study on the RanGAP-Ran complex, the authors hypothesized that the critical arginine residue of RanGAP may stabilize the nucleotide binding pocket of Ran, and that this stabilization is sufficient to stimulate GTP hydrolysis (Seewald et al., 2002). Although such a mechanism could be the case for FLCN-FNIP2, we favor another possibility: A subsequent local conformational change following the initial binding state as we captured here, will insert the arginine finger into the nucleotide binding pocket to execute its function. Accordingly, we tentatively interpret our structure as an on-pathway intermediate towards GTP hydrolysis (Fig. 5B).
Two GAPs, GATOR1 and FLCN-FNIP2, regulate the nucleotide loading states of the Rag GTPases. Because of the unique architecture of the Rag GTPases, these GAPs function through molecular mechanisms that have not been reported before. Our previous studies suggested non-canonical interactions between GATOR1 and the Rag GTPases (Shen et al., 2018; Shen et al., 2019). We showed that GATOR1 can bind to the Rag GTPases through two modes: (1) an inhibitory mode mediated by the critical strip on the Depdc5 subunit of GATOR1 that holds the Rag GTPases in place, and (2) a GAP mode mediated by the Arg78 residue on Nprl2 that carries out the GAP activity (Fig. 5C). This arginine finger, coincidentally, localizes within the Longin domain heterodimer of Nprl2 and Nprl3 – similar to what we resolved here in the FLCN-FNIP2-Rag-Ragulator complex. A key difference between GATOR1 and FLCN-FNIP2 is that in the case of the GATOR1-Rag interaction, the two binding modes are physically separated, as the molecular features localize on opposite sides of the GATOR1 complex. Therefore, in order for the arginine finger to function, a global conformational change is likely required, and could be regulated by external inputs.
The Rag GTPase heterodimer is a key mediator of mTORC1 signaling. It functions through a unique locking mechanism that coordinates the nucleotide loading states of the two GTPase domains (Shen et al., 2017). Upon GTP binding to a subunit, local conformational changes take place in the switch machinery of the GTPase domain. Particularly, a two amino acid register shift within the interswitch region results in a global repositioning of the entire GTPase domain with respect to its CRD (Anandapadamanaban et al., 2019; Rogala et al., 2019). Here, we captured a rather unique global conformation of the GDPRagA-RagCGTP nucleotide state, where both NBDs are significantly pushed away from the central axis. We speculate that such an unusual conformation is a result of two factors. First, the T21N mutation on RagA has been shown to disrupt intersubunit communication (Shen et al., 2017), and may contribute to the loosened interaction between the subunits. Second, the insertion of a large Longin domain heterodimer of FLCN-FNIP2 places a solid block that physically separates the two GTPase domains, and almost certainly impedes intersubunit communication. Intriguingly, two recent structures of the Rag GTPase heterodimer bound to mTORC1 also suggest the importance of regulating intersubunit communication (Anandapadamanaban et al., 2019; Rogala et al., 2019). In the Raptor-Rag-Ragulator structure (Rogala et al., 2019), a portion of the Raptor subunit (residues 916–937, termed the “Raptor claw”) inserts in between the Rag subunits and contacts RagC-NBD in its GDP-bound state, which likely blocks intersubunit communication. Together with the results presented here, we suspect that interruption of intersubunit communication within the Rag heterodimer may be necessary for it to commit to a specific functional state. In general, these observations suggest a complex and yet-to-be explored conformational space within the Rag GTPase heterodimer, which is likely important for understanding how it transmits amino acid signals from upstream regulators to mTORC1.
STAR Methods
LEAD CONTACT AND MATERIALS AVAILABILITY
The reagents generated in this study are available with no restriction. Further information and requests for resources and reagents should be directed to the Lead Contact, David M. Sabatini (sabatini@wi.mit.edu).
EXPERIMENTAL MODEL AND SUBJECT DETAILS
HEK-293T cells were obtained from American Type Culture Collection (ATCC) and were maintained in an incubator setting at 37°C and 5% CO2. They were cultured in Dulbecco’s Modified Eagle Medium (DMEM), supplemented with 10% IFS, 2 mM glutamine, 100 IU/ml penicillin, and 100 μg/ml streptomycin.
HEK-293 FreeStyle cells were obtained from Thermal Fisher Scientific and were maintained in a Multitron shaker set at 37°C, 125 r pm, 8% CO2, and 80% humidity. They were cultured in FreeStyle 293 Expression Medium, supplemented with 100 IU/ml penicillin and 100 μg/ml streptomycin.
BL21(DE3) E. Coli strain was grown at 37°C in a Multitron shaker in LB media. To induce protein expression, BL21(DE3) E. Coli strain was transformed by the corresponding plasmids (see below), propagated at 37°C, and induc ed with IPTG at 18°C.
METHOD DETAILS
Protein Preparation
The Rag GTPase heterodimer was purified as previously described (Shen et al., 2017). In brief, co-expression of C-terminally His-tagged RagA(T21N) and tagless RagC was induced by 0.5 mM IPTG in BL21(DE3) cells. The heterodimer was sequentially purified through Q Sepharose, Ni-NTA, MonoQ, and Superdex 200 columns.
Ragulator was purified as previously described (Shen and Sabatini, 2018). In brief, the five subunits of Ragulator were co-transformed and expressed in BL21(DE3) strain. The pentameric complex was sequentially purified through GST, Ni-NTA, MonoQ, and Superdex 200 columns.
Human FLCN-FNIP2 was expressed and purified as previously described (Shen et al., 2017; Tsun et al., 2013). In brief, HA-tagged FLCN were co-expressed with Flag-tagged FNIP2 in FreeStyle 293 cells. The complex was isolated using Flag-M2 beads and further purified by a Superdex 200 gel-filtration column.
The FLCN-FNIP2-Rag-Ragulator complex was assembled as follows. 1 mg of purified FLCN-FNIP2 was incubated with 1 mg of RagA(T21N)-RagC and 2 mg of Ragulator in a total volume of 1 ml for ten hours at 4°C. The assembly solution contains 50 mM NaHEPES (pH 7.4), 100 mM NaCl, 2 mM MgCl2, 2 mM DTT, 0.1% CHAPS, 100 μM GppNHp, and 100 μM GDP. The nanomeric complex was separate from excess Rag GTPases and Ragulator on a Superdex 200 column.
The FLCN-FNIP2-Rag-Ragulator complex was concentrated to 8 μg/μl in a 100kDa molecular weight cut-off concentrator and ultracentrifuged at 100,000×g for 30 minutes immediately prior to freezing grids.
Cryo grids preparation
Cryo grids were prepared immediately after protein purification. 400-mesh Quantifoil 1.2/1.3 Cu grid (Quantifoil, Großlöbichau Germany) was made hydrophilic by glow discharging for 60 seconds with a current of 15 mA in a Pelico EasiGlow system. Cryo grids were prepared using an FEI Mark IV Vitrobot (FEI, part of Thermo Fisher Scientific, Hillsboro, OR). The chamber of the Vitrobot was kept at 4°C and 100% relative humidity. The blotting time was 3 seconds with an equipment-specific blotting force set at 3. 3 μl of sample was applied to the glow-discharged grid and then rapidly plunge-frozen into a liquid ethane bath.
Image collection and processing
Two data sets were collected on two different 300 kV FEI Titan Krios cryo electron microscopes (FEI) at HHMI Janelia Research Campus. The first data set was collected on Janelia Krios2 with spherical aberration Cs of 2.7 mm and equipped with a Gatan K2 Summit camera. The final exposure was collected in dose fractionation mode on the K2 camera at a calibrated magnification of 38,168, corresponding to 1.31 Å per physical pixel in the image (0.655 Å per super-resolution pixel). The dose rate on the specimen was set to be 5.83 electron per Å2 per second and total exposure time was 10 s, resulting in a total dose of 58.3 electrons per Å2. With dose fractionation set at 0.25 s per frame, each movie series contained 40 frames and each frame received a dose of 1.46 electrons per Å2. Fully automated data collection was carried out using SerialEM with a nominal defocus range set from −1.5 to −3 m. A total of 4535 dose fractionation movies were collected in this session.
One round of data processing was done on this dataset. Beam-induced motion were measured, corrected, and dose-weighted at 1.46 electron/Å2 per frame with data binned by 2 using cisTEM (Grant et al., 2018). CTF determination for each movie series was calculated by amplitude averaging of every 3 frames using cisTEM. Automated particle picking using ab inito mode was carried out in cisTEM on all the micrographs and 927042 particles were extracted. Two rounds of reference-free 2D classification with CTF correction was performed in cisTEM to throw away bad particles. 321015 particles were kept for further processing. Ab initio 3D initial model was generated using CryoSparc (Punjani et al., 2017). Subsequent 3D refinement was performed in cisTEM to generate a 3D reconstruction density map. Fourier Shell Correlation at a criteria of 0.143 reported resolution of 6.34 Å for this map.
To improve the resolution of the reconstruction, a larger data set was collected at higher magnification on Janelia Krios1. This Krios microscope is equipped with a spherical aberration corrector (Cs=0.01 mm), an energy filter (Gatan GIF Quantum) and a post-GIF Gatan K2 Summit direct electron detector. The final exposure was collected in dose fractionation mode on the K2 camera at a calibrated magnification of 48,077, corresponding to 1.04 Å per physical pixel (0.52 Å per super-resolution pixel). The dose rate on the specimen was set to be 9.25 electron per Å2 per second and total exposure time was 6.4 s, resulting in a total dose of 59.2 electrons per Å2. With dose fractionation set at 0.16 s per frame, each movie series contained 40 frames and each frame received a dose of 1.48 electrons per Å2. Fully automated data collection was carried out using SerialEM (Mastronarde, 2005) with a nominal defocus range set from −1.5 to −3 μm. A total of 13,549 dose fractionation movies were collected in this session.
The recorded movies were corrected for drift using Relion’s MotionCor2 implementation (Zheng et al., 2017; Zivanov et al., 2019), and contrast transfer function (CTF) parameters were determined using GCTF (Zhang, 2016). From our previous reconstitution attempts we learned that the Rag-Ragulator-FLCN-FNIP2 structure is rather elongated, and therefore considered the possibility that our previous picking efforts were missing the small orthogonal views of the protein complex. To address this, we created two sets of manually-picked particles (1,000 each) that contained either the elongated or the small orthogonal views of the protein. These two hand-selected particle sets were then used to train a deep-learning particle picker, crYOLO (Wagner et al., 2019), which produced two large particle sets of two different box sizes. The larger box size of 360 pixels, corresponding to 374 Å, yielded 1,340,028 particles, and a smaller box size of 172 pixels, corresponding to 179 Å, produced 724,249 particles. After extraction and downscaling, the resulting two particle sets were processed separately in Relion (Zivanov et al., 2018). Three rounds of reference-free 2D classifications were used to remove incorrectly selected particles and those of incomplete complexes. The remaining particles (sets of 864,167 and 519,928) were combined, and a strict distance cut-off of 250 Å was used to discard duplicates. The resulting clean set of 1,384,095 particles was re-extracted at full size, and used in 3D classifications. Our earlier 6.34 Å map served as a starting model, and in the first round of 3D classifications produced two (out of four) classes of high quality. These classes were combined together, and subsequently used in iterative cycles of per-particle CTF refinement and per-particle motion correction in Relion (Zivanov et al., 2018). After convergence, and another round of 3D classifications, we identified two (out of four) classes that showed the highest level of structural detail. These 3D classes were combined and the resulting 615,470 particles were used in further 3D refinement. The final map obtained from these particles was sharpened with a B-factor of −22 Å2 and estimated at 3.31 Å resolution, according to ‘gold standard’ Fourier shell correlation (FSC) of 0.143 (Fig. S1). Local resolution was estimated using Relion to extend from 3.0 to 5.0 Å resolution (Fig. S1).
Model Building and Refinement
Atomic models were prepared with Coot (Emsley et al., 2010). We first fit in the available structures into our cryo-EM density map, including RagC-NBD in its GppNHp bound form (PDB: 3LLU), Ragulator-Rag(CRD) (PDB: 6EHR), FLCN-DENN (PDB: 3V42). Other parts of the model were built de novo by tracing the backbone, following domain topology, and registering the bulky residues based on the secondary structure predictions by I-TASSER (Roy et al., 2010; Yang et al., 2015; Zhang, 2008) and Jpred (Drozdetskiy et al., 2015).
Real-space refinements of FLCN-FNIP2-Rag-Ragulator were performed using PHENIX (Adams et al., 2010; Liebschner et al., 2019) with secondary structure restraints. MolProbity (Chen et al., 2010) was used to evaluate the geometries of the structural model. Corrected Fourier shell correlation curves were calculated between refined atomic model and the cryo-EM density map.
Preparation of Cell Lysates and Immunoprecipitates
Cell lysates and immunoprecipitates were prepared as previously established (Shen et al., 2017). In brief, two million HEK-293T cells were first plated onto a 10 cm dish. Twenty-four hours later, the cells were transfected with the plasmids indicated in the figure panels. Thirty-six hours later, cells were rinsed once with PBS and lysed in Triton Lysis Buffer (40 mM NaHEPES, pH 7.4; 5 mM MgCl2; 10 mM Na4P2O7; 10 mM sodium β-glycerol phosphate; 1% Triton X-100; and one tablet of EDTA-free protease inhibitor (Roche) per 25 ml of buffer). The lysates were cleared and immunoprecipitated with FLAG-M2 affinity gel. Following immunoprecipitation, the gel was washed once with Triton Lysis Buffer and three times with Triton Lysis Buffer supplemented with 500 mM sodium chloride. Immunoprecipitated proteins were denatured by SDS buffer, resolved by SDS-PAGE gels, and analyzed by immunoblotting.
Kinetic Measurements
To determine the stimulatory effect of FLCN-FNIP2 on the hydrolysis rate of the Rag GTPases under single turnover conditions, increasing amounts of FLCN-FNIP2 was incubated with 50 nM Rag GTPase heterodimer that is preloaded with ~ 0.1 nM of γ-32P-GTP. Small aliquots of the reaction were withdrawn at different time points and quenched by 0.75 M KH2PO4 (pH 3.3). The time points were then expanded by thin layer chromatography (TLC) plates, and imaged and quantified with phosphorimaging screens. Linear regression was used to fit the fraction of phosphate against time, to generate the observed rate constants (kobsd). The kobsds were then fit to a single binding equation.
QUANTIFICATION AND STATISTICAL ANALYSIS
All the kinetic assays were measured at least three times, and the results were reported with Mean ± SEM.
DATA AND CODE AVAILABILITY
Atomic coordinates and structure factors have been deposited in the Protein Data Bank (PDB) under the accession number 6ULG. Electron density maps have been deposited in EM Data Bank under the accession number EMD-20814.
Supplementary Material
Supplementary Figure 1. Structural determination of the FLCN-FNIP2-Rag-Ragulator complex (Related to Figure 1)
A. Workflow for data processing of the FLCN-FNIP2-Rag-Ragulator dataset.
B. Sample images for the 2D clustering of the FLCN-FNIP2-Rag-Ragulator complex. Views of the complex from different perspectives can be observed and clustered from the dataset.
C & D. Half-set gold-standard Fourier shell correlation (FCS) (A) and map-model FSC (B) for the FLCN-FNIP2-Rag-Ragulator.
E. Local resolution of the FLCN-FNIP2-Rag-Ragulator cryo-EM density map.
Supplementary Figure 2. Structural model for FLCN-FNIP2 (Related to Figure 2)
A-C. Sample regions from the cryo-EM density maps and the fitted structural model for α-helical (A), β-strand (B), and loop (C) regions of FLCN. Secondary structures and bulky side chains can be registered and resolved at the current resolution.
D. Architecture of FLCN, domain arrangement, and registration of secondary structure.
E. Architecture of FNIP2, domain arrangement, and registration of secondary structure.
Supplementary Figure 3. Nucleotide binding of the Rag GTPases (Related to Figure 3)
A & B. Bound nucleotide and the corresponding cryo-EM density for RagA (A) and RagC (B). Switch I of RagA vanishes as indicated by the dashed line. Switch I of RagC is shown in blue.
Supplementary Figure 4. Stimulated hydrolysis assay to probe the effect of FLCN-FNIP2 (Related to Figure 4)
A. Sample time course of a GTP hydrolysis reaction when the reaction was let to reach completion. Only ~50% of the GTP was hydrolyzed, suggesting the bound GTP from only one subunit was stimulated to hydrolyze by FLCN-FNIP2. This experiment was repeated twice and a representative data set is shown here.
B. Specificity of GTP hydrolysis reaction using mutant RagA(Q66L) or RagC(Q120L). The Rag GTPase heterodimers carrying the RagC(Q120L) mutation abolish the stimulatory effect of FLCN-FNIP2, while those carrying the RagA(Q66L) mutation maintain it. This experiment was repeated twice and a representative data set is shown here.
C. Single turnover GTP hydrolysis assay to determine the influence of Ragulator on the stimulatory effect of FLCN-FNIP2.
D. Ragulator has mild impact on the stimulatory effect of FLCN-FNIP2. When the Rag GTPases bind Ragulator, FLCN-FNIP2 stimulates GTP hydrolysis to a similar extent as the Rag GTPases alone. This experiment was repeated twice and a representative data set is shown here.
Highlights.
Cryo-EM structure of the FLCN-FNIP2-Rag-Ragulator complex at 3.3Å resolution
FLCN-FNIP2 adopts a “dimer of dimer” configuration
Arg164 of FLCN is the catalytic residue for the GAP activity towards RagC
FLCN-FNIP2 binds to the Rag GTPases in an on-pathway intermediate conformation
Acknowledgements
We thank all members of the Sabatini Laboratory for helpful insights. We thank Sarah Loerch, Nikolaus Grigorieff, Robert Grant, Edward Brignole, and Chi Nguyen for technical support, and the high-performance computing team at Whitehead, Craig Andrew, Paul McCabe, Robert Taylor, Peter Macfarlane, for the installation and maintenance of data-processing servers. This work was supported by grants from the NIH (R01 CA103866, R01 CA129105 and R37 AI47389), the Department of Defense (W81XWH-15-1-0230), and the Lustgarten Foundation to D.M.S., and fellowship supports from Tuberous Sclerosis Association (TSA) to K.B.R. and from the Life Sciences Research Foundation to K.S., where he is a Pfizer Fellow. H.-T.C., R.K.H., and Z.Y. were supported by the Howard Hughes Medical Institute. D.M.S. is an investigator of the Howard Hughes Medical Institute and an American Cancer Society Research Professor.
Footnotes
Publisher's Disclaimer: This is a PDF file of an unedited manuscript that has been accepted for publication. As a service to our customers we are providing this early version of the manuscript. The manuscript will undergo copyediting, typesetting, and review of the resulting proof before it is published in its final form. Please note that during the production process errors may be discovered which could affect the content, and all legal disclaimers that apply to the journal pertain.
Declaration of interests
The authors declare no conflict of interest.
References
- Adams PD, Afonine PV, Bunkoczi G, Chen VB, Davis IW, Echols N, Headd JJ, Hung LW, Kapral GJ, Grosse-Kunstleve RW, et al. (2010). PHENIX: a comprehensive Python-based system for macromolecular structure solution. Acta Crystallogr D Biol Crystallogr 66, 213–221. [DOI] [PMC free article] [PubMed] [Google Scholar]
- Anandapadamanaban M, Masson GR, Perisic O, Berndt A, Kaufman J, Johnson CM, Santhanam B, Rogala KB, Sabatini DM, and Williams RL (2019). Architecture of human Rag GTPase heterodimers and their complex with mTORC1. Science 366, 203–210. [DOI] [PMC free article] [PubMed] [Google Scholar]
- Aylett CH, Sauer E, Imseng S, Boehringer D, Hall MN, Ban N, and Maier T (2016). Architecture of human mTOR complex 1. Science 351, 48–52. [DOI] [PubMed] [Google Scholar]
- Baba M, Hong SB, Sharma N, Warren MB, Nickerson ML, Iwamatsu A, Esposito D, Gillette WK, Hopkins RF 3rd, Hartley JL, et al. (2006). Folliculin encoded by the BHD gene interacts with a binding protein, FNIP1, and AMPK, and is involved in AMPK and mTOR signaling. Proc Natl Acad Sci USA 103, 15552–15557. [DOI] [PMC free article] [PubMed] [Google Scholar]
- Bar-Peled L, Chantranupong L, Cherniack AD, Chen WW, Ottina KA, Grabiner BC, Spear ED, Carter SL, Meyerson M, and Sabatini DM (2013). A Tumor Suppressor Complex with GAP Activity for the Rag GTPases That Signal Amino Acid Sufficiency to mTORC1. Science 340, 1100–1106. [DOI] [PMC free article] [PubMed] [Google Scholar]
- Bar-Peled L, Schweitzer LD, Zoncu R, and Sabatini DM (2012). Ragulator Is a GEF for the Rag GTPases that Signal Amino Acid Levels tomTORC1. Cell 150, 1196–1208. [DOI] [PMC free article] [PubMed] [Google Scholar]
- Baretic D, Berndt A, Ohashi Y, Johnson CM, and Williams RL (2016). Tor forms a dimer through an N-terminal helical solenoid with a complex topology. Nat Commun 7. [DOI] [PMC free article] [PubMed] [Google Scholar]
- Birt AR, Hogg GR, and Dube WJ (1977). Hereditary multiple fibrofolliculomas with trichodiscomas and acrochordons. Arch Dermatol 113, 1674–1677. [PubMed] [Google Scholar]
- Chen VB, Arendall WB 3rd, Headd JJ, Keedy DA, Immormino RM, Kapral GJ, Murray LW, Richardson JS, and Richardson DC (2010). MolProbity: all-atom structure validation for macromolecular crystallography. Acta Crystallogr D Biol Crystallogr 66, 12–21. [DOI] [PMC free article] [PubMed] [Google Scholar]
- Chen X, Liu M, Tian Y, Li J, Qi Y, Zhao D, Wu Z, Huang M, Wong CCL, Wang HW, et al. (2018). Cryo-EM structure of human mTOR complex 2. Cell Res 28, 518–528. [DOI] [PMC free article] [PubMed] [Google Scholar]
- Daumke O, Weyand M, Chakrabarti PP, Vetter IR, and Wittinghofer A (2004). The GTPase-activating protein Rap1GAP uses a catalytic asparagine. Nature 429, 197–201. [DOI] [PubMed] [Google Scholar]
- de Araujo MEG, Naschberger A, Furnrohr BG, Stasyk T, Dunzendorfer-Matt T, Lechner S, Welti S, Kremser L, Shivalingaiah G, Offterdinger M, et al. (2017). Crystal structure of the human lysosomal mTORC1 scaffold complex and its impact on signaling. Science 358, 377–381. [DOI] [PubMed] [Google Scholar]
- Drozdetskiy A, Cole C, Procter J, and Barton GJ (2015). JPred4: a protein secondary structure prediction server. Nucleic Acids Res 43, W389–394. [DOI] [PMC free article] [PubMed] [Google Scholar]
- Emsley P, Lohkamp B, Scott WG, and Cowtan K (2010). Features and development of Coot. Acta Crystallogr D Biol Crystallogr 66, 486–501. [DOI] [PMC free article] [PubMed] [Google Scholar]
- Gong R, Li L, Liu Y, Wang P, Yang HR, Wang L, Cheng JD, Guan KL, and Xu YH (2011). Crystal structure of the Gtr1p-Gtr2p complex reveals new insights into the amino acid-induced TORC1 activation. Gene Dev 25, 1668–1673. [DOI] [PMC free article] [PubMed] [Google Scholar]
- Gonzalez A, and Hall MN (2017). Nutrient sensing and TOR signaling in yeast and mammals. Embo J 36, 397–408. [DOI] [PMC free article] [PubMed] [Google Scholar]
- Grant T, Rohou A, and Grigorieff N (2018). cisTEM, user-friendly software for single-particle image processing. Elife 7. [DOI] [PMC free article] [PubMed] [Google Scholar]
- Hasumi H, Baba M, Hasumi Y, Lang M, Huang Y, Oh HF, Matsuo M, Merino MJ, Yao M, Ito Y, et al. (2015). Folliculin-interacting proteins Fnip1 and Fnip2 play critical roles in kidney tumor suppression in cooperation with Flcn. Proc Natl Acad Sci USA 112, E1624–1631. [DOI] [PMC free article] [PubMed] [Google Scholar]
- Hasumi H, Baba M, Hong SB, Hasumi Y, Huang Y, Yao M, Valera VA, Linehan WM, and Schmidt LS (2008). Identification and characterization of a novel folliculin-interacting protein FNIP2. Gene 415, 60–67. [DOI] [PMC free article] [PubMed] [Google Scholar]
- Inoki K, Li Y, Xu T, and Guan KL (2003). Rheb GTPase is a direct target of TSC2 GAP activity and regulates mTOR signaling. Gene Dev 17, 1829–1834. [DOI] [PMC free article] [PubMed] [Google Scholar]
- Jeong JH, Lee KH, Kim YM, Kim DH, Oh BH, and Kim YG (2012). Crystal Structure of the Gtr1p(GTP)-Gtr2p(GDP) Protein Complex Reveals Large Structural Rearrangements Triggered by GTP-to-GDP Conversion. J Biol Chem 287, 29648–29653. [DOI] [PMC free article] [PubMed] [Google Scholar]
- Kim E, Goraksha-Hicks P, Li L, Neufeld TP, and Guan KL (2008). Regulation of TORC1 by Rag GTPases in nutrient response. Nat Cell Biol 10, 935–945. [DOI] [PMC free article] [PubMed] [Google Scholar]
- Kim J, and Guan KL (2019). mTOR as a central hub of nutrient signalling and cell growth. Nat Cell Biol 21, 63–71. [DOI] [PubMed] [Google Scholar]
- Li Y, Inoki K, and Guan KL (2004). Biochemical and functional characterizations of small GTPase Rheb and TSC2 GAP activity. Mol Cell Biol 24, 7965–7975. [DOI] [PMC free article] [PubMed] [Google Scholar]
- Liebschner D, Afonine PV, Baker ML, Bunkóczi G, Chen VB, Croll TI, Hintze B, Hung L-W, Jain S, McCoy AJ, et al. (2019). Macromolecular structure determination using X-rays, neutrons and electrons: recent developments in Phenix. Acta Crystallographica Section D Structural Biology 75, 861–877. [DOI] [PMC free article] [PubMed] [Google Scholar]
- Mastronarde DN (2005). Automated electron microscope tomography using robust prediction of specimen movements. Journal of Structural Biology 152, 36–51. [DOI] [PubMed] [Google Scholar]
- Mathieu J, Detraux D, Kuppers D, Wang Y, Cavanaugh C, Sidhu S, Levy S, Robitaille AM, Ferreccio A, Bottorff T, et al. (2019). Folliculin regulates mTORC1/2 and WNT pathways in early human pluripotency. Nat Commun 10. [DOI] [PMC free article] [PubMed] [Google Scholar]
- Menon S, Dibble CC, Talbott G, Hoxhaj G, Valvezan AJ, Takahashi H, Cantley LC, and Manning BD (2014). Spatial Control of the TSC Complex Integrates Insulin and Nutrient Regulation of mTORC1 at the Lysosome. Cell 156, 771–785. [DOI] [PMC free article] [PubMed] [Google Scholar]
- Mishra AK, and Lambright DG (2016). Small GTPases and Their GAPs. Biopolymers 105, 431–448. [DOI] [PMC free article] [PubMed] [Google Scholar]
- Mu ZK, Wang L, Deng W, Wang JW, and Wu G (2017). Structural insight into the Ragulator complex which anchors mTORC1 to the lysosomal membrane. Cell Discov 3. [DOI] [PMC free article] [PubMed] [Google Scholar]
- Nakashima N, Hayashi N, Noguchi E, and Nishimoto T (1996). Putative GTPase Gtr1p genetically interacts with the RanGTPase cycle in Saccharomyces cerevisiae. J Cell Sci 109, 2311–2318. [DOI] [PubMed] [Google Scholar]
- Nakashima N, Noguchi E, and Nishimoto T (1999). Saccharomyces cerevisiae putative G protein, Gtr1p, which forms complexes with itself and a novel protein designated as Gtr2p, negatively regulates the Ran/Gsp1p G protein cycle through Gtr2p. Genetics 152, 853–867. [DOI] [PMC free article] [PubMed] [Google Scholar]
- Nookala RK, Langemeyer L, Pacitto A, Ochoa-Montano B, Donaldson JC, Blaszczyk BK, Chirgadze DY, Barr FA, Bazan JF, and Blundell TL (2012). Crystal structure of folliculin reveals a hidDENN function in genetically inherited renal cancer. Open Biol 2, 120071. [DOI] [PMC free article] [PubMed] [Google Scholar]
- Pacitto A, Ascher DB, Wong LH, Blaszczyk BK, Nookala RK, Zhang NS, Dokudovskaya S, Levine TP, and Blundell TL (2015). Lst4, the yeast Fnip1/2 orthologue, is a DENN-family protein. Open Biology 5. [DOI] [PMC free article] [PubMed] [Google Scholar]
- Pan XJ, Eathiraj S, Munson M, and Lambright DG (2006). TBC-domain GAPs for Rab GTPases accelerate GTP hydrolysis by a dual-finger mechanism. Nature 442, 303–306. [DOI] [PubMed] [Google Scholar]
- Panchaud N, Peli-Gulli MP, and De Virgilio C (2013). Amino Acid Deprivation Inhibits TORC1 Through a GTPase-Activating Protein Complex for the Rag Family GTPase Gtr1. Sci Signal 6. [DOI] [PubMed] [Google Scholar]
- Peli-Gulli MP, Sardu A, Panchaud N, Raucci S, and De Virgilio C (2015). Amino Acids Stimulate TORC1 through Lst4-Lst7, a GTPase-Activating Protein Complex for the Rag Family GTPase Gtr2. Cell Rep 13, 1–7. [DOI] [PubMed] [Google Scholar]
- Petit CS, Roczniak-Ferguson A, and Ferguson SM (2013). Recruitment of folliculin to lysosomes supports the amino acid-dependent activation of Rag GTPases. J Cell Biol 202, 1107–1122. [DOI] [PMC free article] [PubMed] [Google Scholar]
- Punjani A, Rubinstein JL, Fleet DJ, and Brubaker MA (2017). cryoSPARC: algorithms for rapid unsupervised cryo-EM structure determination. Nat Methods 14, 290–296. [DOI] [PubMed] [Google Scholar]
- Rogala KB, Gu X, Kedir JF, Abu-Remaileh M, Bianchi LF, Bottino AMS, Dueholm R, Niehaus A, Overwijn D, Fils AP, et al. (2019). Structural basis for the docking of mTORC1 on the lysosomal surface. Science. [DOI] [PMC free article] [PubMed] [Google Scholar]
- Roy A, Kucukural A, and Zhang Y (2010). I-TASSER: a unified platform for automated protein structure and function prediction. Nat Protoc 5, 725–738. [DOI] [PMC free article] [PubMed] [Google Scholar]
- Sancak Y, Bar-Peled L, Zoncu R, Markhard AL, Nada S, and Sabatini DM (2010). Ragulator-Rag Complex Targets mTORC1 to the Lysosomal Surface and Is Necessary for Its Activation by Amino Acids. Cell 141, 290–303. [DOI] [PMC free article] [PubMed] [Google Scholar]
- Sancak Y, Peterson TR, Shaul YD, Lindquist RA, Thoreen CC, Bar-Peled L, and Sabatini DM (2008). The Rag GTPases bind raptor and mediate amino acid signaling to mTORC1. Science 320, 1496–1501. [DOI] [PMC free article] [PubMed] [Google Scholar]
- Saucedo LJ, Gao XS, Chiarelli DA, Li L, Pan D, and Edgar BA (2003). Rheb promotes cell growth as a component of the insulin/TOR signalling network. Nat Cell Biol 5, 566–571. [DOI] [PubMed] [Google Scholar]
- Saxton RA, and Sabatini DM (2017). mTOR Signaling in Growth, Metabolism, and Disease. Cell 168, 960–976. [DOI] [PMC free article] [PubMed] [Google Scholar]
- Scalvenzi M, Argenziano G, Sammarco E, and Delfino M (1998). Hereditary multiple fibrofolliculomas, trichodiscomas and acrochordons: syndrome of Birt-Hogg-Dube. J Eur Acad Dermatol Venereol 11, 45–47. [PubMed] [Google Scholar]
- Scheffzek K, Ahmadian MR, Kabsch W, Wiesmuller L, Lautwein A, Schmitz F, and Wittinghofer A (1997). The Ras-RasGAP complex: structural basis for GTPase activation and its loss in oncogenic Ras mutants. Science 277, 333–338. [DOI] [PubMed] [Google Scholar]
- Schmidt LS, and Linehan WM (2018). FLCN: The causative gene for Birt-Hogg-Dube syndrome. Gene 640, 28–42. [DOI] [PMC free article] [PubMed] [Google Scholar]
- Schurmann A, Brauers A, Massmann S, Becker W, and Joost HG (1995). Cloning of a Novel Family of Mammalian Gtp-Binding Proteins (Raga, Ragb(S), Ragb(1)) with Remote Similarity to the Ras-Related Gtpases. J Biol Chem 270, 28982–28988. [DOI] [PubMed] [Google Scholar]
- Seewald MJ, Korner C, Wittinghofer A, and Vetter IR (2002). RanGAP mediates GTP hydrolysis without an arginine finger. Nature 415, 662–666. [DOI] [PubMed] [Google Scholar]
- Shen K, Choe A, and Sabatini DM (2017). Intersubunit Crosstalk in the Rag GTPase Heterodimer Enables mTORC1 to Respond Rapidly to Amino Acid Availability. Mol Cell 68, 552-+. [DOI] [PMC free article] [PubMed] [Google Scholar]
- Shen K, Huang RK, Brignole EJ, Condon KJ, Valenstein ML, Chantranupong L, Bomaliyamu A, Choe A, Hong C, Yu ZH, et al. (2018). Architecture of the human GATOR1 and GATOR1-Rag GTPases complexes. Nature 556, 64-+. [DOI] [PMC free article] [PubMed] [Google Scholar]
- Shen K, and Sabatini DM (2018). Ragulator and SLC38A9 activate the Rag GTPases through noncanonical GEF mechanisms. P Natl Acad Sci USA 115, 9545–9550. [DOI] [PMC free article] [PubMed] [Google Scholar]
- Shen K, Valenstein ML, Gu X, and Sabatini DM (2019). Arg-78 of Nprl2 catalyzes GATOR1-stimulated GTP hydrolysis by the Rag GTPases. J Biol Chem 294, 2970–2975. [DOI] [PMC free article] [PubMed] [Google Scholar]
- Stuttfeld E, Aylett CH, Imseng S, Boehringer D, Scaiola A, Sauer E, Hall MN, Maier T, and Ban N (2018). Architecture of the human mTORC2 core complex. Elife 7. [DOI] [PMC free article] [PubMed] [Google Scholar]
- Su MY, Morris KL, Kim DJ, Fu YX, Lawrence R, Stjepanovic G, Zoncu R, and Hurley JH (2017). Hybrid Structure of the RagA/C-Ragulator mTORC1 Activation Complex. Mol Cell 68, 835-+. [DOI] [PMC free article] [PubMed] [Google Scholar]
- Takagi Y, Kobayashi T, Shiono M, Wang L, Piao X, Sun G, Zhang D, Abe M, Hagiwara Y, Takahashi K, et al. (2008). Interaction of folliculin (Birt-Hogg-Dube gene product) with a novel Fnip1-like (FnipL/Fnip2) protein. Oncogene 27, 5339–5347. [DOI] [PubMed] [Google Scholar]
- Tsun ZY, Bar-Peled L, Chantranupong L, Zoncu R, Wang T, Kim C, Spooner E, and Sabatini DM (2013). The Folliculin Tumor Suppressor Is a GAP for the RagC/D GTPases That Signal Amino Acid Levels to mTORC1. Mol Cell 52, 495–505. [DOI] [PMC free article] [PubMed] [Google Scholar]
- Valvezan AJ, and Manning BD (2019). Molecular logic of mTORC1 signalling as a metabolic rheostat. Nature Metabolism 1, 321–333. [DOI] [PMC free article] [PubMed] [Google Scholar]
- Wagner T, Merino F, Stabrin M, Moriya T, Antoni C, Apelbaum A, Hagel P, Sitsel O, Raisch T, Prumbaum D, et al. (2019). SPHIRE-crYOLO is a fast and accurate fully automated particle picker for cryo-EM. Commun Biol 2, 218. [DOI] [PMC free article] [PubMed] [Google Scholar]
- Yang H, Jiang X, Li B, Yang HJ, Miller M, Yang A, Dhar A, and Pavletich NP (2017). Mechanisms of mTORC1 activation by RHEB and inhibition by PRAS40. Nature 552, 368–373. [DOI] [PMC free article] [PubMed] [Google Scholar]
- Yang H, Wang J, Liu M, Chen X, Huang M, Tan D, Dong MQ, Wong CC, Wang J, Xu Y, et al. (2016). 4.4 A Resolution Cryo-EM structure of human mTOR Complex 1. Protein Cell 7, 878–887. [DOI] [PMC free article] [PubMed] [Google Scholar]
- Yang J, Yan R, Roy A, Xu D, Poisson J, and Zhang Y (2015). The I-TASSER Suite: protein structure and function prediction. Nat Methods 12, 7–8. [DOI] [PMC free article] [PubMed] [Google Scholar]
- Yip CK, Murata K, Walz T, Sabatini DM, and Kang SA (2010). Structure of the human mTOR complex I and its implications for rapamycin inhibition. Mol Cell 38, 768–774. [DOI] [PMC free article] [PubMed] [Google Scholar]
- Yonehara R, Nada S, Nakai T, Nakai M, Kitamura A, Ogawa A, Nakatsumi H, Nakayama KI, Li SL, Standley DM, et al. (2017). Structural basis for the assembly of the Ragulator-Rag GTPase complex. Nat Commun 8. [DOI] [PMC free article] [PubMed] [Google Scholar]
- Young NP, Kamireddy A, Van Nostrand JL, Eichner LJ, Shokhirev MN, Dayn Y, and Shaw RJ (2016). AMPK governs lineage specification through Tfeb-dependent regulation of lysosomes. Gene Dev 30, 535–552. [DOI] [PMC free article] [PubMed] [Google Scholar]
- Zhang K (2016). Gctf: Real-time CTF determination and correction. J Struct Biol 193, 1–12. [DOI] [PMC free article] [PubMed] [Google Scholar]
- Zhang TL, Wang R, Wang ZJ, Wang XX, Wang F, and Ding JP (2017). Structural basis for Ragulator functioning as a scaffold in membrane-anchoring of Rag GTPases and mTORC1. Nat Commun 8. [DOI] [PMC free article] [PubMed] [Google Scholar]
- Zhang Y (2008). I-TASSER server for protein 3D structure prediction. BMC Bioinformatics 9, 40. [DOI] [PMC free article] [PubMed] [Google Scholar]
- Zheng SQ, Palovcak E, Armache JP, Verba KA, Cheng Y, and Agard DA (2017). MotionCor2: anisotropic correction of beam-induced motion for improved cryo-electron microscopy. Nat Methods 14, 331–332. [DOI] [PMC free article] [PubMed] [Google Scholar]
- Zivanov J, Nakane T, Forsberg BO, Kimanius D, Hagen WJ, Lindahl E, and Scheres SH (2018). New tools for automated high-resolution cryo-EM structure determination in RELION-3. Elife 7. [DOI] [PMC free article] [PubMed] [Google Scholar]
- Zivanov J, Nakane T, and Scheres SHW (2019). A Bayesian approach to beam-induced motion correction in cryo-EM single-particle analysis. IUCrJ 6, 5–17. [DOI] [PMC free article] [PubMed] [Google Scholar]
Associated Data
This section collects any data citations, data availability statements, or supplementary materials included in this article.
Supplementary Materials
Supplementary Figure 1. Structural determination of the FLCN-FNIP2-Rag-Ragulator complex (Related to Figure 1)
A. Workflow for data processing of the FLCN-FNIP2-Rag-Ragulator dataset.
B. Sample images for the 2D clustering of the FLCN-FNIP2-Rag-Ragulator complex. Views of the complex from different perspectives can be observed and clustered from the dataset.
C & D. Half-set gold-standard Fourier shell correlation (FCS) (A) and map-model FSC (B) for the FLCN-FNIP2-Rag-Ragulator.
E. Local resolution of the FLCN-FNIP2-Rag-Ragulator cryo-EM density map.
Supplementary Figure 2. Structural model for FLCN-FNIP2 (Related to Figure 2)
A-C. Sample regions from the cryo-EM density maps and the fitted structural model for α-helical (A), β-strand (B), and loop (C) regions of FLCN. Secondary structures and bulky side chains can be registered and resolved at the current resolution.
D. Architecture of FLCN, domain arrangement, and registration of secondary structure.
E. Architecture of FNIP2, domain arrangement, and registration of secondary structure.
Supplementary Figure 3. Nucleotide binding of the Rag GTPases (Related to Figure 3)
A & B. Bound nucleotide and the corresponding cryo-EM density for RagA (A) and RagC (B). Switch I of RagA vanishes as indicated by the dashed line. Switch I of RagC is shown in blue.
Supplementary Figure 4. Stimulated hydrolysis assay to probe the effect of FLCN-FNIP2 (Related to Figure 4)
A. Sample time course of a GTP hydrolysis reaction when the reaction was let to reach completion. Only ~50% of the GTP was hydrolyzed, suggesting the bound GTP from only one subunit was stimulated to hydrolyze by FLCN-FNIP2. This experiment was repeated twice and a representative data set is shown here.
B. Specificity of GTP hydrolysis reaction using mutant RagA(Q66L) or RagC(Q120L). The Rag GTPase heterodimers carrying the RagC(Q120L) mutation abolish the stimulatory effect of FLCN-FNIP2, while those carrying the RagA(Q66L) mutation maintain it. This experiment was repeated twice and a representative data set is shown here.
C. Single turnover GTP hydrolysis assay to determine the influence of Ragulator on the stimulatory effect of FLCN-FNIP2.
D. Ragulator has mild impact on the stimulatory effect of FLCN-FNIP2. When the Rag GTPases bind Ragulator, FLCN-FNIP2 stimulates GTP hydrolysis to a similar extent as the Rag GTPases alone. This experiment was repeated twice and a representative data set is shown here.
Data Availability Statement
Atomic coordinates and structure factors have been deposited in the Protein Data Bank (PDB) under the accession number 6ULG. Electron density maps have been deposited in EM Data Bank under the accession number EMD-20814.