Abstract
Avian influenza (AI) is a viral infectious disease that affects all species of domestic and wild birds. The viruses causing this disease can be of high (HPAI) or low (LPAI) pathogenicity and represent a continuous threat to poultry in Europe. Council Directive 2005/94/EC requests EU Member States (MSs) to carry out surveillance in poultry and wild birds and notify the results to the responsible authority. Therefore, MSs and Switzerland have implemented surveillance programmes to yearly monitor incursions of AI viruses in poultry and wild birds. EFSA received a mandate from the European Commission, to collate, validate, analyse and summarise in an annual report the data resulting from the avian influenza surveillance programmes. This is the first report produced under this mandate summarising the results of the surveillance activities carried out in poultry and wild birds in 2018. Overall 18,596 poultry establishments were sampled, of which 43 were seropositive for H5 AI and two for H7 AI. Seropositive establishments were found in 11 MSs, with the highest percentage of seropositive establishments being found in waterfowl gamebird, and geese and duck breeding establishments. A total of 9,145 dead/moribund wild birds were sampled, with 163 birds testing positive to HPAI virus H5N6. The infected birds were reported by eight MSs and were mostly found between January and April 2018. In this report, the wild bird species affected with HPAI are described and the strategy of targeted sampling is assessed. The crude odds ratio of HPAI detection as a function of the target species (species belonging to the list of target species versus species not belonging to the target list) is presented. The surveillance findings for poultry and wild birds for 2018 are also discussed in relation to findings from previous years and current knowledge on the epidemiology of AI in Europe.
Keywords: Avian Influenza, HPAI, LPAI, Surveillance, Poultry, Wild birds
Summary
The European Union (EU) Member States (MSs) and Switzerland have implemented surveillance programmes to yearly detect incursions of avian influenza viruses (AIV) in poultry and wild birds, particularly migratory wild birds, which are implicated in the intercontinental spread of AIV, and are considered the main source of introduction of AIV to poultry. These surveillance programmes consist of:
Serological surveys to monitor circulation of mainly low pathogenic avian influenza (LPAI) of H5 and H7 subtypes in poultry (active surveillance). These surveys preferably target poultry species or production systems with increased risk for introduction of avian influenza (AI).
Surveillance aiming at the virological detection of highly pathogenic avian influenza (HPAI) in wild birds found dead or moribund (passive surveillance). In addition, some MSs also perform active surveillance by testing living and hunted birds. Surveillance in wild birds provides an early warning system for the risk of introduction of HPAI in poultry.
In this report, we summarise the results of the surveillance activities carried out in 2018 by MSs and Switzerland, which together will be referred to as reporting countries (RC). The word ‘holding’ defined in Council Directive 2005/94/EC as ‘any agricultural or other premises, including hatcheries, circuses, zoos, pet bird shops, bird markets and aviaries, where poultry or other captive birds are being bred or kept excluding slaughterhouses, means of transport, quarantine facilities and centres, border inspection posts and laboratories authorised by the competent authority to hold avian influenza virus’, has been replaced throughout the document by the word ‘establishment’ in order to align the phraseology used in this document to Regulation (EU) No 429/20161.
1.
1.1.
Serological surveys in poultry
Twenty‐seven MSs and Switzerland reported the results of the serological surveillance activities carried out in 2018. The poultry population under survey in the RC consisted of 1,015,483 poultry establishments (PE). In 2018, a total of 18,596 (1.8%) PE were sampled. In this report, the number of PE sampled was estimated by considering each individual sampling taking place in a specific sampling period, and/or targeting a specific poultry category, as an independent event.2 As it was not possible to distinguish whether establishments reported for the January to June reporting period, had been also sampled during the July to December period, the total number of establishments sampled per RC was estimated as the sum of both figures. Likewise, it was not possible to distinguish whether establishments reported for a specific poultry category, had been also sampled and reported under a different category (if more than one species, production types coexisted in these particular establishments). These independent sampling events will be referred as ‘establishments sampled’ (as for previous reports). The number of establishments sampled by all RC was slightly higher than the number of establishments sampled in 2017 (n = 16,836). The total number of PE sampled among RC ranged from 21 PE sampled in Luxemburg, to 3,437 PE sampled in the Netherlands, with the median number of PE sampled among RC being 320. Conventional and/or free‐range laying hen establishments were sampled by all RC. These two poultry categories, together with fattening turkeys, were the most frequently sampled PE (they were targeted by most RC). In terms of the number of PE sampled, conventional laying hens was the most sampled category (n = 3,462).
Out of the 18,596 PE surveyed, 45 (0.24%) establishments were seropositive to either H5 or H7 (H5/H7); of these, 43 (0.23%) PE were detected seropositive for H5 AI and 2 (0.01%) PE were detected as seropositive for H7 AI. The overall H5/H7 seropositive percentage was 0.24%, which was 1.7 times lower than that observed in 2017 (0.42%).
Among all poultry categories, waterfowl gamebirds, geese breeders and duck breeders were the categories with the highest percentage of H5/H7 seropositive establishments; the percentage of seropositive establishments for these three categories (with number of establishments sampled in brackets) were 6.1% (n = 164), 2.9% (n = 205) and 2.2% (n = 268), respectively. Among the gallinaceous species, the highest percentage of seropositive establishments was observed in free‐range laying hens (0.5%, n = 2,213). No positive PE were found for the turkey (fattening and breeders), broiler, chicken breeder, and ratites categories.
Antibodies against AI subtypes other than H5 and H7 were also reported for 132 PE. Out of these, the largest number of seropositive establishments were observed in waterfowl (n = 61) and fattening ducks (n = 31). Among the gallinaceous categories (not including game birds), the largest numbers of seropositive establishments were found in fattening turkeys (n = 20) and both free‐range (n = 16) and conventional laying hens (n = 16). The lowest number of seropositive establishments were found in the broiler (n = 1) and duck breeder categories (n = 1).
In 2018, an overall reduction in the percentage of H5/H7 seropositive establishments compared to 2017 was observed. Here, and similarly to previous years, the H5 seropositive percentage was higher than the H7 seropositive percentage. Among the different poultry categories, the highest percentage of seropositive establishments were found in aquatic poultry (goose and duck species). These observations are in line with the highest risk of infection expected for these poultry categories. Despite the large number of backyard establishments tested, the percentage of seropositive establishments in this category was one of the lowest.
Surveillance in wild birds
The results from the surveillance activities carried out in wild birds in 2018 were reported by 26 MSs and Switzerland. All RC performed passive surveillance but some RC (n = 10) also performed active surveillance, with Belgium, Germany and Spain reporting a higher number of birds sampled by active surveillance than by passive surveillance. Overall, a total of 15,252 birds were sampled by passive (n = 9,145) or active (n = 6,107) surveillance. This report focusses mainly on summarising the passive surveillance results. The total number of birds tested by passive surveillance by RC ranged from 13 birds in Greece to 2,019 birds in Italy, with the median number of birds tested being 142.
A total of 255 wild bird species belonging to 24 orders were sampled by passive surveillance. Out of the 9,145 birds sampled by passive surveillance, the highest number of samples originated from birds belonging to the order Anseriformes (n = 2,625, 29%). Other birds sampled with high frequency were from the orders Passeriformes (n = 1,682, 18%), Falconiformes (n = 1,577, 17%), and Charadriiformes (n = 1,062, 12%). From the 255 species sampled, 44 were listed as target (high risk of being exposed to H5 HPAI and subsequently suffering a fatal infection) species (2017 updated list by EFSA). The number of birds sampled belonging to these target species was 4,082 (44.6%).
Positive results for HPAI were reported by eight RC (Denmark, Finland, Germany, Ireland, the Netherlands, Slovakia, Sweden and the United Kingdom); among these, a total of 163 birds were found positive for H5N6 HPAI. No other HPAI virus subtype was found in wild birds. All these positive cases were detected by passive surveillance only. Most of these detections took place between January and April; however, there were also positive detections later in the year, with the last positive bird being found in September. Birds from the orders Anseriformes and Charadriiformes were found positive mainly during the first 6 weeks of the year, while birds of the order Falconiformes were found positive afterwards. From the 163 positive birds, 137 belonged to the target (high risk) species. The percentage of positive detections of HPAI in 2018 (1.8%) was lower than the percentages of detection observed in 2017 (9.7%) and 2016 (7.3%). The main circulating virus in 2016 and 2017 was an H5N8 HPAI virus subtype which caused high mortality in affected birds.
An evaluation of the probability of detection of HPAI viruses when sampling species included in the target list of high‐risk species (compared to birds not in this list), was carried out based on data provided by RC. The results of the univariable analysis show that the testing of birds belonging to the list of target species increases the probability of detection (measured as the crude odds ratio) of HPAI viruses.
RC also reported detections of LPAI virus. A total of 422 birds out of the 15,252 birds sampled by either active, or passive surveillance, were reported as positive by 13 RC. The average detection percentages among data from these two surveillance types, were 0.12% for H5 LPAI, 0.01% for H7 LPAI and 2.15% for non‐H5/H7 LPAI virus.
In summary, a lower percentage of HPAI infected wild birds were detected in 2018 compared to the previous 2 years. There are two plausible explanations for this: (a) there was less mortality in wild birds from the H5N6 HPAI virus circulating in 2018 compared to the mortality caused by the H5N8 HPAI virus circulating in 2017, and/or (b) the transmission of the H5N6 virus among wild birds was lower than that of the H5N8 virus. In 2018 and similarly to 2017, most cases were detected during the first months of the year. It is important to note that despite the apparent lower mortality or transmission among infected wild birds observed in 2018 (as compared to the 2016–2017 H5N8 HPAI), passive surveillance still allowed the detection of the H5N6 virus (with this virus only being detected by passive surveillance). Finally, targeting surveillance to high‐risk species could improve the efficacy/effectiveness of the surveillance programme.
1. Introduction
Avian influenza (AI) is a contagious disease that can affect all bird species. The infection is caused by Avian Influenza A viruses (AIV), which are classified into different antigenic subtypes based on their surface glycoproteins: haemagglutinin (H) and neuraminidase (N). To date, 16 H (H1–H16) and 9 N (N1–N9) glycoproteins have been identified in viruses isolated from avian hosts (Fouchier et al., 2005). AIV are also classified according to their pathogenicity into high pathogenic avian influenza (HPAI) viruses and low pathogenic avian influenza (LPAI) viruses. While all non‐H5/H7 AIV subtypes reported so far are low pathogenic (with very few exceptions) and usually cause mild disease when affecting poultry, viruses of the subtypes H5 and H7 can be either of low or high pathogenicity, with LPAI viruses of these subtypes being able to mutate to HPAI viruses in poultry. HPAI infections spread rapidly and cause significant disease and mortality in many bird species, with epizootics of H5 HPAI virus having been reported in several countries in Asia, Africa, Europe and North America (EFSA AHAW Panel et al., 2017).
Wild birds of the orders Anseriformes and Charadriiformes are considered major reservoirs for LPAI viruses; during the last years, wild birds have been also implicated in the intercontinental spread of H5 HPAI viruses (The Global Consortium for H5N8 and Related Influenza Viruses, 2016). Hence, wild birds are considered the main source of introduction of AIV infections in poultry in Europe (CVI et al., 2017). To implement appropriate measures to prevent incursions, or to control the spread of the disease when incursions occur, Member States (MSs) have implemented surveillance programmes in poultry and wild birds. For poultry, serological surveillance programmes aiming at detecting circulation of LPAI viruses of H5 and H7 subtypes are implemented (European Commission, 2010; SCAHAW, 2000). For wild birds, passive surveillance programmes, which target the detection of HPAI, are put into place.
Below, a description of the legislative frame for the development and implementation of these surveillance programmes is presented. Also, the Terms of Reference of the European Commission mandate to the European Food Safety Authority (EFSA), related to the production of this report, are described.
1.1. Background and Terms of Reference
EU legislation on avian influenza (AI) requires Member States (MSs) to carry out compulsory surveillance programmes in poultry and wild birds.
The objective of the surveillance programme for AI in poultry, as stated in Annex I of Commission Decision 2010/367/EU3 is: ‘to inform the competent authority of circulating avian influenza virus with a view to controlling the disease in accordance with Directive 2005/94/EC4 by the annual detection through active surveillance for:
low pathogenicity avian influenza (LPAI) of subtypes H5 and H7 in gallinaceous birds (chickens, turkeys, guinea fowl, pheasants, partridges and quails) and ratites thereby complementing other existing early detection systems.
LPAI of subtypes H5 and H7 and highly pathogenic avian influenza (HPAI) in domestic waterfowl (ducks, geese and mallards for re‐stocking supplies of game)’.
The objective of the surveillance programme for AI in wild birds, as stated in Annex II of Commission Decision 2010/367/EU is ‘the timely detection of HPAI of the subtype H5N1 in wild birds in order to protect poultry in poultry holdings and safeguard veterinary public health’.5 Also, as described in Decision 2018/1136/EU6, the identification and review of areas that are at particular risk for the introduction of HPAI viruses into poultry establishments, should be carried out by MSs, ensuring that increased passive surveillance of the wild bird populations takes place in these ‘higher risk areas’.
Guidelines for the implementation of the surveillance programmes have been provided by the EC. The EC guidelines also include a list of wild bird ‘Target Species’ which is under constant review as new evidence is generated when HPAI epidemics occur in Europe. As a result, EFSA published a scientific report providing further guidance to adjust wild bird surveillance to susceptible European species for the detection of H5 HPAI by passive surveillance (EFSA AHAW Panel et al., 2017).
Under Directive 2005/94/EC, MSs are requested to submit the results of these surveillance programmes to the competent authority. The EC has overseen the collection of the data from the MSs surveillance activities up to, and including, data for 2018. Also, the former European Reference Laboratory for AI was tasked with the production of the annual surveillance report up to 2018, when the report describing the 2017 surveillance activities was produced (APHA, 2017).
Late in 2017, EFSA received a mandate with the Terms of Reference being to: ‘collect, collate, validate, analyse and summarise in an annual report the results from avian influenza surveillance carried out by Member States in poultry and wild birds’. In the context of Article 31 of Regulation (EC) No 178/2002, from 2019 onwards, EFSA was requested to provide the technical and scientific assistance to the Commission to deliver on this mandate. This implies that EFSA, starting in 2019, will be in charge of producing the annual surveillance report on AI, describing the data collected by MSs in 2018. Also, the collation of all data relevant to the surveillance activities taking place in MSs will be done by EFSA starting in January 2019.
1.2. Interpretation of the TOR
One of the activities derived from the mandate described above was the production of the AI annual surveillance report; here below, the first annual surveillance report on AI generated by EFSA is presented. The data submitted by MSs to the European Commission, compiling the results of the surveillance activities performed in poultry and wild birds in 2018, are summarised. These data were collected and recorded at a MS level following the directives mentioned in Section 1.1, and subsequently reported to the European Commission. In this report, first, the surveillance results of the poultry and wild bird surveillance programmes are presented and discussed. Finally, a brief description of the surveillance methods, and the reporting framework, are provided.
2. Results
2.1. Poultry
2.1.1. Number of poultry establishments sampled
Twenty‐seven MSs and Switzerland, here referred to as reporting countries (RC), reported their serological surveillance activities in 2018.7 A total of 1,015,483 poultry establishments (PE) were reported, among RC, from regions where sampling took place (data on the total number of PE in regions where sampling did not occur were not available).8 From these, a total of 18,596 PE (1.8%) were sampled as part of the RC surveillance programmes. In this report, the numbers reported as establishments sampled refer to the total number of sampling events taking place in a specific date, and for each of the reported poultry categories (see Methods Section 4.4 for further details). In Figure 1, the number of PE in the regions where sampling took place, and the number of PE sampled, reported for the 2018 surveillance year, are presented. Also, using a gradient scale of blue and for each RC, the poultry categories with the largest number of establishments sampled, are highlighted.
Figure 1.
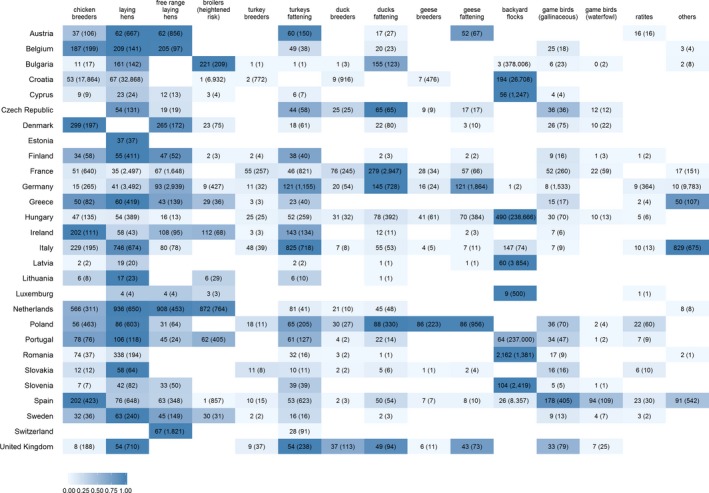
Total number of poultry establishments (PE) sampled, and maximum number of PE reported at any of the two reporting periods for the regions where sampling took place (brackets), presented by RC and poultry category. A scale of blue (going from darker to lighter blue colours) is used to highlight poultry categories with the largest number of PE sampled per RC
Surveillance in RC varied in both the number of PE sampled and the poultry categories targeted for surveillance (Figure 1). For instance, in terms of the most sampled poultry categories per RC, Italy targeted mainly fattening turkey and laying hens (apart from ‘Others’, which was the category containing the largest number of establishments sampled), while the Netherlands sampled free‐range, conventional laying hen and broiler (at heightened risk) establishments mostly. In France, the category where the largest number of samples originated from was fattening ducks. Countries such as Croatia, Cyprus, Hungary and Romania sampled backyard flocks mostly (Figure 1). An overview of the total number of PE sampled by each RC and for each poultry category are provided in Figures 3A and 5A, respectively.
Figure 3.
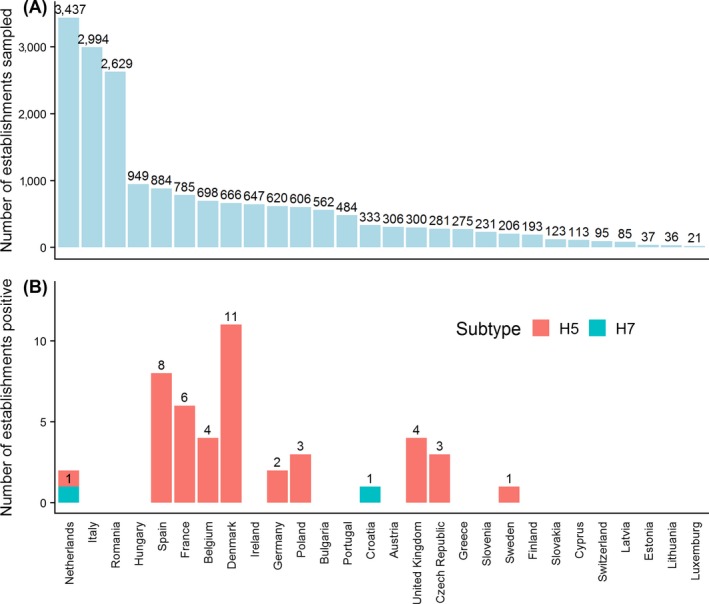
(A) Total number of establishments sampled per RC in 2018 shown in descending order and (B) total number of serologically positive establishments found for AI virus subtypes H5 (light red colour) and H7 (blue colour)
Figure 5.
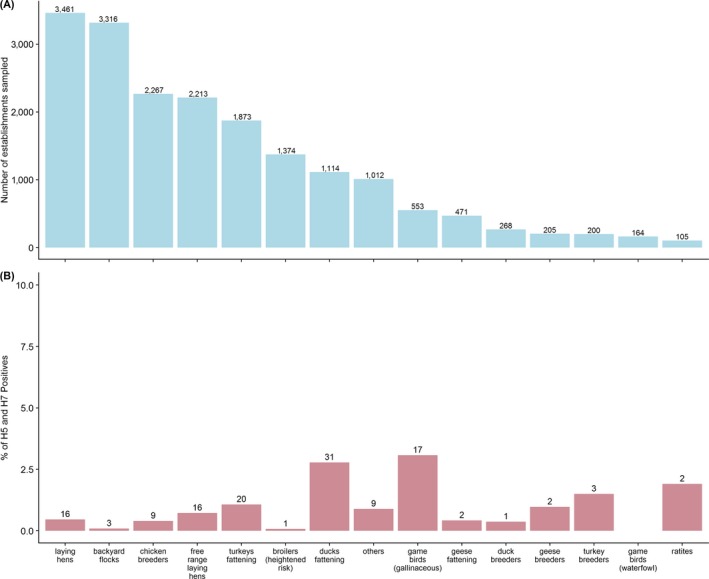
(A) Total number of establishments sampled by poultry category with values above the bars referring to the number of establishments sampled; (B) percentage (y‐axis) and number (above bars) of establishments sampled that tested serologically positive to H5 or H7 AI virus by poultry category
When looking at the poultry categories most frequently targeted by RC, all RC sampled birds in the categories of conventional or free‐range laying hens. These two categories, together with fattening turkey, were the most frequently sampled poultry categories among RC (Figure 1 and Figure A.1 – Appendix A).
Figure A.1.
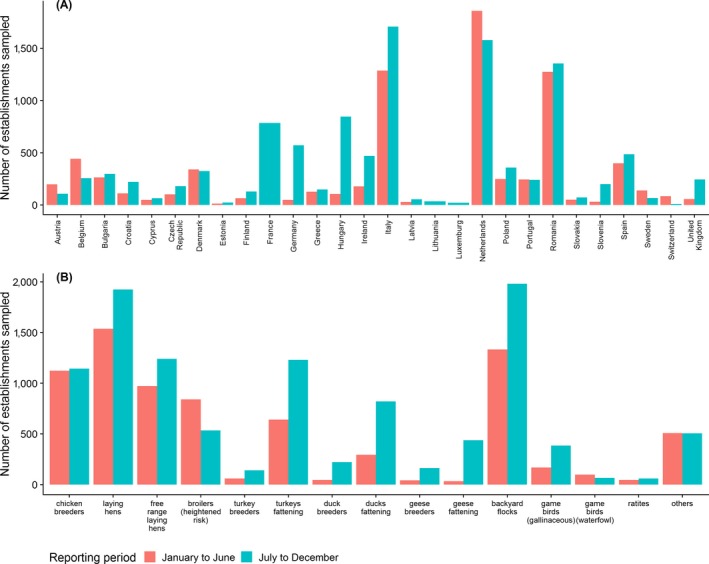
Total number of PE sampled during the periods January to June and July to December. (A) Results are shown by RC and (B) by poultry category
In terms of the timing of the sampling, most of the sampling took place in the second half of the year (July to December), with some countries only reporting data from this period. A total of 10,854 establishments were reported as sampled from July to December 2018, while 7,742 establishments were reported as sampled in the reporting period going from January to June. Figure A.1 in Appendix A, shows a summary of the total number of samples reported by reporting period, by RC (A1‐(A)) and by poultry category (A1‐(B)).
2.1.2. Avian influenza in poultry
2.1.2.1. Serological results overview
In 2018, overall, 43 establishments tested positive for AI H5 and two for H7 (Figure 2). The combined H5/H7 seropositive percentage was 0.24%, 1.7 times lower than the seropositive percentage in 2017 (0.42%). The percentage of AI H5 seropositive establishments was 0.23%; this number, although slightly higher than that of the years before 2016, is lower than the percentages found in 2016 and 2017. The percentage of AI H7 seropositive establishments was 0.01%; this number was also lower than the equivalents in 2016 and 2017, but not much different from previous years. In 2018, the total number of establishments sampled (n = 18,596) was higher than for 2016 and 2017, but lower than the years before. In general, a downward trend in the number of establishments sampled has been observed in Europe since 2009 (Figure 2A).
Figure 2.
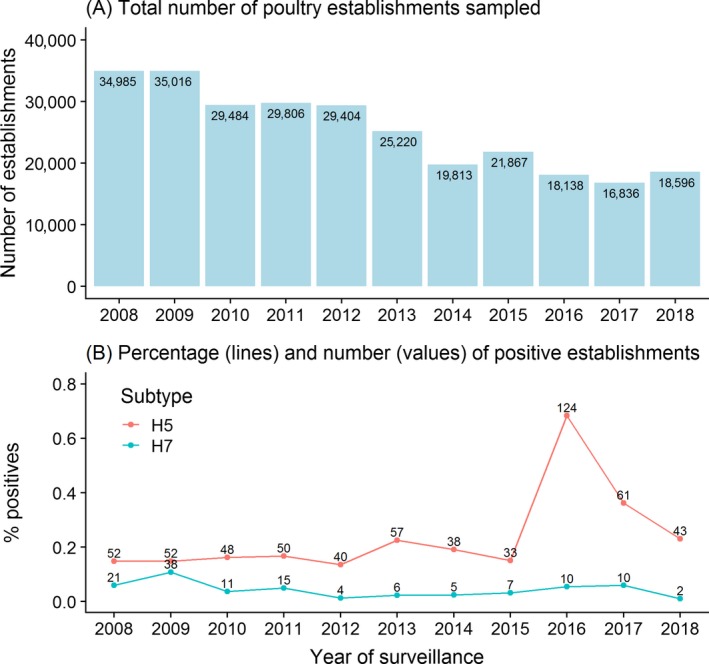
(A) Total number of poultry establishments sampled per year and (B) line graph of the percentage of the AI seropositive establishments of the H5 (red line) and H7 subtypes (blue line), with the number of seropositive establishments shown per year
2.1.2.2. Serological results by Reporting Countries
Considerable variation in the number of establishments sampled among RC was observed in 2018 (Figure 3), this was also the case among regions within each RC (Figure 4). The total number of PE sampled among RC ranged from 21 in Luxemburg, to 3,437 in the Netherlands, with the median number of PE sampled among RC being 320 (Figure 3). Variation among RC in terms of the number of establishments testing seropositive to either H5 or H7 AI was also noticed. Eleven RC reported the detection of seropositive establishments, most of these detections being AI H5 (n = 43). Two RC, the Netherlands and Croatia, reported the detection of one AI H7 seropositive establishment each (Figure 3).
Figure 4.
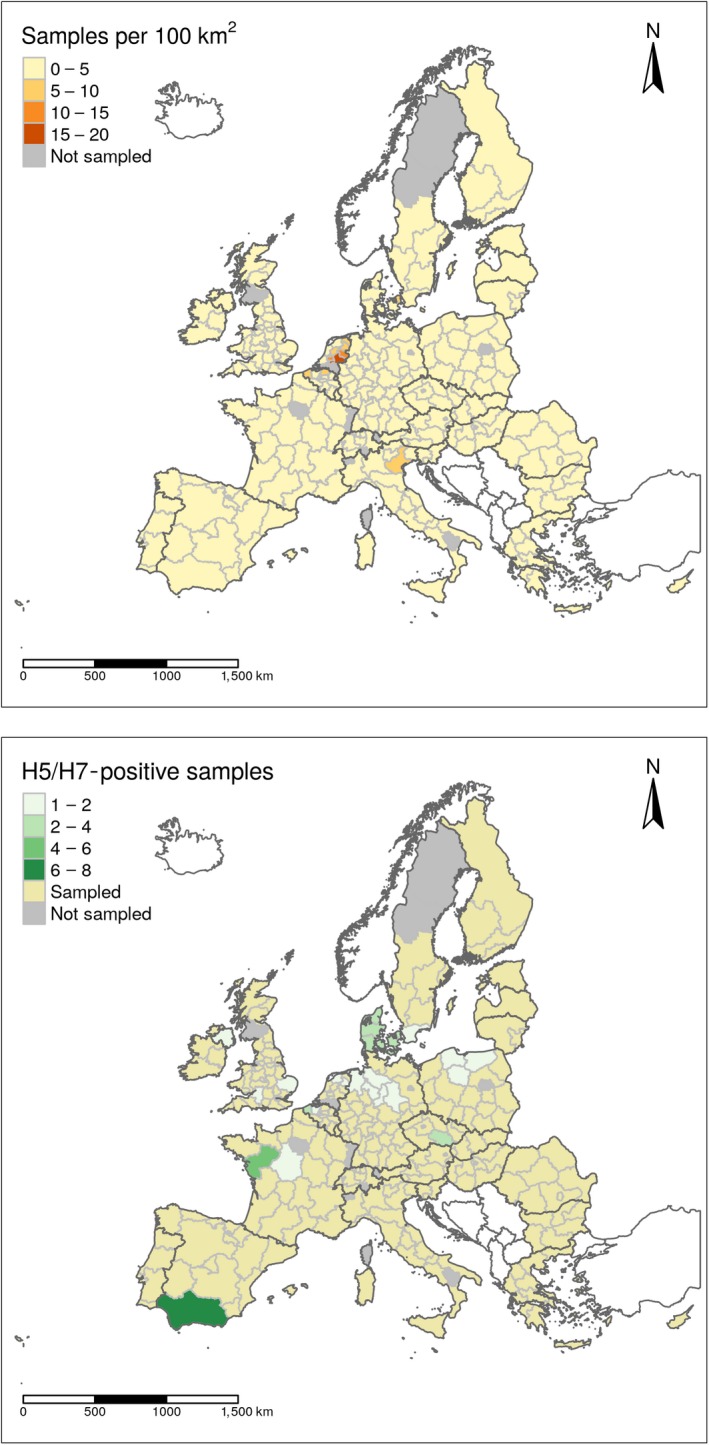
Sampling density expressed as the number of establishments sampled per 100 km2 (upper map) and geographical distribution of AI H5 and H7 seropositive establishments (lower map) showed at NUTS 2 level. Countries which are not part of the EU are shown in white (excluding Switzerland)
In Figure 4, the geographical distribution of the surveillance activities that took place in 2018, as well as the number of H5/H7 seropositive detections, are shown at NUTS2 level. Here, two Choropleth maps are shown, with the sampling density (number of establishments sampled per 100 km2 within a NUTS 2 region), and the distribution of the seropositive establishments for AI H5 and H7 presented in the upper and lower map, respectively.
2.1.2.3. Serological results by poultry category
The highest number of establishments sampled by RC in 2018 were of the conventional laying hens category (n = 3,461), with the second largest number being backyard establishments (n = 3,316), (Figure 5A). In comparison to conventional laying hens, these backyard establishments were sampled by fewer RC, with most of the sampling done by one RC, Romania, who sampled 2,162 backyard establishments (65% of the backyard establishments sampled among RC) (Figure 1). Other categories sampled in large numbers were chicken breeders, free‐range laying hens and fattening turkey (n = 2,267, n = 2,213, and n = 1,873, respectively) (Figure 5A).
Among poultry categories, the highest percentage of AI H5/H7 seropositive establishments was found in the waterfowl gamebird category (6.1% out of 164 waterfowl gamebird establishments sampled). The categories with the second and third largest percentages of seropositive establishments were geese breeders (2.9%, with the number of establishments sampled in this category n = 205), and duck breeders (2.2%, n = 268), respectively. When considering only gallinaceous species, the overall highest percentage of AI H5/H7 seropositive establishments were observed in the free‐range layer category (0.5%, n = 2,213). During this surveillance year, no turkey (fattening or breeder) establishments were found seropositive for H5 or H7 AI. No H5/H7 seropositive results were found either in the broiler, chicken breeders and ratites categories.
In terms of non‐H5/H7 AI seropositive establishments (n = 132), the categories with the largest number of seropositive establishments were the waterfowl gamebird (n = 61) and the fattening duck (n = 31) categories. Although no turkey establishments were found seropositive for H5 or H7 AI, 20 and 3 non H5/H7 seropositive establishments were reported for the turkey fattening and turkey breeder categories respectively (Figure 5B). Among the gallinaceous (not including gamebirds) categories, the highest number of non H5/H7 establishments were reported in conventional (n = 16) and free‐range laying hens (n = 16).
2.1.2.4. PCR and virological results
Samples from 44 H5/H7 seropositive establishments were tested for viral RNA using polymerase chain reaction (PCR). Of these, three were identified as H5 LPAI and one was identified as H7 LPAI. Countries reporting the H5 PCR positives were Denmark, Italy and Sweden. The H7 PCR‐positive establishment was detected in Croatia. Forty‐eight non‐H5/H7 seropositive establishments were followed up and tested for the presence of viral RNA using PCR. All these establishments tested negative.
Two of the H5 PCR‐positive samples and the H7‐positive sample were further tested using virus isolation and no virus was isolated. Overall, a total of six samples were tested for virus isolation, with no virus being isolated from any of these samples.
2.2. Wild birds
2.2.1. Number of birds sampled
In 2018, a total of 15,2529 wild birds were sampled by 26 MSs and Switzerland either by active or passive surveillance. Birds sampled by passive surveillance were reported by all 27 RC as ‘found dead’, ‘injured’ or ‘live with clinical signs’. Birds reported as ‘hunted with clinical signs’, ‘hunted without clinical signs’ and ‘live without clinical signs’ were considered as birds sampled via active surveillance (Tables 1 and 2) (this is consistent with the classification method followed in previous reports). From the total number of birds sampled, 9,145 (9,100 excluding Switzerland) were sampled by passive surveillance, showing a decrease in the number of birds sampled in 2018 in comparison with the previous two years. However, the number of birds sampled is still higher than the average number of birds sampled annually between 2011 and 2015 (Table 1).
Table 1.
Number of wild birds sampled by reporting country in 2018 by active and passive surveillance presented separately and combined as a total (light grey background), and number of wild birds sampled by passive surveillance from 2011 to 2017 with data from the first 5 years presented as an average
| Reporting Country | Passive surveillance | Active surveillance | Total | |||
|---|---|---|---|---|---|---|
| Average 2011–2015 | 2016 | 2017 | 2018 | 2018 | 2018 | |
| Austria | 110 | 201 | 897 | 109 | 3 | 112 |
| Belgium | 228 | 280 | 367 | 237 | 1,290 | 1,527 |
| Bulgaria | 18 | 9 | 47 | 58 | 2 | 60 |
| Croatia | 41 | 116 | 279 | 223 | 0 | 223 |
| Cyprus | 107 | 124 | 117 | 109 | 24 | 133 |
| Czech Republic | 74 | 89 | 330 | 94 | 0 | 94 |
| Denmark | 22 | 204 | 154 | 148 | 0 | 148 |
| Estonia | 9 | 5 | 38 | 16 | 213 | 229 |
| Finland | 99 | 208 | 316 | 195 | 0 | 195 |
| France | 89 | 190 | 766 | 113* | 0 | 113 |
| Germany | 1,334 | 5,861 | 8,533 | 1,711 | 4,056 | 5,767 |
| Greece | 52 | 16 | 90 | 13 | 0 | 13 |
| Hungary | 1,152 | 960 | 703 | 371 | 0 | 371 |
| Ireland | 30 | 25 | 137 | 142 | 0 | 142 |
| Italy | 1,146 | 1,899 | 2,019 | 2,109 | 0 | 2,109 |
| Latvia | 2 | 3 | 11 | 14 | 0 | 14 |
| Lithuania | 13 | 22 | 131 | 70 | 1 | 71 |
| Luxembourg | 12 | 2 | 61 | – | – | – |
| Malta | – | – | – | – | – | – |
| Netherlands | 209 | 536 | 509 | 663 | 0 | 663 |
| Poland | 30 | 85 | 209 | 36 | 0 | 36 |
| Portugal | 86 | 116 | 54 | 82 | 1 | 83 |
| Romania | 213 | 275 | 528 | 244 | 0 | 244 |
| Slovak Republic | 21 | 32 | 513 | 84 | 2 | 86 |
| Slovenia | 116 | 151 | 556 | 178 | 0 | 178 |
| Spain | 487 | 264 | 370 | 344 | 515 | 859 |
| Sweden | 234 | 354 | 452 | 455 | 0 | 455 |
| Switzerland** | 12 | 264 | 162 | 45 | 0 | 45 |
| United Kingdom | 526 | 537 | 1,194 | 1,282 | 0 | 1,282 |
| Total | 6,472 | 12,828 | 19,543 | 9,145 | 6,107 | 15,252 |
–: no information available.
165 birds tested with negative results in France under passive surveillance are missing from this table.
Not a MS.
Table 2.
Status of the birds sampled by passive (no background) and active (light grey background) surveillance by all RC and HPAI diagnostic results for 2018
| Bird status | No. of birds | PCR positive | VIa positive | PCR or VI positive | HPAI | |
|---|---|---|---|---|---|---|
| Passive | Found dead | 8,421 | 248 | 54 | 248 | 162 |
| Injured | 287 | 0 | 0 | 0 | 0 | |
| Live with clinical signs | 437 | 1 | 0 | 1 | 1 | |
| Active | Hunted with clinical signs | 29 | 0 | 0 | 0 | 0 |
| Hunted without clinical signs | 2,072 | 122 | 15 | 122 | 0 | |
| Live without clinical signs | 4,006 | 212 | 52 | 214 | 0 | |
| Total | 15,252 | 583 | 121 | 585 | 163 |
RC: reporting country; PCR: polymerase chain reaction; HPAI: highly pathogenic avian influenza.
Virus isolation.
Some RC (n = 10) also performed active surveillance, particularly, Belgium, Germany and Spain who sampled a higher number of birds by active than by passive surveillance (Tables 1 and 2). This report mostly summarises the sampling activities and results obtained by passive surveillance.
In Figure 6, the quarterly distribution of the number of birds sampled by passive surveillance, starting in January 2018, is shown by RC. Overall, the quarterly distribution of the birds sampled by passive surveillance in Europe was similar for all quarters. The highest number of samples were taken during the third quarter (October‐December); during this quarter, a total of 2,900 (31.7%) birds were reported as tested. The number of birds sampled during the first, second and fourth quarters were 2,271 (24.8%), 1,877 (20.5%) and 2,097 (22.9%) respectively. Figure 6 shows some variation among RC in terms of the sampling distribution throughout the year (percentage of samples taken at each quarter by each RC). For example, the largest percentage of samples for the United Kingdom, France10 and Switzerland were taken during the first quarter, for Spain and Italy during the third quarter, while Hungary, Romania, Portugal and Sweden sampled the most in the last quarter.
Figure 6.
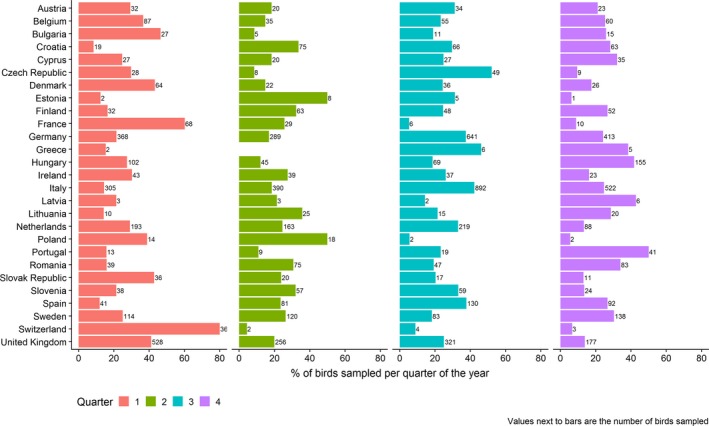
Quarterly percentage (bars) and total number (values) of wild birds sampled by passive surveillance by reporting country in 2018, with quarter 1 starting in January 2018
Via passive surveillance, a total of 255 wild bird species belonging to 24 orders were sampled. There were 28 sampled birds for which information on the species and order was missing, these birds are shown under the group name ‘Species unknown’ in Figure 7. The most sampled order was Anseriformes (n = 2,625), which accounted for 28.7% of the total number of birds sampled. The orders Passeriformes, Falconiformes and Charadriiformes were also sampled in high numbers (n > 1,000) (Figure 7). Active surveillance samples were mostly taken from birds of the order Anseriformes. A total of 5,210 samples from this order were tested by active surveillance. Data for active and passive surveillance are jointly shown in the appendix (Figure B.1, Appendix B).
Figure 7.
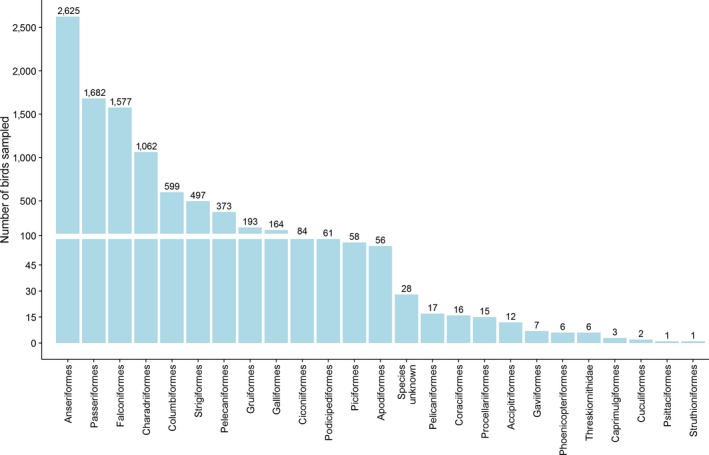
Total number of wild birds of the different orders, sampled by passive surveillance
Figure B.1.
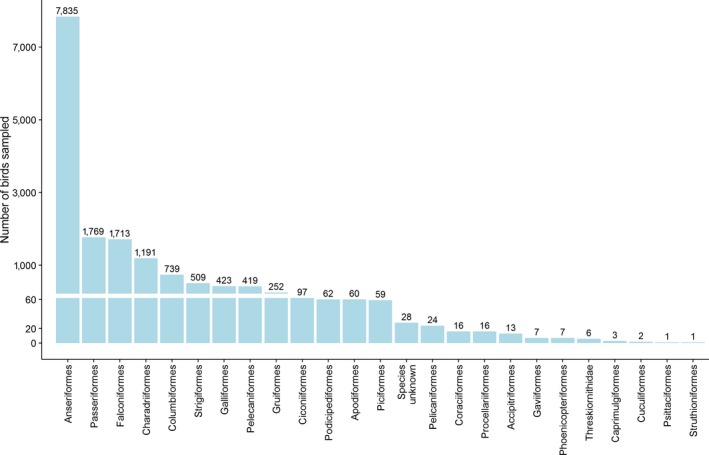
Total number of wild birds of the different orders sampled by passive and active surveillance by RC in 2018. A group including all birds for which data on species/order were not available was created
The majority of the species sampled by passive surveillance belonged to the orders Passeriformes (n = 57 species), Anseriformes (n = 40), Charadriiformes (n = 38), and Falconiformes (n = 33). In Figure 8, bird species with more than 50 birds sampled in 2018 are shown. Anas platyrhynchos (mallard) was the most sampled species, followed by Buteo buteo (common buzzard), Cygnus olor (mute swan) and Turdus merula (common blackbird). All English common names for the species shown in Figure 8 are listed in Appendix D. Forty‐one out of the 50 recommended target species by EFSA (EFSA, 2017) are included in the 255 species reported (see Appendix C).
Figure 8.
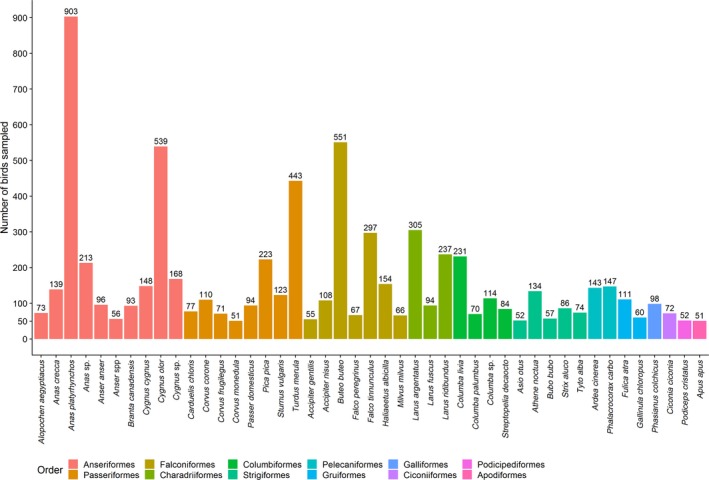
Total number of the most sampled wild bird species (n > 50 birds) reported by passive surveillance in 2018, with bird species presented colour coded by order. English common names for the species shown are provided in Appendix D
2.2.2. Avian influenza in wild birds
When analysing data from both active and passive surveillance, a total of 585 (3.8%) birds, out of the 15,252 sampled by RC, tested positive to AI. Of the 585 birds, 163 were infected with HPAI virus. Almost all the HPAI‐infected birds were found dead except for one bird which was found alive but showing clinical signs.
Out of the 585 positive birds, 422 birds were reported as LPAI. Most of these LPAI‐positive birds were found alive without clinical signs (n = 214) with 122 reported as hunted without clinical signs, and 86 reported as found dead.
2.2.2.1. High pathogenic avian influenza in wild birds
In the data submitted for 2018, HPAI virus was detected by passive surveillance only. A total of 163 infected birds were found across RC, with the percentage of infected birds detected by passive surveillance ranging from 0.2% in Germany to 28.4% in Denmark. The only HPAI subtype found was H5N6 (Table 3).
Table 3.
Countries where HPAI‐infected birds were detected and the number and percentage of the infected birds
| Country | No. of birds sampled | H5N6 HPAI | % Positive |
|---|---|---|---|
| Denmark | 148 | 42 | 28.4 |
| Finland | 195 | 3 | 1.5 |
| Germany | 1,711 | 3 | 0.2 |
| Ireland | 142 | 3 | 2.1 |
| Netherlands | 663 | 6 | 0.9 |
| Slovak Republic | 84 | 1 | 1.2 |
| Sweden | 455 | 15 | 3.3 |
| United Kingdom | 1,282 | 90 | 7.0 |
| All reporting countries | 9,145 | 163 | 1.8 |
HPAI: highly pathogenic avian influenza.
HPAI was found in eight RC, most of them located in northern Europe (Figure 9). In Figure 9, the geographical distribution of the sampling activities and H5N6 HPAI‐positive detections in RC in 2018 are shown aggregated at NUTS 2 level.
Figure 9.
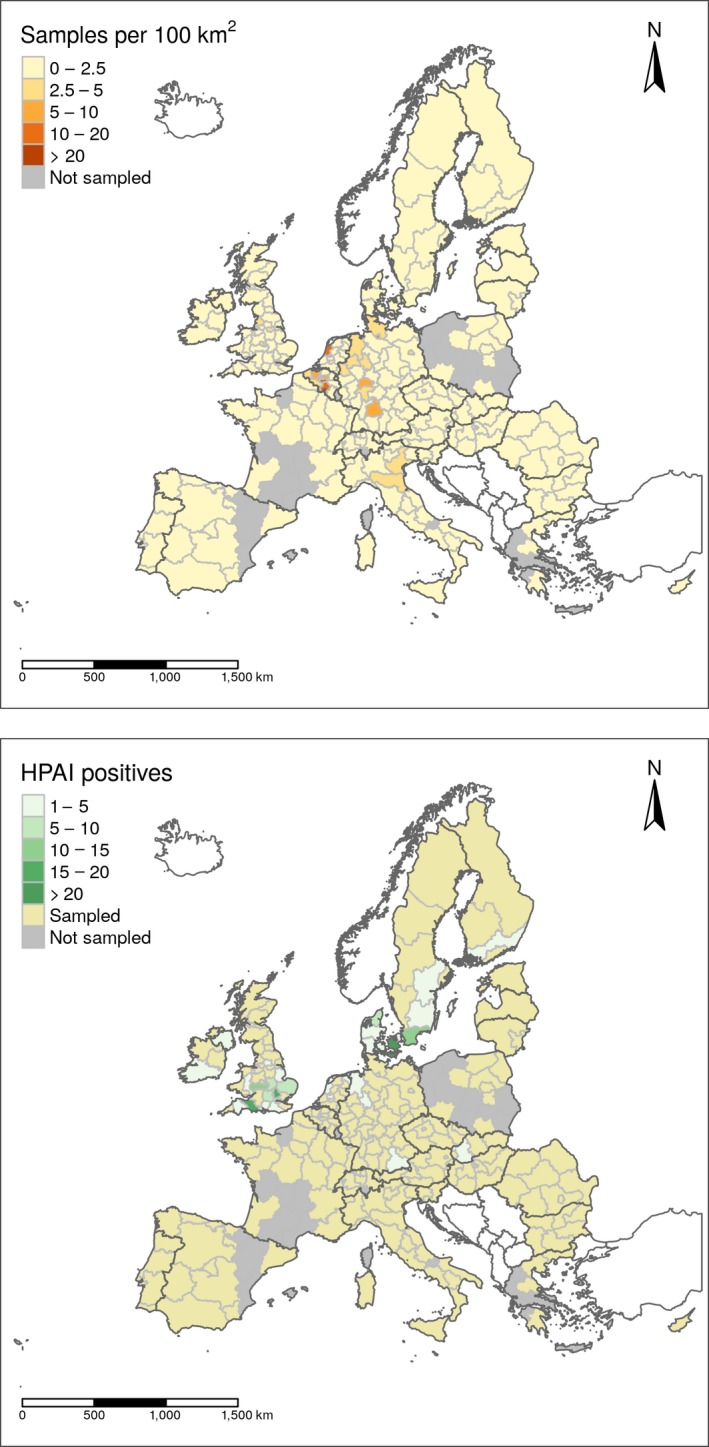
Sampling density, expressed as the number of birds sampled per area of 100 Km2 (upper map), and geographical distribution of HPAI (H5N6) positive wild birds (lower map). Countries which are not part of the EU are shown in white (excluding Switzerland)
Temporal patterns of HPAI detections
With the exception of the last 2 weeks of 2018, when fewer than 100 birds were sampled, the number of birds tested weekly among all RC ranged between 114 and 341 (Figure 10). Most HPAI‐positive birds were found within the first 17 weeks (4 months) of the year, with the percentage of HPAI positive bird detections being the highest in January (Figure 10). The positive birds found in this month were mainly from the order Anseriformes. Later in the year, particularly from week 5 to 20, Falconiformes species were detected positive with high frequency. For five positive birds detected in weeks 3 and 4, their order or species were unknown (Figure 10).
Figure 10.
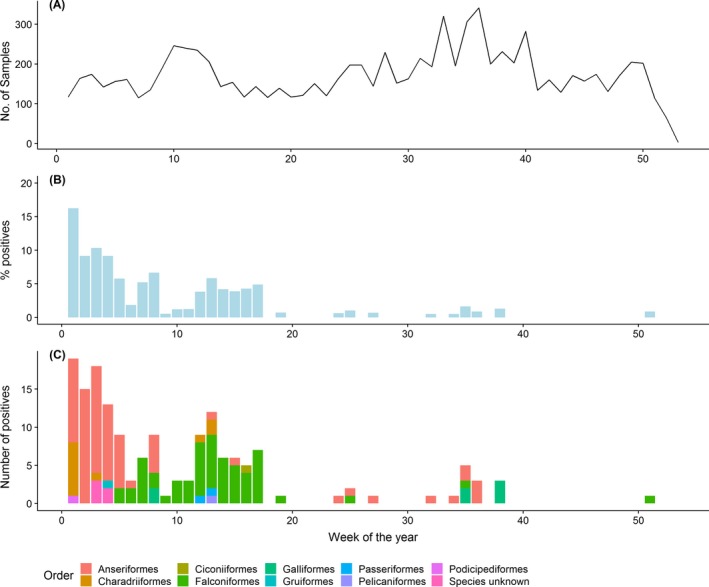
Temporal distribution of wild birds sampled via passive surveillance and reported by RC in 2018. (A) Weekly number of wild birds sampled by passive surveillance. (B) Percentage of positive HPAI infected wild birds. (C) Weekly number of HPAI detections colour coded by the taxonomic order of the infected birds
Wild bird species affected with HPAI virus
A total of 26 wild bird species, belonging to 9 different orders, were detected positive. The majority of HPAI infected species belonged to the orders Anseriformes (10 species) and Falconiformes (6 species) (Figure 11). The highest percentage (46%) of positive birds belonged to the order Charadriiformes, species Larus marinus (Figure 11); however, only 13 birds were sampled from this species. Out of the 13 birds sampled, 8 were sampled in the UK, 3 in the Netherlands, 1 in Ireland and 1 in Belgium. In the UK, out of the eight birds tested, six were reported as positive birds. These six HPAI birds were reported as sampled at the same time and similar location, with the other two negative samples from the UK being sampled at a different time and location.
Figure 11.
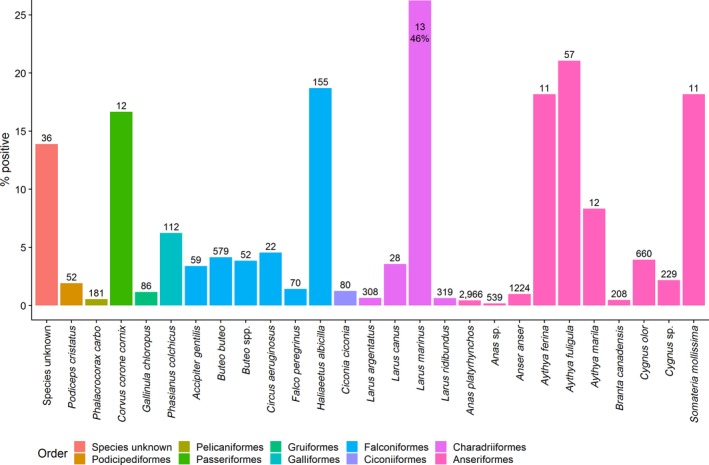
Percentage HPAI positive wild birds (bars) detected by passive surveillance and number of birds sampled (values) by species. Bars are colour coded to identify the order to which these species belong to. The group ‘Species unknown’ contains data on all HPAI birds for which information on the species/order was missing. English common names are provided in Appendix D
Most positive birds were listed as ‘target species’. The species found positive and not listed as target species were Corvus cornix (hooded crow), Phasianus colchicus (common pheasant), Circus aeruginosus (Western marsh harrier), Gallinula chloropus (common moorhen) and Chroicocephalus ridibundus (black‐headed gull) (shown as Larus ridibundus in Figure 11) (Figure 11).
HPAI birds identified in high‐risk areas and/or belonging to the list of high‐risk species
RC can provide information on whether the sampled birds were found in ‘high‐risk’ areas within their territories. Some RC identified and reported the sampling of birds within these high‐risk areas as part of their 2018 AI surveillance programme. A summary of the risk factors taken into account by RC (as described in their annual surveillance programmes) is presented in Appendix E. EFSA has provided an updated list of target wild bird species (EFSA, 2017), these are species which are most likely to be exposed to H5 HPAI virus and to suffer a fatal infection based on current knowledge (Appendix C).
The percentage of HPAI‐positive birds found in high‐risk areas, as well as the percentage of birds that belonged to the species listed as high‐risk species, varied among RC. For example, all birds reported from Denmark originated from high‐risk areas. The United Kingdom reported birds sampled from both high‐risk, and areas not under restriction. When looking at the species reported by this MS, 9.8% of birds of the species included in the EFSA list of target species were HPAI positive (total samples n = 759); while only 3.0% were positive among the birds sampled belonging to species not included in this list (total samples n = 523). Sweden reported all birds tested as located in areas under no restriction; 6.7% of the positive birds belonged to species included in the list of target species (total samples n = 224) while no positives were found in non‐target species (total samples n = 231). Data reported by the Netherlands and Germany were similar to those reported by Sweden, as none of the sampled birds were reported as originated from high‐risk areas, and a higher percentage of positives were found in target species compared to non‐target species.
In this section, the results from analysing, at a univariable level, the information provided by RC on high‐risk species, are presented. The odds ratio of HPAI detection as a function of the target species (species belonging to the target list versus species not belonging to the target list), was estimated, and the results shown in Table 4. In essence, the probability of testing HPAI positive in birds belonging to the list of target species was compared to the probability of testing positive when the birds tested did not belong to this list, without taking into account information on the status of the area where the birds were found. The results of the model presented are crude estimates of the effects of this variable at EU level for 2018. The results of this analysis showed that, testing birds that belong to the species classified as target species significantly (p < 0.001) increases the probability of detection of HPAI infected birds. This probability is on average 8.9 times higher for sampled target species compared to non‐target species (Table 4).
Table 4.
Number of sampled birds, HPAI‐infected wild birds, and crude odds ratio for HPAI detection
| Risk factor | Sampled birds | No. of positives (%) | Crude odds ratioa (95% CI)b |
|---|---|---|---|
| Target species | |||
| Yes | 4,082 | 137 (3.4) | 8.9 (5.6–15.1) |
| Noc,d | 4,632 | 18 (0.4) | 1 |
HPAI: highly pathogenic avian influenza.
Univariable estimate of the odds ratio for HPAI detection.
95% confidence intervals (CI).
Reference category for comparison.
Data on birds for which information on the species they belonged to was missing, or birds for which only genus was reported, were not included in the analysis.
2.2.2.2. Low pathogenic avian influenza in wild birds
A total of 422 birds sampled by either passive or active surveillance, were reported as positive for LPAI11 virus (or virus RNA) by 11 RC. Among these positives, 18 were subtyped as H5, two as H7. The majority of the LPAI viruses detected, were reported as ‘non H5/H7’, without further information on the virus subtype provided. Figure 12 summarises all the identified and reported LPAI H5 and H7, and non H5/H7 subtypes.
Figure 12.
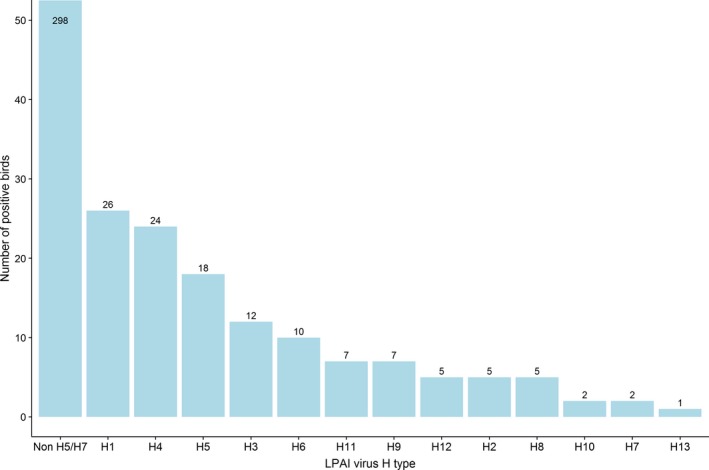
LPAI virus haemagglutinin (H) type identified in positive wild birds. Values are provided above the bars. To improve visibility, the Y‐axis was truncated at 50
Among countries reporting LPAI‐positive detections, the percentage of positives ranged from 0.08% to 2.38% for H5 subtypes, 0.05% to 0.15% for H7 subtypes and 0.33% to 18.45% for other subtypes (Table 5).
Table 5.
Total number of wild birds sampled by passive (no background colour) and active surveillance (light grey background) by RC with at least one positive LPAI detection, and the number and percentage of positive birds for H5, H7 and non‐H5/H7 LPAI virus subtypes
| Country | Surveillance | Samples | H5 | % H5 | H7 | % H7 | Other* LPAI | % Other LPAI |
|---|---|---|---|---|---|---|---|---|
| Austria | Passive | 109 | 1 | 0.92 | 0 | 0.00 | 6 | 5.50 |
| Belgium | Active | 1,290 | 0 | 0.00 | 0 | 0.00 | 238 | 18.45 |
| Denmark | Passive | 148 | 0 | 0.00 | 0 | 0.00 | 4 | 2.70 |
| Finland | Passive | 195 | 0 | 0.00 | 0 | 0.00 | 1 | 0.51 |
| France | Passive | 113 | 2 | 1.77 | 0 | 0.00 | 14 | 12.39 |
| Germany | Active | 4,056 | 8 | 0.20 | 0 | 0.00 | 90 | 2.22 |
| Germany | Passive | 1,711 | 0 | 0.00 | 0 | 0.00 | 14 | 0.82 |
| Italy | Passive | 2,109 | 0 | 0.00 | 1 | 0.05 | 7 | 0.33 |
| Netherlands | Passive | 663 | 3 | 0.45 | 1 | 0.15 | 12 | 1.81 |
| Slovak Republic | Passive | 84 | 2 | 2.38 | 0 | 0.00 | 1 | 1.19 |
| Slovenia | Passive | 178 | 1 | 0.56 | 0 | 0.00 | 0 | 0.00 |
| Spain | Passive | 344 | 0 | 0.00 | 0 | 0.00 | 2 | 0.58 |
| Switzerland | Passive | 45 | 0 | 0.00 | 0 | 0.00 | 2 | 4.44 |
| United Kingdom | Passive | 1,282 | 1 | 0.08 | 0 | 0.00 | 11 | 0.86 |
RC: reporting country; LPAI: low pathogenic avian influenza.
LPAI birds for which information on the H was missing were included in this category. The reporting of birds in this category was not done in a harmonized manner by all MSs. MSs such as Belgium reporting all individual birds involved in mass mortality events that tested positive using pool sampling may be overrepresented in this table.
Temporal patterns of LPAI detections
In Figure 13, the number of wild birds sampled (Figure 13A), and the percentage of those testing positive for LPAI (Figure 13B) are presented by week, and for passive and active surveillance separately (blue and red colour respectively). In this figure, the total number of positives for LPAI by week and wild bird taxonomic order are also shown (Figure 13C). A higher percentage of positive results were found from August onwards (later than week 30) for both types of surveillance; this is the period with the lowest frequency of detections of HPAI (Figure 10). The majority of positive LPAI detections (97%) were found by active surveillance (Table 5) and were observed in birds of the order Anseriformes (Figure 13C).
Figure 13.
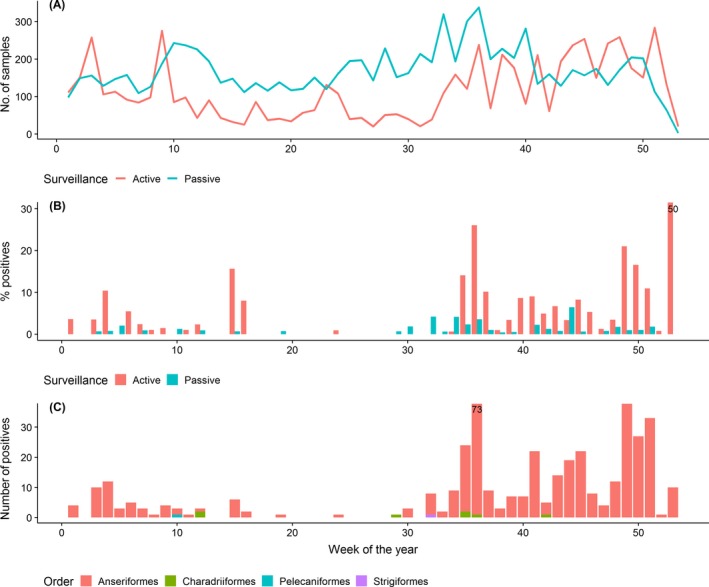
(A) Weekly number of wild birds sampled by both, passive and active surveillance, (B) weekly percentage of LPAI‐positive wild birds found, and (C) weekly number of LPAI‐positive wild birds by taxonomic order. A truncated Y‐axis was used in graphs B and C; for observations exciding the limits of the Y‐axis, values are provided as labels
3. Discussion and conclusions
3.1. Poultry
In 2018, the number of establishments sampled by all RC was slightly higher than the number of establishments sampled in 2017. The number of RC detecting H5/H7 seropositive establishments was similar in both surveillance years. In 2018, 11 RC detected H5/H7 seropositive establishments while 10 RC detected seropositive establishments in 2017 (APHA, 2018). Nine of these RC reported detections in both years. Due to differences in terms of the type of surveillance strategy implemented by the different RC, and/or differences in the AI epidemiological situation, it is not possible to compare the efficiency of the surveillance programmes between RC (Gonzales et al., 2010). Nonetheless, and despite the variation in sampling activities and results among RC, some inferences can be drawn about the overall detection percentages.
In 2018, as well as in the previous years since 2008, AI surveillance has consistently shown a higher detection percentage of H5 than H7 seropositive establishments. This trend in H5 and H7 detection percentages (e.g. in 2018 the detection percentages for H5 was 0.23% and for H7 was 0.01%) follows a similar trend to that observed in wild birds (e.g. in 2018 the detection percentage for H5 was 0.12% and for H7 was 0.01%), and not only in 2018, but also in previous years (APHA, 2017, 2018). This observed trend would indicate that there is an overall higher risk of introduction of H5 viruses compared to H7 viruses in poultry in Europe.
Of the different poultry categories surveyed, the highest H5/H7 seropositive percentages were observed in waterfowl game birds (6.1%), geese breeders (2.9%) and duck breeders (2.2%), in that order. Similarly, in 2017, these poultry categories (in the same order) had the highest detection percentages (APHA, 2018). These findings are in agreement with the results from an earlier statistical assessment based on data from the surveillance activities carried out between 2005 and 2007. In this assessment, the risk of AI circulation was compared among the different poultry categories. A higher risk of AI circulation was observed in waterfowl (ducks and geese) compared to gallinaceous (chickens and turkey) poultry (Gonzales et al., 2010). Similarly, when looking at the 2018 results for non‐H5/H7 AI subtypes, the largest number of seropositive results were reported for the waterfowl poultry category (n = 61), with the second largest number observed in fattening ducks (n = 31). In the literature, duck establishments have been also shown as the category group with the highest risk of introduction of AI (Bouwstra et al., 2017). Based on the surveillance data, it is not possible to infer whether the large detection percentages observed in aquatic poultry are a reflection of a higher risk of introduction of AI viruses in these poultry categories, or due to an increased between‐PE transmission (following introduction), or both. The high‐risk of introduction could be attributed to: (i) a higher susceptibility of domestic waterfowl to AI virus of wild bird origin compared to gallinaceous poultry (Mundt et al., 2009), (ii) the longer lifespan of breeder poultry and (iii) in the case of farmed gamebirds, the fact that they are frequently kept outdoors, increasing the chance of exposure to wild birds.
Among gallinaceous poultry categories, free‐range laying hens was the poultry category with the highest seropositive percentage (0.5%), although still much lower than the percentages observed in aquatic poultry. It has been shown that outdoor access of laying hens, which increases the risk of direct or indirect exposure to wild birds and the AI viruses they shed, may explain the high frequency of detection of AI antibodies in this poultry category (Bouwstra et al., 2017; CVI et al., 2017). No H5 or H7 detections occurred in 2018 in turkeys, although, the largest number of non H5/H7 seropositive establishments among the gallinaceous categories (not including gallinaceous game birds) were found in fattening turkeys (n = 20). The higher susceptibility of turkeys to AI virus infection compared to chickens (Tumpey et al., 2004) may explain the observed detection percentages in turkeys. The very low percentage of positive broiler establishments found in 2018 is consistent with findings of previous years (APHA, 2017, 2018) and the reported low risk of introduction found for this poultry category (Bouwstra et al., 2017).
To conclude, the results of the serological surveillance performed in 2018 are consistent with findings from previous years. These results indicate a high‐risk of introduction/circulation of LPAI in waterfowl gamebirds, geese and duck breeder establishments, and a very low risk for broiler chickens. These results also highlight the relative increased risk (although much lower than for aquatic poultry) of AI incursion in free‐range laying hens compared to conventional laying hen establishments.
3.2. Wild birds
In 2018, 26 MSs and Switzerland reported the results of their surveillance programmes. As part of this surveillance, all the RC performed passive surveillance, with some RC also performing active surveillance. HPAI was detected by passive surveillance only, with 1.8% of the dead birds sampled testing positive for H5N6 HPAI. This was the only virus subtype detected in 2018.
When the results of 2018 are compared to the results of the surveillance activities carried out in 2017, some differences are noticed. In 2017, HPAI was detected in 24 RC; detections were mostly made by passive surveillance, but some infected birds were detected by active surveillance. The percentage of positive birds of all birds sampled by passive surveillance was 9.7% (with the total number of birds sampled being 19,543), and there were three HPAI virus subtypes identified: H5N8, H5N5 and H5N6. The H5N8 subtype caused high mortalities in wild birds, and was the main virus detected between November 2016 and most of 2017. The increased mortality observed in these years, and the enhanced surveillance these epidemics generated, are likely to be the reasons of the higher number of samples tested compared to 2018. Between November 2016 and March 2017, weekly sampling numbers were approximately 10 times higher than the median number of samples taken weekly during the other months in those years (APHA, 2017, 2018). In contrast, throughout 2018, the number of wild birds sampled weekly was constant, with no apparent increase in sampling due to the circulation of the H5N6 HPAI virus. The first detection of the H5N6 subtype in wild birds took place in December 2017, with a large number of samples testing positive in January 2018; this month was subsequently confirmed as the peak of the epizootic (Figure 10). Despite the large percentage of positive samples reported in this month, the weekly number of samples taken did not vary from other months.
Passive surveillance programmes in wild birds varied among RC, with differences observed in the number of birds tested, temporal distribution of these samples, percentage of the birds tested in high‐risk areas, and/or percentage of birds sampled belonging to species included in the EFSA target list of high‐risk species (among others). Hence, inferences about the efficacy of passive surveillance in detecting HPAI in wild birds cannot be drawn at country level. Nonetheless, based on the surveillance results for 2018, and considering current knowledge of the disease, some general inferences can be made at a European level:
In 2018, all HPAI viruses were detected via passive surveillance, despite some RC implementing both active and passive surveillance strategies. Although, most reporting countries carried only passive surveillance, this finding would suggest a larger efficacy of the passive compared to the active surveillance type in detecting HPAI viruses (even when the virus subtype does not cause high mortality).
Based on the crude odds ratios presented in Table 4, enhanced sampling of the birds belonging to the species considered as high‐risk species, would improve the probability of detection of HPAI viruses in wild birds, and thereby the efficacy of passive surveillance. In this report, the probability of detection of HPAI viruses in birds belonging to the list of target species was compared to that of birds belonging to species not present in this list. This probability was 8.9 times higher in the former group compared to the latter. It is important to note that this odds ratio was not adjusted for reporting country and for whether these birds were sampled in high risk areas or not. Although information on area status were reported by all RC, the two plausible terms used for the reporting of this information (high risk area versus areas under no restriction) were not mutually exclusive. The term ‘area not under restriction’ does not necessarily equate to ‘low risk area’. As a result, analysing these data could therefore lead to misinterpretation of the data reported. Providing a reporting system that allows differentiation between high risk and low risk areas in terms of HPAI, would be necessary to accurately analyse these data. If information on the area status were to be reported as high risk versus not high risk areas by all RC, adjusted odd ratios could be estimated for all three risk factors, reporting country, target species and area status. Some non‐target species (not identified as high‐risk species) that were found positive (%) in 2018 were: Corvus corone cornix (hooded crow) (16.7%), Phasianus colchicus (common pheasant) (7.1%), Circus aeruginosus (Western marsh harrier) (5.6%), Gallinula chloropus (common moorhen) (1.7%) and Chroicocephalus ridibundus (black‐headed gull) (0.8%). It is not known whether infections in these species were due to random events (spill over), or a reflection of a high susceptibility to H5N6 HPAI of these species. This finding therefore agrees and justifies the current policy of revising, on a regular basis, the list of species that are considered as high‐risk in Europe.
Based on the results for 2018, and those reported for 2016 and 2017 (APHA, 2017, 2018), the period with the highest rate of HPAI detections, and possibly the highest risk for poultry, was between November and March. However, HPAI‐infected birds were found (in very low numbers), up to the summer months (this and previous reports (APHA, 2017, 2018)). During this late period of detection (following the peak of detections during the first months), a large number of birds belonging to the Falconiformes order were found HPAI positive. These species could therefore become important sentinels for the detection of HPAI circulation during the months subsequent to the virus introduction (Krone et al., 2018; van den Brand et al., 2015).
In terms of LPAI, the 2018 surveillance data shows that the percentage distribution of the different subtypes (H5, H7 and non‐H5/H7 LPAI subtypes) was similar to previous years and similar to the distribution observed in poultry (discussed in surveillance for poultry). The highest frequency of LPAI positive results were found from September (week 35 onwards), which appears to show a different temporal behaviour to that observed for HPAI. However, we cannot exclude that the reason for the different temporal behaviour observed could have been circumstantial (e.g. following positive results in the M‐PCR, and once HPAI is confirmed, no further tests are performed to assess presence of other LPAI viruses, confounding therefore observations on the temporal trend of LPAI). Finally, it should be noted that most of the non‐H5/H7‐positive findings were reported as ‘Not H5 or H7’ or no information on the N subtype was provided. Genetic information about the LPAI viruses is of importance, as LPAI viruses contribute to the appearance of new HPAI virus reassortants (Beerens et al., 2017).
To conclude, a lower percentage of infected birds were detected in 2018 compared to 2016 and 2017, which might be the result of a lower introduction/transmission, and/or a lower mortality rate of the H5N6 HPAI virus. In 2018 and similarly to 2017, most cases were detected during the first months of the year. Despite the apparent lower mortality rate and/or lower transmission rate among infected wild birds (as compared to the 2016–2017 H5N8 HPAI), passive surveillance still allowed the detection of the H5N6 virus. Initial analysis of the data reported suggests that targeting birds belonging to the list of high‐risk species significantly increases the probability of detection of HPAI viruses. The large crude odds ratio observed should be further investigated to fully assess the effect of other plausible risk factors such as high risk versus low risk areas.
4. Methods
4.1. Framework for reporting
Directive 2005/94/EC on Community measures to control avian influenza established in its Article 4 the legal basis for the obligatory conduct of surveillance programmes in poultry and wild bird populations. Both surveillance programmes must be carried out following harmonised guidelines which were laid down in 2010/367/EU.
Surveillance programmes of the MSs are evaluated and approved for co‐financing by Commission's procedures that are detailed on the Commission's website: http://ec.europa.eu/dgs/health_food-safety/funding/cff/animal_health/vet_progs_en.htm
Diagnostic procedures for testing the samples collected within the surveillance programmes are outlined in Diagnostic Manual for avian influenza as set out in Decision 2006/437/EC12.
Previous Annual Reports and more information on surveillance for avian influenza in poultry and wild birds can be found at: http://ec.europa.eu/food/animal/diseases/controlmeasures/avian/eu_resp_surveillance_en.htm
4.2. Survey design
4.2.1. Poultry
The epidemiological unit for reporting surveillance in poultry is the holding, which is defined in Council Directive 2009/158/EC13 as: ‘a facility used for the rearing or keeping of breeding or productive poultry. For the purposes of avian influenza surveillance, this may include facilities that only contain poultry during certain months of the year (i.e. poultry do not need to be present all year round)’. In this report, the word ‘holding’ was replaced by ‘establishment’14 to be aligned with the Regulation (EU) 2016/429 (Animal Health Law).
Detailed guidelines for the design of surveillance based on representative sampling or risk‐based surveillance as well as the identification of the target population (poultry species and production categories) and guidelines for calculation of sample size at holding and bird level are described in Annex I of the Commission Decision 2010/367/EU.
4.2.2. Wild birds
The epidemiological unit for surveillance in wild birds is a bird. Procedures for surveillance design are outlined in Annex II of the Commission Decision 2010/367/EU.
4.3. Sampling procedures and laboratory testing
Sampling and laboratory testing procedures for both poultry and wild birds are described in Annex I and II, respectively, of Commission Decision 2010/367/EU. In this Commission Decision, the procedures to carry out epidemiological investigations following positive detections are also outlined.
Following the events of previous years (2014–2017), when HPAI virus with other N subtype than N1 have been detected in poultry and wild birds, it was expected, particularly in the case of wild bird samples, that MS would proceed to identify the specific N subtype, either by using national reference laboratories or submitting the samples to the EU reference laboratory for its identification.
4.4. Data and data processing
Data collation and validation were carried out using the statistical software STATA (StataCorp, 2017). The statistical software R (R Core Team, 2017) was used for the exploratory and statistical analysis of the data. Eurostat shape files (layer 2016) were used to create the maps.
In some RC, establishments were sampled several times throughout the year, this was the case for establishments containing one or different poultry categories. For the purpose of this report, each sampling exercise taking place on a specific date, and/or targeting a different poultry category was considered as an independent event and counted as an establishment sampled. As a result, an overestimation of the total number of establishments sampled could occur for some RC, with this number being higher than the total number of establishments of a specific poultry category in a specific RC. Therefore, the numbers reported in this manuscript as establishments sampled should be treated with caution and strictly read as the number of sampling events taking place in a RC for each of the reported categories.
For the wild bird data analysis, data submitted by RC under the variable name ‘localization date’ were used as sampling date. Additionally, for the analysis of this report the updated EFSA list of target species (EFSA, 2017), instead of the target list provided in the Commission Decision 2010/367/EU, was used. Pooled testing takes places in some MSs when more than one bird from the same species are collected at the same time and location. For data analysis, the variable ‘bird identifier’ was used to aggregate the data at bird level.
Maps plotting the geographical distribution of the sampling events and the location of positive results were aggregated at NUTS 2 level for both poultry and wild birds. To summarise sampling activities, the intensity of sampling, calculated as the number of samples taken within a NUTS 2 region per 100 km2, was displayed using Geographical Information Systems (GIS). As part of the data validation of the geographical distribution of the reported samples, and for samples with geo‐coordinates referring to countries other than the country reporting the data, random geo‐coordinates were created assigning the observations to the closest (with a cut off of less than 100 km) NUTS 2 region of the country reporting the observation.
The results presented in this report are based on the data reported by RC under Commission Decision 2010/367/EU (European Commission, 2010). As a result, data may differ, particularly with regard to HPAI detections in wild birds, from data reported to the Animal Disease Notification System (ADNS) or World Animal Health Information Database (WAHID).
Glossary and Abbreviations
- ADNS
Animal Disease Notification System
- AI
avian influenza
- AIV
avian influenza viruses
- GIS
Geographical Information Systems
- H
haemagglutinin
- HPAI
highly pathogenic avian influenza
- LPAI
low pathogenic avian influenza
- MSs
Member State(s) of the EU
- N
neuraminidase
- NUTS
Nomenclature of Units for Territorial Statistics
- PCR
polymerase chain reaction
- PE
poultry establishment
- RC
Reporting country. these countries are MSs and Switzerland
- VI
virus isolation
- WAHID
World Animal Health Identification Database
- Poultry holding/Poultry establishment
Defined in Council Directive 2009/158/EC as a facility used for the rearing or keeping of breeding or productive poultry. For the purposes of avian influenza surveillance, this may include facilities that only contain poultry during certain months of the year (i.e. poultry do not need to be present all year round). In this report we used poultry establishment instead of poultry holding
- Target species
Wild birds that have been shown to be at a higher risk of becoming infected with, and transmitting the HPAI H5N1 virus, as referenced in Commission Decision 2010/367/EU and the EFSA updated list (EFSA AHAW Panel et al., 2017)
Appendix A – Results of poultry surveillance activities reported during the first or second half of the year 2018
A.1. Total number of establishments reported by sampling period
Most of the AI surveillance in poultry took place in the period going from July to December, with some countries only reporting samples taken during this period. A total of 10,854 establishments were reported as sampled in this period, while 7,742 were reported as sampled in the reporting period going from January to June (Figure A.1).
A.2. AI seropositive establishments detected by reporting period
Overall a higher percentage of positive establishments were reported during the first half of 2018 than the second half. During the first half of 2018 a total of 121 (1.6%) out of the 7,743 establishments sampled were reported as seropositive for AI, with 15 out of these 121 establishments being seropositive for H5 or H7 LPAI subtypes. During the second half of the year 117 (1.1%) establishments out of 10,854 establishments were reported as seropositive to AI among which 30 were positive for H5 or H7 antibodies.
Among RC reporting data for both sampling periods, six RC reported a higher percentage of seropositive establishments (for both H5/H7 and all other AI) during the first semester of 2018 (period January‐June), and four RC during the second semester of 2018 (Figure A.2).
Figure A.2.
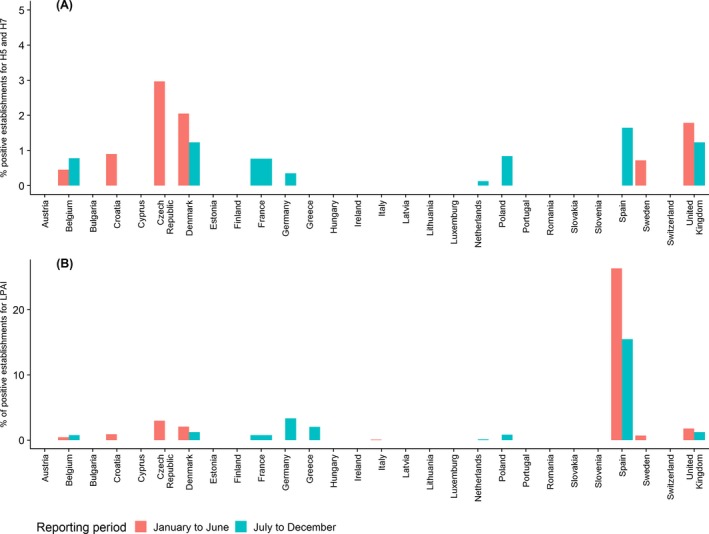
Percentage of serology positive establishments for (A) antibodies against H5 and H7 AI or (B) antibodies against avian influenza A (all HA subtypes, including H5 and H7) virus found in RC
At poultry category level, and similarly to what was observed at country level, more poultry categories had a higher percentage of positive establishments during the first half of the year than during the second. This was particularly the case for free range laying hens and all the poultry categories involving ducks and geese.
Figure A.3.
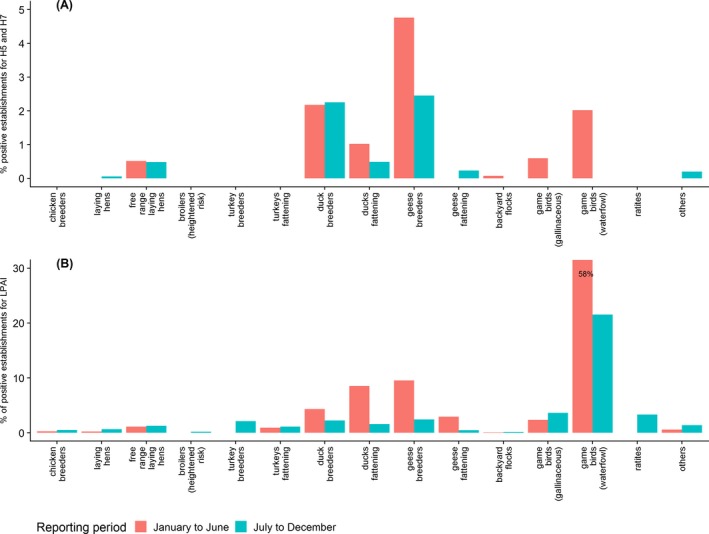
Percentage of serology positive establishments for antibodies against (A) H5 and H7 LPAI or (B) antibodies against avian influenza A (all HA subtypes) virus found in the different poultry categories
Appendix B – Total number of wild birds of the different orders sampled by passive and active surveillance
1.
Appendix C – List of target wild bird species published in December 2017 as part of the EFSA‐ECDC‐EURL scientific report
1.
| Family | Subfamily, tribe, or genus | Species | % positive (no. positive/no. tested)a |
|---|---|---|---|
| Ducks, geese, and swans (Anatidae) | Diving ducks (Aythyini) | Tufted duck (Aythya fuligula) | 33.4% (338/1011) |
| Greater scaup (Aythya marila) | 12.7% (9/71) | ||
| Common pochard (Aythya ferina) | 11.4% (26/228) | ||
| Red‐crested pochard (Netta rufina) | 0.9% (1/112) | ||
| Dabbling ducks (Anatinae) | Northern pintail (Anas acuta) | 5.4% (3/56) | |
| Eurasian wigeon (Anas penelope) | 3.7% (8/219) | ||
| Gadwall (Anas strepera) | 1.7% (3/179) | ||
| Mallard (Anas platyrhynchos) | 0.5% (96/20672) | ||
| Eurasian teal (Anas crecca) | 0.4% (5/1145) | ||
| Sea ducks (Mergini) | Goosander (Mergus merganser) | 6.4% (7/109) | |
| Common goldeneye (Bucephala clangula) | 5.7% (3/53) | ||
| Smew (Mergus albellus) | 5.0% (1/20) | ||
| Common eider (Somateria mollissima) | 1.3% (3/228) | ||
| Shelducks and sheldgeese (Tadorninae) | Common shelduck (Tadorna tadorna) | 0.5% (1/218) | |
| Egyptian goose (Alopochen aegyptiacus) | 0.4% (1/234) | ||
| True geese (Anser, Branta, Chen) | Lesser white‐fronted goose (Anser erythropus) | 13% (3/23) | |
| Greylag goose (Anser anser) | 3.5% (68/1968) | ||
| Taiga bean Goose (Anser fabalis) | 2.8% (4/143) | ||
| Canada goose (Branta canadensis) | 1.8% (19/1061) | ||
| Pink‐footed goose (Anser brachyrhynchus) | 1.3% (1/75) | ||
| Brant goose (Branta bernicla) | 1.2% (1/84) | ||
| Greater white‐fronted goose (Anser albifrons) | 0.6% (2/350) | ||
| Swans (Cygnus) | Black swan (Cygnus atratus) | 9.5% (6/63) | |
| Whooper swan (Cygnus cygnus) | 9.3% (169/1818) | ||
| Mute swan (Cygnus olor) | 7.6% (931/12268) | ||
| Grebes (Podicipedidae) | Black‐necked grebe (Podiceps nigricollis) | 79.9% (246/308) | |
| Great crested grebe (Podiceps cristatus) | 8.5% (50/588) | ||
| Little grebe (Tachybaptus ruficollis) | 7.8% (6/77) | ||
| Storks (Ciconiidae) | White stork (Ciconia ciconia) | 0.5% (5/911) | |
| Herons (Ardeidae) | Eurasian bittern (Botaurus stellaris) | 2.9% (1/35) | |
| Little egret (Egretta garzetta) | 2.9% (2/69) | ||
| Great white egret (Egretta alba) | 0.9% (4/441) | ||
| Grey heron (Ardea cinerea) | 0.8% (40/5093) | ||
| Pelicans (Pelecanidae) | Dalmatian pelican (Pelecanus crispus) | 27.5% (11/40) | |
| Great white pelican (Pelecanus onocrotalus) | 9.5% (2/21) | ||
| Cormorants and shags (Phalacrocoracidae) | Great cormorant (Phalacrocorax carbo) | 0.6% (12/2090) | |
| Raptors (Accipitridae, Falconidae, Strigidae) | White‐tailed eagle (Haliaeetus albicilla) | 6.6% (28/426) | |
| Rough‐legged buzzard (Buteo lagopus) | 3.7% (1/27) | ||
| Common buzzard (Buteo buteo) | 1.1% (72/6307) | ||
| Peregrine falcon (Falco peregrinus) | 3.4% (10/297) | ||
| Northern goshawk (Accipiter gentilis) | 1.3% (8/616) | ||
| Eurasian eagle‐owl (Bubo bubo) | 0.9% (3/340) | ||
| Coots, crakes, and rails (Rallidae) | Western swamphen (Porphyrio porphyrio) | 6.7% (1/15) | |
| Sandpipers (Scolopacidae) b | Green sandpiper (Tringa ochropus) | 33.3% (1/3) | |
| Gulls, terns, and allies (Laridae) | Great black‐backed gull (Larus marinus) | 13.8% (22/159) | |
| European herring gull (Larus argentatus)( c ) | 3.1% (66/2135) | ||
| Mew gull (Larus canus) | 0.8 (4/481) | ||
| Black‐headed gull (Chroicocephalus ridibundus) | 0.7% (30/4075) | ||
| Corvids (Corvidae) | Eurasian magpie (Pica pica) | 0.6% (7/1232) | |
| Thrushes (Turdidae) | Fieldfare (Turdus pilaris) | 0.5% (1/192) |
Passive surveillance data from 2005 to 2017 were used for the development of the target list.
Another wader, Numenius species was not included in this list because it was not identified to species. However, in the EU, the two most common Numenius species are the Eurasian curlew (N. arquata) and the whimbrel (N. phaeopus).
This does not include the Caspian gull (Larus cachinnans) or the yellow‐legged gull (Larus michahellis), which are considered separate species.
Appendix D – English common names for wild bird species shown in Figures 8 and 11
1.
| Latin name | English common name |
|---|---|
| Accipiter gentilis | Northern goshawk |
| Accipiter nisus | Eurasian sparrowhawk |
| Alopochen aegyptiacus | Egyptian goose |
| Anas crecca | Eurasian teal |
| Anas platyrhynchos | Mallard |
| Anser anser | Greylag goose |
| Apus apus | Common swift |
| Ardea cinerea | Grey heron |
| Asio otus | Long‐eared owl |
| Athene noctua | Little owl |
| Aythya ferina | Common pochard |
| Aythya fuligula | Tufted duck |
| Aythya marila | Greater scaup |
| Branta canadensis | Canada goose |
| Bubo bubo | Eurasian eagle‐owl |
| Buteo buteo | Common buzzard |
| Carduelis chloris | European greenfinch |
| Ciconia ciconia | White stork |
| Circus aeruginosus | Western Marsh harrier |
| Columba livia | Rock dove |
| Columba palumbus | Common wood pigeon |
| Corvus cornix | Hooded crow |
| Corvus corone | Carrion crow |
| Corvus frugilegus | Rook |
| Corvus monedula | Eurasian jackdaw |
| Cygnus cygnus | Whooper swan |
| Cygnus olor | Mute swan |
| Falco peregrinus | Peregrine falcon |
| Falco tinnunculus | Common kestrel |
| Fulica atra | Eurasian coot |
| Gallinula chloropus | Common moorhen |
| Haliaeetus albicilla | White‐tailed eagle |
| Larus argentatus | European herring gull |
| Larus canus | Mew gull |
| Larus fuscus | Lesser black‐backed gull |
| Larus marinus | Great black‐backed gull |
| Larus ridibundus | Black‐headed gull |
| Milvus milvus | Red kite |
| Passer domesticus | House sparrow |
| Phalacrocorax carbo | Great cormorant |
| Phasianus colchicus | Common pheasant |
| Pica pica | Eurasian magpie |
| Podiceps cristatus | Great crested grebe |
| Somateria mollissima | Common eider |
| Streptopelia decaocto | Eurasian collared dove |
| Strix aluco | Tawny owl |
| Sturnus vulgaris | Common starling |
| Turdus merula | Common blackbird |
| Tyto alba | Western barn owl |
Appendix E – Summary of passive surveillance sampling strategies, as described in MSs 2018 wild bird survey plans
1.
| Surveillance design | ||||||||||||||
|---|---|---|---|---|---|---|---|---|---|---|---|---|---|---|
| Member State | Target number of birds to sample | EU Target Species | Proximity to wetlands | Proximity of poultry holdings | Density of poultry holdings | Density of wild bird populations | Flight routes and migratory pathways | Where HPAI found previously | Epi linked areas | Mortality (increased, mass, abnormal) | Morbidity | Searching for birds | Collaboration with hunting or ornithological interest groups | General public |
| AT | 1,000 | ✓ | ✓ | ✓ | ✓ | ✓ | ||||||||
| BE | 400 | ✓ | ✓ | ✓ | ✓ | ✓ | ✓ | |||||||
| BG | 190 | ✓ | ✓ | ✓ | ✓ | ✓ | ✓ | 1 | ✓ | |||||
| HR | 110 | ✓ | ✓ | ✓ | ✓ | ✓ | ✓ | ✓ | ✓ | ✓ | ||||
| CY | 180 | 2 | ✓ | ✓ | ✓ | ✓ | ||||||||
| CZ | 200 | ✓ | ✓ | ✓ | ✓ | ✓ | ✓ | |||||||
| DE | 1,570 | ✓ | ✓ | ✓ | ✓ | ✓ | ||||||||
| EL | 250 | ✓ | ✓ | ✓ | ✓ | ✓ | ✓ | ✓ | 1 | ✓ | ✓ | |||
| ES | 400 | ✓ | ✓ | ✓ | ✓ | ✓ | ✓ | ✓ | ✓ | |||||
| FI | 150 | ✓ | ✓ | ✓ | ✓ | ✓ | ||||||||
| FR | 903 | ✓ | ✓ | ✓ | ✓ | ✓ | ✓ | ✓ | ✓ | |||||
| HU | 470 | ✓ | ✓ | ✓ | ✓ | ✓ | ✓ | ✓ | ||||||
| IE | 500 | ✓ | ✓ | ✓ | ✓ | ✓ | ✓ | ✓ | ||||||
| IT | 1,500 | ✓ | ✓ | ✓ | ✓ | ✓ | ✓ | |||||||
| LT | 200 | ✓ | ✓ | ✓ | ✓ | ✓ | ||||||||
| LU | 150 | ✓ | ||||||||||||
| LV | 20 | ✓ | ✓ | ✓ | ✓ | |||||||||
| NL | 300 | ✓ | ✓ | ✓ | ✓ | ✓ | ✓ | ✓ | ✓ | |||||
| PL | 50 | ✓ | ✓ | ✓ | ✓ | ✓ | ✓ | ✓ | ||||||
| PT | 300 | ✓ | ✓ | ✓ | ✓ | ✓ | ✓ | ✓ | ||||||
| RO | 420 | ✓ | ✓ | ✓ | ✓ | ✓ | ✓ | 1 | ✓ | |||||
| SE | 500 | ✓ | ✓ | ✓ | ✓ | 1 | ✓ | ✓ | ||||||
| SK | 800 | ✓ | ✓ | ✓ | ✓ | ✓ | ✓ | ✓ | ✓ | |||||
| SI | 200 | ✓ | ✓ | ✓ | ✓ | ✓ | ✓ | ✓ | ||||||
| UK | 650 | ✓ | ✓ | ✓ | ✓ | ✓ | ||||||||
Searching for dead/moribund birds occurs if required based on the epidemiological situation.
It must be noted that the presence in Cyprus of birds listed in part 2 of Annex II of Commission Decision 2010/367/EU depends mainly on the weather conditions in the island during the winter.
Suggested citation: EFSA (European Food Safety Authority) , Brouwer A, Gonzales J, Huneau A, Mulatti P, Kuiken T, Staubach C, Stegeman A, Antoniou S‐E, Baldinelli F, Van der Stede Y and Aznar I, 2019. Annual Report on surveillance for avian influenza in poultry and wild birds in Member States of the European Union in 2018. EFSA Journal 2019:17(12)5945, 38 pp. 10.2903/j.efsa.2019.5945
Requestor: European Commission
Question number: EFSA‐Q‐2019‐00039
Acknowledgements: In addition to the listed authors, EFSA wishes to thank all MS representatives and the representative for Switzerland, members of the AHAW panel, Calogero Terregino (EURL for Avian Influenza and Newcastle Disease) and Ian Brown (APHA) for their support to this scientific output.
Approved: 19 November 2019
Notes
Regulation (EU) 2016/429 of the European Parliament and of the Council of 9 March 2016 on transmissible animal diseases and amending and repealing certain acts in the area of animal health (‘Animal Health Law’). OJ L 84, 31.3.2016, p. 1–208.
Data from Portugal were reported at an establishment level, and not at ‘sampling event’ level.
Commission Decision 2010/367/EU of 25 June 2010 on the implementation by Member States of surveillance programmes for avian influenza in poultry and wild birds. OJ L 166, 1.7.2010, p. 122.
Council Directive 2005/94/EC of 20 December 2005 on Community measures for the control of avian influenza and repealing Directive 92/40/EEC. OJ L 10, 14.1.2006, p. 16.
It should be noted that for the surveillance activities carried out in 2018, the objective was not limited to the detection of HPAI H5N1, but to any HPAI virus subtype.
Commission Implementing Decision (EU) 2018/1136 of 10 August of 2018 on risk mitigating and reinforced biosecurity measures and early detection systems in relation to the risks posed by wild birds for the transmission of highly pathogenic avian influenza viruses to poultry.
Malta did not submit data to the EC for surveillance activities in poultry carried out in 2018. Data on the surveillance activities on poultry carried out in the first half of the year by France were not available to EFSA due to technical difficulties, nonetheless, most of the poultry surveillance activity took place during the 2nd semester, with few results missing in this report. Validation of the results for Luxembourg could not be done prior to the production of this report, therefore amendments done in June 2019 were not included. Six fattening geese establishments sampled by Sweden are missing in this report.
This might result in an underestimation of the total number of establishments for some reporting countries not sampling all regions.
Four wild birds sampled in the fourth quarter in Poland with negative results could not be incorporated to this report due to late validation; surveillance data on 29 wild birds sampled by Luxembourg were not included as they could not be validated prior to the production of the tables and figures in this report; Malta did not submit any data for the 2018 wild bird surveillance.
The sampling of the 165 birds missing in Table 1 took place mostly in the third quarter.
Birds reported positive for subtypes other than H5 and/or H7 for which no information on the pathogenicity was available were considered as LPAI.
Commission Decision 2006/437/EC of 4 August 2006 approving a Diagnostic Manual for avian influenza as provided for in Council Directive 2005/94/EC. OJ L 237, 31.8.2006, p.1–27.
Council Directive 2009/158/EC of 30 November 2009 on animal health conditions governing intra‐Community trade in, and imports from third countries of, poultry and hatching eggs. OJ L 343, 22.12.2009, p. 74–113.
According to Regulation (EU) 2016/429 ‘establishment’ means any premises, structure or, in the case of open‐air farming, any environment or place, where animals or germinal products are kept, on a temporary or permanent basis, except for: (a) households where pet animals are kept; (b) veterinary practices or clinics. (Regulation (EU) 2016/429 of the European Parliament and of the Council of 9 March 2016 on transmissible animal diseases and amending and repealing certain acts in the area of animal health (‘Animal Health Law’). OJ L 84, 31.3.2016, p. 1–208.
References
- APHA , 2017. Annual Report on surveillance for avian influenza in poultry and wild birds in Member States of the European Union in 2016. Available online: https://ec.europa.eu/food/sites/food/files/animals/docs/ad_control-measures_ai_surv-rslt_pltry-wld-brds_2016.pdf [DOI] [PMC free article] [PubMed]
- APHA , 2018. Annual Report on surveillance for avian influenza in poultry and wild birds in Member States of the European Union in 2017. Available online: https://ec.europa.eu/food/sites/food/files/animals/docs/ad_control-measures_ai_surv-rslt_pltry-wld-brds_2017.pdf [DOI] [PMC free article] [PubMed]
- Beerens N, Heutink R, Bergervoet S, Harders F, Bossers A and Koch G, 2017. Multiple reassorted viruses as cause of highly pathogenic avian influenza A(H5N8) Virus Epidemic, the Netherlands, 2016. Emerging Infectious Disease Journal, 23. [DOI] [PMC free article] [PubMed] [Google Scholar]
- Bouwstra R, Gonzales JL, de Wit S, Stahl J, Fouchier RAM and Elbers ARW, 2017. Risk for low pathogenicity avian influenza virus on poultry farms, the Netherlands, 2007–2013. Emerging Infectious Diseases, 23, 1510–1516. [DOI] [PMC free article] [PubMed] [Google Scholar]
- CVI , Gonzales JL, Elbers ARW and Beerens N, 2017. Risk factors of primary introduction of highly pathogenic and low pathogenic avian influenza virus into European poultry holdings, considering at least material contaminated by wild birds and contact with wild birds. EFSA Supporting Publications 2017;14:1282E. 10.2903/sp.efsa.2017.EN-1282 [DOI] [Google Scholar]
- EFSA , ECDC , EURL , Brown I, Kuiken T, Mulatti P, Smietanka K, Staubach C, Stroud D, Therkildsen OR, Willeberg P, Baldinelli F, Verdonck F and Adlhoch C, 2017. Avian influenza overview September – November 2017. EFSA Journal 2017;15(12):5141, 70 pp. 10.2903/j.efsa.2017.5141 [DOI] [PMC free article] [PubMed] [Google Scholar]
- EFSA AHAW Panel (EFSA Panel on Animal Health and Welfare), More S, Bicout D, Bøtner A, Butterworth A, Calistri P, Depner K, Edwards S, Garin‐Bastuji B, Good M, Gortázar Schmidt C, Michel V, Miranda MA, Nielsen SS, Raj M, Sihvonen L, Spoolder H, Thulke H‐H, Velarde A, Willeberg P, Winckler C, Breed A, Brouwer A, Guillemain M, Harder T, Monne I, Roberts H, Baldinelli F, Barrucci F, Fabris C, Martino L, Mosbach‐Schulz O, Verdonck F, Morgado J and Stegeman JA, 2017. Scientific opinion on avian influenza. EFSA Journal 2017;15(8):4991, 233 pp. 10.2903/j.efsa.2017.4991 [DOI] [Google Scholar]
- Fouchier RA, Munster V, Wallensten A, Bestebroer TM, Herfst S, Smith D, Rimmelzwaan GF, Olsen B and Osterhaus AD, 2005. Characterization of a novel influenza A virus hemagglutinin subtype (H16) obtained from black‐headed gulls. Journal of Virology, 79, 2814–2822. [DOI] [PMC free article] [PubMed] [Google Scholar]
- Gonzales JL, Elbers AR, Bouma A, Koch G, de Wit JJ and Stegeman JA, 2010. Low‐pathogenic notifiable avian influenza serosurveillance and the risk of infection in poultry – a critical review of the European Union active surveillance programme (2005–2007). Influenza and Other Respiratory Viruses, 4, 91–99. [DOI] [PMC free article] [PubMed] [Google Scholar]
- Krone O, Globig A, Ulrich R, Harder T, Schinkothe J, Herrmann C, Gerst S, Conraths FJ and Beer M, 2018. White‐Tailed Sea Eagle (Haliaeetus albicilla) Die‐Off Due to Infection with Highly Pathogenic Avian Influenza Virus, Subtype H5N8, in Germany. Viruses, 10. [DOI] [PMC free article] [PubMed] [Google Scholar]
- Mundt E, Gay L, Jones L, Saavedra G, Tompkins SM and Tripp RA, 2009. Replication and pathogenesis associated with H5N1, H5N2, and H5N3 low‐pathogenic avian influenza virus infection in chickens and ducks. Archives of Virology, 154, 1241–1248. [DOI] [PubMed] [Google Scholar]
- R Core Team , 2017. A language and environment for statistical computing. R Foundation for Statistical Computing, Vienna, Austria. Available online: https://www.R-project.org/
- SCAHAW , 2000. Opinion of the Scientific Committee on Animal Health and Animal Welfare on: ‘The Definition of Avian Influenza and the use of Vaccination against Avian Influenza’.
- StataCorp , 2017. Stata Statistical Software: Release 15. StataCorp LLC, College Station, TX. [Google Scholar]
- The Global Consortium for H5N8 and Related Influenza Viruses , 2016. Role for migratory wild birds in the global spread of avian influenza H5N8. Science (New York, N.Y.), 354, 213–217. [DOI] [PMC free article] [PubMed] [Google Scholar]
- Tumpey TM, Kapczynski DR and Swayne DE, 2004. Comparative susceptibility of chickens and Turkeys to Avian Influenza A H7N2 virus infection and protective efficacy of a commercial Avian Influenza H7N2 virus vaccine. Avian Diseases, 48, 167–176. [DOI] [PubMed] [Google Scholar]
- van den Brand JM, Krone O, Wolf PU, van de Bildt MWG, van Amerongen G, Osterhaus ADME and Kuiken T, 2015. Host‐specific exposure and fatal neurologic disease in wild raptors from highly pathogenic avian influenza virus H5N1 during the 2006 outbreak in Germany. Veterinary Research, 46, 24. [DOI] [PMC free article] [PubMed] [Google Scholar]


