

Abstract
This Opinion considers the application of whole genome sequencing (WGS) and metagenomics for outbreak investigation, source attribution and risk assessment of food‐borne pathogens. WGS offers the highest level of bacterial strain discrimination for food‐borne outbreak investigation and source‐attribution as well as potential for more precise hazard identification, thereby facilitating more targeted risk assessment and risk management. WGS improves linking of sporadic cases associated with different food products and geographical regions to a point source outbreak and can facilitate epidemiological investigations, allowing also the use of previously sequenced genomes. Source attribution may be favoured by improved identification of transmission pathways, through the integration of spatial‐temporal factors and the detection of multidirectional transmission and pathogen–host interactions. Metagenomics has potential, especially in relation to the detection and characterisation of non‐culturable, difficult‐to‐culture or slow‐growing microorganisms, for tracking of hazard‐related genetic determinants and the dynamic evaluation of the composition and functionality of complex microbial communities. A SWOT analysis is provided on the use of WGS and metagenomics for Salmonella and Shigatoxin‐producing Escherichia coli (STEC) serotyping and the identification of antimicrobial resistance determinants in bacteria. Close agreement between phenotypic and WGS‐based genotyping data has been observed. WGS provides additional information on the nature and localisation of antimicrobial resistance determinants and on their dissemination potential by horizontal gene transfer, as well as on genes relating to virulence and biological fitness. Interoperable data will play a major role in the future use of WGS and metagenomic data. Capacity building based on harmonised, quality controlled operational systems within European laboratories and worldwide is essential for the investigation of cross‐border outbreaks and for the development of international standardised risk assessments of food‐borne microorganisms.
Keywords: whole genome sequencing, metagenomics, microbial risk assessment, source attribution, antimicrobial resistance, typing of food‐borne pathogens, food‐borne outbreak investigation
Summary
To capitalise advances in the application of WGS and metagenomics in microbial risk assessment, a BIOHAZ Panel self‐tasking mandate was proposed asking for an Opinion with the following terms of reference:
Evaluate the possible use of next generation sequencing (e.g. WGS and metagenomic strategies) in food‐borne outbreak detection/investigation and hazard identification (e.g. generation of data on virulence and antimicrobial resistance (AMR) genes, plasmid typing) based on the outcomes of the ongoing WGS outsourcing activities, experience from different countries and underlining the added value for risk assessment.
Critically analyse advantages, disadvantages and limitations of existing Next Generation Sequence‐based methodologies (including WGS and metagenomics) as compared to microbiological methods cited in the current EU food legislation (e.g. Salmonella serotyping, Shigatoxin‐producing Escherichia coli (STEC) monitoring, AMR testing), taking into account benchmarking exercises.
Besides the use of WGS and metagenomics for hazard identification and outbreak investigation, their potential for other steps of the risk assessment process are described. The Opinion focuses on WGS and shotgun metagenomics and specifically on bacterial species. Viral, parasitic, yeast or fungal food‐borne pathogens were not considered. Cost/benefit analyses and technical recommendations on the use of WGS and metagenomics are not in the scope of this Opinion.
The relevant body of literature was reviewed and ISO standards and various EFSA WGS outsourcing activities were also considered.
The Opinion gives an overview of the different approaches for analysing WGS data and elaborates on the application of WGS for outbreak investigation, source attribution and risk assessment of food‐borne bacterial pathogens. The use of metagenomics in food‐borne outbreak investigation and microbial risk assessment is further discussed. In a final section, a SWOT analysis on the use of WGS and metagenomics as alternative methods for Salmonella and STEC serotyping, and on the determination of AMR in zoonotic and commensal bacteria is presented.
WGS offers the highest level of bacterial strain discrimination for food‐borne outbreak investigation, source‐attribution and hazard identification, and potentially more precise pathogen typing within risk assessment and thereby a more targeted risk assessment and risk management. The discriminatory power of WGS for pathogen characterisation is superior compared to previous molecular typing methods such as pulsed‐field gel electrophoresis (PFGE) or multilocus variable‐number tandem‐repeat analysis (MLVA), leading to the possibility to explore more precisely the phylogenetic relationship of bacterial isolates, allowing a more robust case identification during outbreak investigation. An increase capability to match clinical strains to contaminated food products enables to link cases to an outbreak, even when different food products and geographical regions are involved, facilitating epidemiological investigations. The main assumption during outbreak investigation is that low genetic differences imply recent transmission or a common source and thresholds have been used for communicating microbiological relationship. However, thresholds of genetic differences for inclusion and exclusion of isolates within an outbreak are not absolute and can be a source of misinterpretation if they are applied without considering the epidemiological context. Regardless of the thresholds used, epidemiological information should always be used to define outbreaks.
WGS allows for enhanced source attribution by providing improved identification of transmission pathways, through the integration of spatiotemporal factors and the detection of multidirectional transmission and pathogen–host interactions. The rapid increase in WGS use in food microbiology and public health has facilitated the development of new source‐attribution modelling approaches, adapted to the characteristics (e.g. discriminatory power) of WGS. Several alternatives to traditional frequency‐matching approaches are available; in particular, population structure models and machine learning techniques are more commonly applied.
WGS and metagenomics data can be used for multiple purposes by running several bioinformatic analyses on the same data set. These can be performed in parallel, in relation to the desired output of the analyses (e.g. outbreak investigation, source attribution, risk assessment) and also allow the use of previously sequenced genomes or metagenomes in new outbreak investigations. Accessing data and sharing bioinformatics tools is essential to ensure the efficient use of WGS and metagenomics in risk assessment in general and for outbreak investigations specifically. In fact, interoperable WGS data will have a major impact on the ability to investigate national and international outbreaks of food‐borne disease.
Integration of WGS and metagenomics in microbial risk assessment, based on their combination with phenotypic data, (meta)transcriptomics, (meta)proteomics and/or metabolomics, is expected to lead to the development of more targeted risk assessments and hence to more targeted risk management. The use of WGS data for routine surveillance enables monitoring of the emergence of highly pathogenic variants of microorganisms and transmission routes linked to the environment, animals and foods.
Metagenomics is a culture‐independent methodology with potential to contribute to food‐borne outbreaks detection/investigation (including those with unknown aetiology) and risk assessment of food‐borne pathogens, especially in relation to the identification and characterisation of non‐culturable, difficult‐to‐culture or slow‐growing microorganisms, the tracking of hazard‐related genetic determinants and markers (e.g. determinants for AMR, virulence or biological fitness), and the execution of risk assessments requiring the evaluation of complex microbial communities. Metagenomics approaches can assist in different ways the development of novel microbial risk assessment methodologies. Nevertheless, the impact of metagenomics on future risk assessment of food‐borne pathogens will depend on the ability to overcome some current methodological constraints (e.g. the lack of harmonised methods, the low sensitivity in detecting certain taxa in the sample and limitations related to specificity of target pathogens or bacterial communities, or the fact that results obtained strongly depend on the choice of wet laboratory workflows (i.e. nucleic acid extraction protocols and library preparation strategies) and the choice of bioinformatics pipelines.
Phenotypic and WGS‐based data exhibit a high level of agreement for Salmonella and STEC serotyping and for the determination of AMR genes confirming that these approaches can produce reliable results in the context of the relevant EU regulations. Overall, there is good evidence that the majority of Salmonella or E. coli isolates, previously untypeable by conventional serotyping, can be correctly serotyped using data derived from the genome sequencing. There is still a small amount of mismatching between the prediction in silico and serotypes obtained by phenotypic methods. For obtaining a more coherent classification for Salmonella and for resolving these mismatches, the White–Kauffmann–Le Minor scheme should be updated integrating genetic (i.e. seven genes MLST typing) and phenotypic information. Overall, it would be appropriate for the relevant regulations to be revised considering the benefits of WGS‐based typing. Concerning AMR monitoring and characterisation, the use of WGS would result in extra information on the nature and localisation of the resistance determinants in food‐borne organisms, which affect their dissemination potential by horizontal gene transfer and their potential contribution to the burden of AMR in humans. The limited degree of disagreement found between AMR phenotypes and WGS‐based genotypes is mainly related to chromosomal alterations or variable expression of resistance genes. However, the occurrence of previously unknown or novel resistance genes or mutations, which are not present in the available databases, makes the complementation of WGS‐based AMR prediction by phenotypic tests still indispensable. Nevertheless, the assessment of this Opinion confirms the conclusion that it would be appropriate to follow a gradual approach to the integration of WGS within the harmonised AMR monitoring.1
In the transition period of WGS implementation in service laboratories, the change to WGS may lead to operational adaptations of reference services at national and international level and to difficulties in data exchange. Differences in the bioinformatic tools and the databases used and the nomenclature applied will affect the comparability of the results. Therefore, it is recommended that international organisations for standardisation provide guidelines covering the entire process from DNA extraction to final result. In addition, further harmonisation and transparency in relation to the bioinformatic approaches, reference sequences and software developments for the analysis of WGS and metagenomics data are required. These need to be adapted to facilitate high throughput analysis especially when intended for routine use. Interoperable systems need to be implemented at local, national and international level for supporting the sharing of WGS and metagenomic data among the different partners in the food chain. Particular attention should be given to the type and the mode of WGS and metagenomic data to be collected, which needs to be performed in a comprehensible, standardised, and interoperable way, respecting the interests of the different partners. Capacity building for WGS (and metagenomics) within European laboratories and also worldwide is important to increase information exchange and associated benefits.
1. Introduction
1.1. Background and Terms of Reference as provided by the requestor
The potential of Next Generation Sequencing (NGS) (including WGS and metagenomics) is being actively considered for application in several areas including: pathogen characterisation and typing, food‐borne outbreak detection and investigation, risk assessment and high‐resolution molecular epidemiology (EFSA BIOHAZ Panel, 2014).
The European Food Safety Authority (EFSA) has been developing over recent years various activities related to WGS. A self‐tasking mandate proposed by the BIOHAZ Panel has been completed regarding the ‘Evaluation of molecular typing methods for major food‐borne microbiological hazards and their use for attribution modelling, outbreak investigation and scanning surveillance’. The resulting Part I Opinion reviews information on current and prospective (e.g. WGS) molecular identification and subtyping methods for food‐borne pathogens and evaluates their appropriateness for different purposes (EFSA BIOHAZ Panel, 2013a) and the Part II Opinion evaluates the requirements for the design of surveillance activities for food‐borne pathogens and reviews the requirements for harmonised data collection, management and analysis (EFSA Biohaz Panel, 2014).
The EFSA Scientific Colloquium on ‘Whole Genome Sequencing of food‐borne pathogens for public health protection’ in June 2014 gathered leading scientists, representatives of international and European organisations and national food safety authorities to discuss the use of WGS of food‐borne pathogens for the protection of public health (EFSA, 2015). One of the specific recommendations from this Scientific Colloquium highlights that EFSA and ECDC should assume a leading role within the EU framework to stimulate, steer and coordinate efforts for the application of WGS across health sectors to further food safety and protection of public health. In fact, BIOCONTAM and DATA Units have a constant dialogue with ECDC since 2015 on WGS topics at the Joint EFSA‐ECDC Steering Committee on the collection and management of molecular typing data from animal, food, feed and the related environment, and human isolates. BIOCONTAM Unit is also currently using the WGS analyses to support the validation of phenotypical antimicrobial resistance (AMR) data included in the Annual EU summary reports on antimicrobial resistance in zoonotic and indicator bacteria from humans, animals and food.
In addition, EFSA stimulates and encourages scientific research on WGS and the implementation of the results to benefit food safety. A few examples are:
the procurement activity ‘Closing gaps for performing a risk assessment on Listeria monocytogenes in ready‐to‐eat (RTE) foods: activity 3, the comparison of isolates from different compartments along the food chain, and from humans using whole genome sequencing (WGS) analysis’. The final results of this study included the sequencing of 1,143 L. monocytogenes isolates from different sources (food, processing environment, humans) and the creation of a database with all the isolate characteristics and associated descriptive epidemiological information (Møller Nielsen et al., 2017).
two thematic grants on new approaches in identifying and characterising microbiological hazards. The main objective is to make use of molecular approaches to identify and characterise microbial food‐borne pathogens, specifically using whole genome sequence (WGS) analysis, to enhance the understanding, the traceability and spread of food‐borne disease in humans. The final external scientific reports for these grants should be published between June 2018 and November 2018.2
the grant ‘Comparative genomics of quinolone‐resistant Campylobacter jejuni of poultry origin from major poultry producing European countries – GENCAMP’ which is taking place in Denmark and assisted by the BIOHAZ Team. This activity should be concluded by 18 November 2017.3
In April 2017, EC sent a request to EFSA and ECDC for technical support to extend the joint ECDC‐EFSA molecular typing database for the collection and analysis of WGS data from food‐borne pathogens. This project is important to allow the European Commission to: (i) improve crisis preparedness and management in the food and feed area, (ii) ensure a more effective and rapid containment of food and feed‐related emergencies and crises in the future, and (iii) support risk managers to quickly respond to challenges posed by threats such as multinational food‐borne outbreaks.
The integration of NGS (including WGS) data into routine surveillance and monitoring faces several challenges both within and across food safety/veterinary and public health sectors. For example, Regulation (EU) No's 200/20104, 517/20115, 200/20126 and 1190/20127 define the reference methods to be used in testing schemes aiming to verify progresses in the achievement of the EU targets for Salmonella in poultry populations in accordance with Regulation (EC) No 2160/20108. Salmonella serotyping is the basis for EU‐wide Salmonella control programmes (Reg. (EC) No 2160/2003 of the European Parliament and of the Council); WGS technology has introduced a new way of subtyping Salmonella isolates. The Regulation (EC) No 2073/20059 determines the reference methods to be used to verify compliance with the EU microbiological criteria for foodstuffs. These methods are often European Committee for Standardization (CEN)/ISO standard methods focusing on isolation of the pathogen. Also, Regulation (EC) No 882/200410 recommends the use of CEN methods if reference methods are not laid down in the EU legislation. Currently, there are no standard methods for the analysis of WGS data. The EU legislation allows the use of alternative methods if appropriately validated against the reference methods. ISO is developing a validation protocol which should enable in the future the validation of WGS subtyping methods against the conventional serotyping methods (i.e. White–Kauffman–Le Minor scheme).
EFSA (2015) indicated that a sense of urgency should be instilled in all partners regarding the implementation of NGS for food and public health safety across the EU. Therefore, in order to capitalize advances in the application of WGS and metagenomics it is suggested to initiate a BIOHAZ self‐tasking mandate on specific ‘proof‐of‐concept’ case studies documenting the potential of WGS and metagenomics for food safety procedures supporting evidence‐based risk assessment and food safety decision‐making.
Terms of reference (ToR)
Evaluate the possible use of Next Generation Sequencing (e.g. WGS and metagenomic strategies) in food‐borne outbreak detection/investigation and hazard identification (e.g. generation of data on virulence and AMR genes, plasmid typing) based on the outcomes of the on‐going WGS outsourcing activities, experience from different countries and underlining the added value for risk assessment.
Critically analyse advantages, disadvantages and limitations of existing Next Generation Sequencing‐based methodologies (including WGS and metagenomics) as compared to microbiological methods cited in the current EU food legislation (e.g. Salmonella serotyping, STEC monitoring, AMR testing), taking into account benchmarking exercises.
1.2. Interpretation of the Terms of Reference
ToR 1. Evaluate the possible use of Next Generating Sequencing (e.g. WGS and metagenomic strategies) in food‐borne outbreak detection/investigation and hazard identification (e.g. generation of data on virulence and AMR genes, plasmid typing) based on the outcomes of the on‐going WGS outsourcing activities, experience from different countries and underlining the added value for risk assessment.
ToR1 specifically refers to the use of WGS and metagenomics for outbreak investigation and hazard identification. Therefore, the Opinion mainly assesses the potential of WGS and metagenomics for these applications. However, WGS and metagenomics have the potential to be used in source attribution and in other steps of the risk assessment process, such as in exposure assessment, or the refinement of dose response for hazard characterisation. These other different applications of WGS and metagenomics within risk assessment schemes are briefly described throughout the Opinion and in particular under Sections 3.4.2 and 3.6.
ToR1 specifically refers to WGS and metagenomics strategies. Therefore, the Opinion exclusively evaluates the possible use of these technologies. Other NGS‐based multi‐omics approaches, such as (meta)transcriptomics (i.e. the study of the complete set of RNA transcripts that are produced by the genome or the metagenome, respectively), which also have possible applications in risk assessment of food‐borne microorganisms, are only briefly considered in the Opinion.
Technical recommendations on the use of WGS and metagenomics to characterise food‐borne pathogens (e.g. recommendations on where to store data, available software, etc.) will not be considered and the use of WGS and metagenomics to characterise viral, yeast, fungi and parasitic food‐borne pathogens will be excluded from this mandate.
The use of WGS within the harmonised monitoring recommendations for AMR is not considered in this Opinion, as an EFSA report was published in 2019 on the ‘Technical specifications on harmonised monitoring of AMR in zoonotic and indicator bacteria from food‐producing animals and food’ with a specific section on genetic characterisation and complementary molecular analyses (EFSA, 2019).
Metagenomics includes both amplicon sequencing‐based approaches and whole metagenome sequencing (WMS), also called shotgun metagenomics, approaches. Amplicon sequencing approaches are based on high‐throughput sequencing of exclusively selected gene markers, such as 16S rRNA, which allows for the taxonomic assignment of prokaryotes. Overall, the methodological process to conduct a gene marker metagenomic sequencing analysis implies: (i) total DNA isolation from the sample (RNA would be meaningful for viruses, which are excluded from this mandate); (ii) PCR amplification of the marker gene(s); (iii) introduction of barcodes and sequencing platform adapters during preparation of the sequencing libraries; (iv) next generation sequencing, generating millions of reads per sample; and (v) sequencing reads processing and analysis through bioinformatics. On the other hand, shotgun metagenomics, which involves the fragmentation of total DNA from a given sample to prepare the sequencing libraries and subsequent sequencing, assembly and annotation, allows scientists to gain information on its entire gene content. Thus, amplicon sequencing can be used for multiplex detection of pathogens, providing only information on population structure at different taxonomic levels. Shotgun metagenomics not only can provide species‐ or even strain‐level identification but also offers insights into some particular features (AMR, virulence potential, etc.) of microbial communities. Taking this into account, this Opinion will focus on shotgun metagenomics (both in ToR1 and ToR2), as this is the approach which has the potential to provide information on genetic determinants harboured by pathogenic bacteria, making it a more informative technique for risk assessment.
ToR 2. Critically analyse advantages, disadvantages and limitations of existing Next Generation Sequencing‐based methodologies (including WGS and metagenomics) as compared to microbiological methods cited in the current EU food legislation (e.g. Salmonella serotyping, STEC monitoring, AMR testing), taking into account benchmarking exercises.
Aspects related to the different levels of biological characterisation achieved with WGS‐based methods in a single analysis (i.e. species determination, lineage identification and type definition) when compared to the conventional microbiological methods, will be highlighted.
Currently, according to the Reg. 2073/2005 on microbiological criteria for foodstuffs, the STEC criterion in sprouted seeds only requires identification of STEC at the serogroup/serotype level, i.e. STEC O157, O26, O111, O103, O145 or STEC O104:H4. In this report we refer to the STEC serotype, also targeting the flagella H antigens, for example, STEC O157:H7 or O104:H4, since analysis of WGS data can detect both genes encoding O type and H type at the same time.
Cost/benefit analyses or comparisons of the state‐of‐the‐art in the application of WGS and metagenomics across Member States (MSs) in the EU are outside of the remit of this ToR as are a detailed comparison of the available tools for the analysis of WGS and metagenomics data.
2. Data and methodologies
In order to answer ToR1 the relevant body of literature was reviewed by the experts in the working group including EFSA Opinions and reports, guidance documents, ISO standards, scientific review papers, book chapters, peer‐review papers known by the experts or retrieved through non‐systematic searches as well as reports and Opinions from different national food authorities on the use of NGS in food safety and public health sectors. In addition, manual searching of the reference list of these documents was performed to identify additional relevant information. Details on some important input documents, including several describing the outcomes of various EFSA WGS outsourcing activities, are briefly summarised in Appendices as follows:
-
—
Appendix A: Closing data gaps for performing risk assessment on L. monocytogenes in ready‐to‐eat (RTE) Foods – activity 3: the comparison of isolates from different compartments along the food chain, and from humans using whole genome sequencing (WGS) analysis, LISEQ (SSI/ANSES/PHE/UA).
-
—
Appendix B: Establishing next generation sequencing ability for genomic analysis in Europe (ENGAGE).
-
—
Appendix C: Analytical platform and standard procedures for the integration of WGS to surveillance and the outbreak investigation of food‐borne pathogens in the context of small countries with limited resources (INNUENDO).
-
—
Appendix D: ECDC/EFSA joint Rapid Outbreak Assessments (ROAs).
The general data used to answer ToR1 are summarised in Figure 1.
Figure 1.
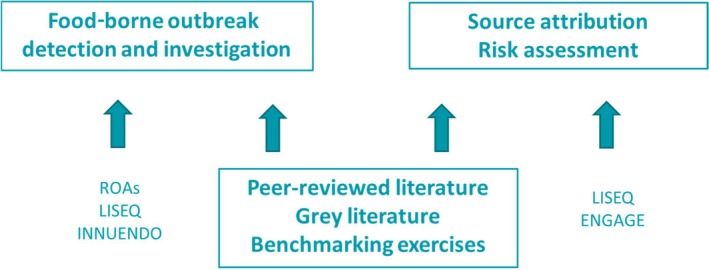
Summary of the data used to answer ToR1
In order to answer ToR 2, a SWOT (strengths, weaknesses, opportunities, threats) analysis of NGS‐based alternative methods was applied.
The uncertainty in this Opinion was investigated in a qualitative manner following the procedure detailed in the EFSA guidance on uncertainty analysis in scientific assessments (EFSA Scientific Committee, 2018). The sources of the main uncertainties were identified and for each of these the nature or cause of the uncertainties was described by the experts. Expert judgement was used to estimate the individual impact of each of the uncertainties on the possible use of WGS and metagenomics for microbiological risk assessment, source attribution and outbreak investigation conclusions (Table E.1 in Appendix E).
Table E.1.
Uncertainty analysis on the impact of NGS on food‐borne microbiological risk assessment, source attribution and outbreak investigation
| Source or location of the uncertainty | Nature or cause of the uncertainty as described by the experts | Impact of the uncertainty on the possible use of WGS and metagenomics for microbiological risk assessment, source attribution and outbreak investigation |
|---|---|---|
| The technical developments in the field of WGS and metagenomics |
|
It is expected that the technical evolutions would make the methodology more accessible for practical application which is estimated to lead to a medium higher impact of WGS and metagenomics on food‐borne outbreak investigation, source‐attribution and microbial risk assessment |
| The adaptation potential of service laboratories |
|
It is estimated that the capacity building will be considerably supported by competent authorities, which is expected to lead to a medium higher impact of WGS and metagenomics on food‐borne outbreak investigation, source‐attribution and microbial risk assessment |
| The developments in the field of standardisation, quality assurance and data sharing |
|
Standardisation and capacity building for data sharing in the EU is highly uncertain with a great impact on the final applicability of the methodology: depending on the future management decisions this is estimated to lead to a largely lower or largely higher impact of WGS and metagenomics on food‐borne outbreak investigation, source‐attribution and microbial risk assessment |
| Literature search methods |
|
It is expected that the impact of the uncertainties related to the literature used in this Opinion is relatively low because of the experience of the working group members and the BIOHAZ panel members: this uncertainty is estimated to lead to a small lower or small higher impact of WGS and metagenomics on food‐borne outbreak investigation, source‐attribution and microbial risk assessment |
| Use of expert judgement |
|
It is expected that the impact of the uncertainties related to expert judgement used in this Opinion is relatively low because of the experience of the working group members and the BIOHAZ panel members: this uncertainty is estimated to lead to a small lower or small higher impact of WGS and metagenomics on food‐borne outbreak investigation, source‐attribution and microbial risk assessment |
| Benchmarking exercises (Salmonella and STEC serotyping, WGS‐based genotyping of strains for AMR) |
|
The lack of a suitable gold standard for several parameters creates an uncertainty which is estimated to lead to a medium lower or medium higher impact of WGS on food‐borne outbreak investigation, source‐attribution and microbial risk assessment |
| It is expected that, once standardised methods and sufficient education are provided, the methodology can reach a high level of accuracy, reproducibility and repeatability; the uncertainty is then estimated to be low and can lead to a small lower or higher impact of WGS and metagenomics on food‐borne outbreak investigation, source‐attribution and microbial risk assessment |
3. Assessment
The assessment starts with the description of the different approaches for analysing WGS data, followed by elaborating on the application of WGS for surveillance of food‐borne pathogens, source attribution and microbial risk assessment (MRA). The use of shotgun metagenomics in food‐borne outbreak investigation and MRA is further discussed. In a final section, a SWOT analysis is elaborated on the use of NGS‐based alternatives for Salmonella serotyping, STEC serotype identification and the determination of AMR in zoonotic and commensal bacteria.
3.1. Approaches for analysing WGS data
WGS laboratory and analysing procedures are based on generic species‐independent protocols and consolidate many different methodologies currently used in food, veterinary and clinical laboratories. WGS provides insight on the ancestral relationship between isolates at very high resolution, facilitating laboratory‐based surveillance at the international level and opening the door to future reductions in the burden of food‐borne disease.
Currently, to analyse WGS data for cluster detection and outbreak investigation two main approaches are used: (i) single‐nucleotide polymorphism (SNP) and (ii) multilocus sequence typing (MLST) approaches. SNP calling utilises the genetic variations of single nucleotides between a reference strain and a strain of interest. MLST is also referred to as the gene‐by‐gene approach and mostly considers genetic variations in either the core genome MLST (cgMLST), including thousands of core genes, or the whole genome MLST (wgMLST), including also the accessory genes of the species or genus. These approaches are not mutually exclusive, they can be used simultaneously and also with the characterisation of the isolates based on the identification of genetic determinants for serotyping, AMR and/or virulence.
The two main approaches differ in several fundamental aspects, making them not directly comparable. A study on outbreak isolates compared cgMLST and wgMLST analysis with SNP‐based analysis for epidemiological investigation (Pearce et al., 2018). All approaches grouped most of isolates into the same clusters, whether they were analysed by SNP calling, cgMLST or wgMLST. In general, SNP‐based approaches might reach higher discriminatory power compared with gene‐by‐gene approaches, especially for clonal species or subgroups within a species (Pearce et al., 2018). The higher level of discrimination that can be provided by SNP typing is very useful to reconstruct the transmission dynamics of certain epidemics. It has been suggested that comparing typing results across laboratories would be easier by cgMLST but challenges in harmonisation and standardisation exist for cgMLST and especially for SNP analysis (Carrico et al., 2018; Llarena et al., 2018; Pearce et al., 2018).
A critical factor affecting the accuracy and the discrimination of SNP calling is the selection of a reference genome for alignment with the test sequence. The resolution decreases with decreasing genetic identity between the reference and test strain sequence. Therefore, the selection of a reference genome with minimal distance with the other sequences included in the analysis maximises the number of variants called, increasing resolution. However, the ad hoc selection of the reference genome compromises the ability to maintain a common strain designation across analyses. Solutions to store bacterial SNP variant data facilitating reproducible and scalable analysis of bacterial populations and the application of standardised SNP‐based strain designation have been developed. One example is SnapperDB designed by the Public Health of England (PHE) which, coupled with a standardised pipeline for SNP calling (i.e. PHEnix), supports strain nomenclature in use in the routine WGS‐based surveillance of several bacterial species in PHE. However, in general, the results from SNP‐based approaches are not directly comparable between laboratories because of a number of confounding variable factors, such as the number of sequences included for analysis, the quality parameters used by the tool, the high level of discrimination and the selection of the reference genome. For that reason, the SNP‐profile of a strain is not unambiguous, which can make communication of results with other actors in the outbreak investigation and the public difficult (Gerner‐Smidt et al., 2017).
The main advantages of cgMLST and wgMLST are their independence from the selection of a reference genome to compare with and the application of allele nomenclature schemes where specific allelic profiles provide an unambiguous identification of the sequence to be investigated, facilitating the comparison between analyses and the application of strain type designations. Allelic profiles can be communicated without sharing raw sequences, if laboratories use the same scheme and same nomenclature server. As such, repeated analysis on the same sequences can be avoided, thereby saving laboratory and computing time (Maiden et al., 2013). However, different schemes can provide different results, affecting interoperability between laboratories. There are a number of open‐source food‐borne pathogen‐specific databases for wgMLST and cgMLST schemes available, e.g. databases and schema for E. coli, Salmonella enterica, Yersinia, Vibrio, and Clostridioides implemented in EnteroBase and hosted at the Warwick Medical School, UK (https://enterobase.warwick.ac.uk/); database and schema for Campylobacter jejuni and Campylobacter coli implemented in pubMLST hosted at the University of Oxford, UK (https://pubmlst.org/campylobacter/); database and schema for L. monocytogenes hosted at the Institut Pasteur, France (http://bigsdb.pasteur.fr/listeria); database and schema for C. jejuni and Yersinia enterocolitica developed within the INNUENDO platform and available for download (https://doi.org/10.5281/zenodo.1421262; https://zenodo.org/record/1322564). Furthermore, there are on the market commercial software packages which have implemented their own wgMLST and cgMLST schemes. In addition to the interoperability problems related to the use of different schemes, the effect of different analytical steps on the accuracy and reproducibility of the allelic profiles is still unclear. Analytical steps considered are read trimming, assembling strategy and allele calling. Moreover, although gene‐by‐gene‐based approaches are highly suitable for the adoption of a common strain type designation, there is still a lack of clarity on how to design a stable strain nomenclature for all the relevant bacterial species. These difficulties are related to the fact that the evolutionary forces shaping the population of pathogens are very different across different species or even different lineages of the same species, hampering the definition of a universal method. More detailed considerations of nomenclature are provided by the European food‐ and waterborne disease (FWD)‐NEXT Expert Group (http://ecdc.europa.eu/en/publications/Publications/food-and-waterborne-diseases-nextgeneration-typing-methods.pdf).
3.1.1. Discriminatory potential of WGS and comparison to conventional typing methods
WGS is increasingly replacing the current phenotypic and genotypic reference methods including serotyping, phage typing, pulsed‐field gel electrophoresis (PFGE), multilocus variable‐number tandem‐repeat analysis (MLVA) and multilocus sequence typing (MLST) (Kanagarajah et al., 2018; Ribot and Hise, 2016). Although PFGE has proved an invaluable tool for outbreak surveillance for > 20 years (Ribot and Hise, 2016), it does have limitations. PFGE patterns cannot be obtained for all bacterial strains using the same enzymes, and PFGE may not fully distinguish background cases from outbreak cases for clonal organisms such as Salmonella enterica serovar Enteritidis (Deng et al., 2014). Isolates with different PFGE patterns can also be highly related because PFGE analysis incorporates the whole genome, including the accessory genome. For some food‐borne bacterial pathogens, in some cases (e.g. involvement of prophages and plasmids), the accessory genome is dynamic and can vary between isolates within the same outbreak.
WGS has been shown to greatly enhance cluster detection, and improve resolution and accuracy in comparison to PFGE and MLVA in Salmonella, STEC and Listeria (Dallman et al., 2015; Morganti et al., 2018; Reimer et al., 2019; Ung et al., 2019; Waldram et al., 2018). The discrimination of the outbreak epidemiology provided by WGS is not possible to reach using traditional microbial typing methods (Pearce et al., 2018).
3.1.2. Standardisation, proficiency testing and quality assurance of WGS
There is a requirement for standardisation of the analysis of WGS data with the goal being the development of a universal scheme for strain nomenclatures and shared databases for uploading and comparing sequences. Different approaches adopted by individual countries may hinder the important process of detecting cross‐border bacterial genomic clusters and comparing and identifying possible sources in order to resolve an outbreak. The DNA extraction, library preparation and sequencing part of WGS is being harmonised and an ISO/CD standard 23418 on WGS for typing and genomic characterisation of food‐borne bacteria specifying the minimum requirements for generating and analysing WGS data is under development. However, further harmonisation and transparency in relation to the bioinformatic approaches, reference sequences and software developments for the analysis of WGS data are required. They need to be adapted to facilitate high throughput analysis especially when intended for routine use.
The European Union Reference Laboratory (EURL)‐VTEC is currently coordinating a working group on NGS from the European Commission with representatives from all the EURLs for food‐borne pathogens and AMR. This working group aims to develop guidance documents or standard operation procedures (SOPs) for NGS‐based proficiency testing schemes as well as bioinformatics tools for NGS data mining and benchmarking analytical methods and pipelines.
Apart from the development of international standards for WGS by the official standardisation bodies, such as ISO or CEN, alternative methods for the prediction of the serotypes or for AMR monitoring need to be thoroughly validated, to show that the results obtained by WGS are comparable to those obtained using reference methods. Part 6 of the EN ISO 1614011 is intended to provide a specific protocol for the validation of such typing procedures.
Proficiency testing and quality assurance programmes have already been initiated for WGS. Regular proficiency testing schemes have been run by the Global Microbial Identifier (GMI, https://www.globalmicrobialidentifier.org/workgroups/about-the-gmi-proficiency-tests) since 2015 to asses laboratory's DNA preparation and sequencing procedures, sequencing output, and procedures to identify variant sites within WGS data and cluster and distinguish samples based on those variants. The different proficiency testing schemes focussed on S. enterica, E. coli, Staphylococcus aureus, and/or C. coli and C. jejuni, L. monocytogenes and Klebsiella pneumoniae.
ECDC has external quality assessment (EQA) schemes in place for typing of Salmonella, Listeria and STEC since 2012, and identifying a cluster of closely related isolates based on PFGE, MLVA and/or WGS was included in the EQA from 2017. The objectives of the EQA scheme are to assess the quality and comparability of molecular typing data produced by national public health laboratories in FWD‐Net. The idea of the cluster analysis part of the EQA was to assess the laboratories ability to identify a cluster of genetically closely related isolates given the fact that a multitude of different laboratory and analytical methods are used as the primary cluster detection approach in MSs. This part of the EQA assessed the participants’ ability to reach the correct conclusion, i.e. correctly categorise cluster test isolates, not the ability to follow a specific procedure. The performance was high, with 91% to 92% correctly identifying the cluster of closely related isolates (ECDC, 2018a,b, 2019a). In addition, ECDC has run its first proficiency test specifically for whole genome assembly in 2018, for L. monocytogenes (ECDC, 2019b). This test was performed for assessing the ability of the national public health laboratories to provide concordant assembly, a critical step for all subsequent analyses such as cluster detection using cg/wgMLST methodologies, AMR prediction and in silico typing. In particular for cluster detection, errors in the assembly can easily obscure the cluster signal. Ten out of 14 participating national public health laboratories had at least one concordant assembly pipeline (ECDC, 2019b).
In November 2017, the EURL‐VTEC organised for the first time a voluntary interlaboratory exercise on WGS of pathogenic E. coli, to be run in parallel to the sixth study organised by EURL‐VTEC on typing of pathogenic E. coli through PFGE for the benefit of the network of national reference laboratories (NRLs) for E. coli (PT‐PFGE6). The objectives of this exercise study were: (i) to evaluate the quality parameters of the sequences produced and their effect on the WGS‐based characterisation of STEC and (ii) to evaluate the interlaboratory and platform variability in terms of SNPs in the genomes produced (EURL‐VTEC, 2019).
3.2. WGS for food‐borne outbreak detection and trace back investigation
3.2.1. Value of WGS for food‐borne outbreak detection and trace‐back investigation
Food‐borne outbreak investigation ensures the continued improvement of food safety in Europe. In total 5,079 food‐borne and waterborne outbreaks have been reported for the year 2017 by 27 MSs (EFSA and ECDC, 2018b). Countries in the EU have different systems for surveillance of food‐borne pathogens and not all are using WGS. There are therefore challenges when trying to access the true number of cases in a cross‐border outbreak and compare with possible outbreak sources. It is important to define outbreak cases by a number of methods, in order for all countries to have the possibility to respond. Employing WGS‐based methodologies within regulatory frameworks requires a coordinated effort between different actors (i.e. microbiologists, epidemiologists and bioinformaticians) from all involved sectors (i.e. public health and food safety). This process implies several changes at different levels: organisational, cultural, technical and scientific (WHO, 2018).
Implementation of WGS has led to an increase in the number of clusters and outbreaks detected in various countries (Anonymous, 2018; Dallman et al., 2015; Mook et al., 2018; Waldram et al., 2006). Food‐borne outbreaks can be small in case numbers and/or geographically dispersed, indicative of low‐level, intermittent contamination of food products (Byrne et al., 2016). It has been shown that epidemiological investigations are often confounded by poor patient recall of the food they consumed before onset of symptoms, particularly when the product is a side dish (e.g. salad leaves or raw vegetables) or an ingredient of the main dish (e.g. herbs or spices), so called ‘stealth vehicles’ (Byrne et al., 2016). The time delay between exposure to the contaminated food, outbreak detection and follow‐up interviews also reduces accurate patient recall of their food history, further confounding the investigation. Prior to the implementation of WGS, small nationally distributed clusters often occurred below the surveillance radar. WGS combined with epidemiological investigation provides the discriminatory power to recognise low‐intensity, extended time‐period outbreaks and link them to food products (Gillesberg Lassen et al., 2016). Retrospectively, historical outbreaks have been investigated applying WGS, and there is evidence that WGS analysis helps define a more targeted case definition when compared to methods used previously for cluster detection (Gymoese et al., 2017; Morganti et al., 2018; Revez et al., 2014a,b; Simon et al., 2018; Ung et al., 2019). The level of certainty offered by WGS provides the impetus to drive outbreak investigations and direct trace‐back enquiries and has led to the successful resolution of outbreaks (Byrne et al., 2015; Gobin et al., 2018; Sinclair et al., 2017; Mikhail et al., 2018; Jenkins et al., 2019).
WGS data has the potential to offer robust, high‐level phylogenetic resolution and utilises quantifiable genetic differences that provide insight on the evolutionary context of an outbreak strain. There is the possibility for identifying the geographical origin and/or animal reservoir of an outbreak strain by analysing epidemiological data associated with cases in phylogenetically related subclusters (Mikhail et al., 2018; ECDC, 2019a; Jenkins et al., 2019; Siira et al., 2019). Epidemiological and trace‐back investigations using WGS data have provided insight into transmission routes linked to food‐borne exposures associated with emerging gastrointestinal pathogens (Gilmour et al., 2010; EFSA and ECDC, 2018d).
The main assumption during outbreak investigation is that low genetic differences imply recent transmission or a common source. When interpreting WGS results used in the frame of outbreak investigations and tracing studies in the food chain to identify the source of contamination, a number of points need to be considered. The generation time of a bacterial population and consequently the microevolution of a population can be affected by many intrinsic and extrinsic factors (Jagadeesan et al., 2019). Therefore, genome sequences of isolates arising from the same source of contamination are not necessarily identical and monomorphic strains are not necessary coming from the same source. Thus, interpretation of WGS data has to consider the knowledge of the natural mutation rates of the particular pathogen, and its behaviour in the food chain under the specific environmental processing factors (e.g. temperature, pH value, pressure, disinfection procedures) (Besser et al., 2018; Schürch et al., 2018). In consequence, this might lead to misinterpretation when epidemiological data of the samples are not sufficiently considered. Furthermore, the amount of diversity sampled when analysing a source population is dependent on the effective size of the population and the duration of infection. This makes the estimation of representativeness of the analysed isolates in case of an outbreak investigation difficult. Therefore, it is not prudent to define absolute thresholds of nucleotide differences for inclusion and exclusion of isolates within an outbreak, and epidemiological information should always be used, to define outbreaks.
A combined approach including WGS of isolates and epidemiological analysis by involvement of public health, veterinary and food institutes facilitates an effective collaborative investigation. Several national and EU investigations have found outbreak strains identified using WGS that seem to be persisting in the food chain. Food products have been withdrawn in several cases and the control measures implemented have contained outbreaks and reduced the risk of human infection (Kleta et al., 2017; EFSA and ECDC, 2018d,e; Ung et al., 2019). However, this is not always the case as, despite the implementation of control measures, new cases sometimes appear linked to the outbreak suggesting that a source of contamination is still active (EFSA and ECDC, 2018c).
Evidence from other EU epidemiological, microbiological, environmental and tracing investigations on Salmonella outbreaks has also identified sources of infection. Withdrawal and/or recall measures implemented are likely to have reduced the risk of further human infection (EFSA and ECDC, 2017a,b, 2018f).
3.2.2. WGS data sharing
Due to the globalisation of the food supply chains, the timely and broad sharing of genetic resources is essential for tracing the origin of food‐borne pathogens and the spread of their lineages from animals to humans and across countries. Rapid sharing of WGS data would ensure efficient cross‐border food‐borne outbreaks investigations, allow rapid and precise risk assessments, and facilitate evidence‐based interventions (FAO, 2016; WHO, 2017). Several international infrastructures and standards for WGS data sharing have been established in the context of public health and food‐borne pathogens. Most of these initiatives take advantage of the resources offered by the three databases that are part of the International Sequence Database Collaboration (INSDC), i.e. the Sequence read archive (SRA) of the National Center for Biotechnology (NCBI), the European Nucleotide Archive (ENA) of the European Bioinformatics Institute (EBI) and the DNA Data Bank of Japan (DDBJ) (Lüth et al., 2018). Such endeavours were initiated by a few countries and further developed by international consortia such as the GenomeTrakr Network12 (Stevens et al., 2017), the Global Microbial Identifier consortium13 (Taboada et al., 2017) and the PulseNet International consortium (Nadon et al., 2017) and the Compare consortium (Aarestrup and Koopmans, 2016), with the endorsement of many international organisations such as WHO, FAO, ECDC and EFSA. EC also supports similar visions and, with the goal of ensuring an efficient sharing of relevant sequence information in the context of European multi‐country food‐borne events, intends to extend the EFSA and ECDC joint database for food‐borne pathogens to the collection and analysis of WGS data (ECDC et al., 2019).
Although there is a general understanding on the benefits related to the sharing of WGS data at national and international level, several factors need to be taken into consideration to ensure the equitable access to the data, respecting the ownership and rights of the data providers (Aarestrup and Koopmans, 2016). Some institutions such as PHE and the GenomeTrakr consortium have already gained experience with releasing WGS data in the public domain in real‐time (Allard et al., 2016), but consent for sharing certain sequence data is more readily agreed than for other such as data from internationally traded food or food animal commodities. Multiple concerns have been raised including: the misuse or misinterpretation of WGS data when they are published without accompanying scientific documentation, unauthorised data use (particularly for data on isolates from commercial parties), trade and tourism governmental interests, patenting and intellectual property issues, possible violation of sovereign rights and the need to protect patient's privacy rights (Aarestrup and Koopmans, 2016; Dos et al., 2018; Lüth et al., 2018; Ribeiro et al., 2018; WHO, 2018). Different political, ethical, administrative, regulatory and legal components influence the strategies to be adopted. Round tables with all involved stakeholders and a maximum of transparency can contribute to a political support for WGS data sharing from both authorities and industry (Jagadeesan et al., 2019). Moreover, clarification of existing regulations on data protection and sharing, such as the Nagoya Protocol (UNEP, 2011), and their application for sharing of genetic resources of pathogens is essential, especially during imminent public health emergencies (Dos et al., 2018). The inclusion in the existing regulation of special exceptions to specific requirements for the sharing of pathogen sequencing data in case of public health emergencies (i.e. art. 4 point 8 of Regulation 511/2014 on the Nagoya Protocol), or the drafting of a memorandum of understanding (MoU) that regulates data ownership and publication as a prerequisite to be integrated in a global data sharing community, are possible solutions to some of the existing concerns (Lüth et al., 2018). In 2016, a collaboration agreement was signed by EFSA, ECDC and the EURLs for Salmonella (RIVM), L. monocytogenes (ANSES) and VTEC (ISS) on the management of data on molecular testing of food‐borne pathogen isolates from food, feed, animals and the related environment, collected by EFSA, and their use together with molecular typing data on isolates from humans, collected by ECDC. Thereafter, from 2016 to 2019, in the food sector side 11 EU MSs endorsed this Collaboration Agreement which specifies the data ownership, availability, access, use and publication during and after their collection. In the public health side, a comparable agreement was signed by 16 MSs.
Sequencing data per se do not usually allow the trace back to the contamination source without holding epidemiological data and other relevant contextual information (Griffiths et al., 2017) on the isolates, but can act as a trigger for initiating epidemiological investigations. As a result of the Global Microbial Identifier initiative, a minimum set of contextual data for repository submissions have been developed and adopted by SRA and ENA (Taboada et al., 2017). Similarly, the agreement signed between EFSA, ECDC, EURL and 11 MSs from the food safety side and 16 MSs from the public health side in EU define specifically which epidemiological data can be shared between institutions and across sectors. However, it is difficult to reach an international consensus on the content and the granularity of the contextual information (Griffiths et al., 2017) to be shared associated to WGS sequencing data (Lüth et al., 2018), resulting in different proposals across consortia, between countries and international institutions. Moreover, problems also arose due to inconsistencies in the descriptors and the difficulties in capturing the large number of incompatible food classifications used worldwide, complicating integration between agencies (Griffiths et al., 2016).
Nevertheless, promising approaches are being discussed internationally to overcome problems associated with the sharing of WGS and contextual data, especially where there is an immediate risk for public health. It is proposed to support the sharing of anonymous WGS data while restricting the distribution of certain relevant contextual data to trust parties. In this model, sensitive epidemiological metadata such as names of companies or person‐sensitive data are withheld by the original owner who can be contacted for further action in the case of emergency. The epidemiological assessment therefore remains with the responsible bodies via the non‐public metadata server through decentralised sharing of contextual data (Cisneros et al., 2018).
Some data sharing initiatives have adopted the approach of coupling WGS data sharing with data analysis resources. This is the case of the Pathosystems Resource Integration Center (PATRIC) (Wattam et al., 2016) which combines data and associated metadata imported monthly from NCBI with several data analysis resources including the possibility to explore in detail user‐selected genomes and the capability to compare private data against available public data. Another example is EnteroBase which consists in a user‐friendly genome database, enabling bacteriologists to identify, analyse, quantify and visualise genomic variation principally within several bacterial genera, including Salmonella, E. coli and Yersinia.
3.2.3. Concluding remarks
Clustering of cases based on WGS increases the specificity and sensitivity in detecting isolates sharing a common ancestor and could facilitate the epidemiological investigation.
WGS provides superior strain‐level discrimination compared with other molecular typing methods, specifically PFGE and MLVA, reducing the likelihood of sporadic (background) cases being included in the outbreak, and supporting evidence that cases are epidemiologically linked to a common source.
Thresholds of genetic differences for inclusion and exclusion of isolates within an outbreak are not absolute and can be a source of misinterpretation if they are applied without considering the epidemiological context. Regardless of the thresholds used, epidemiological information should always be used to define outbreaks.
WGS typing utilises quantifiable genetic differences and the WGS analysis can provide insight on the evolutionary context of an outbreak strain.
Use of WGS data for routine surveillance enables monitoring the emergence of highly pathogenic variants and transmission routes linked to the environment, animals and food.
Methods for DNA extraction, library preparation and sequencing within the WGS process are being optimised and ISO standards on genomic sequencing of food‐borne pathogens are being developed. Further harmonisation and transparency in relation to the bioinformatic approaches, reference sequences and software developments for the analysis of WGS data are required. These need to be adapted to facilitate high throughput analysis, especially when intended for routine use.
Accessing data is essential to ensure the efficient use of WGS in outbreak investigations. In fact, sharing of interoperable WGS data will have a major impact on the ability to investigate national and international outbreaks of food‐borne disease.
Employing WGS‐based methodologies within regulatory frameworks requires a co‐ordinated effort between different players from all relevant sectors to manage the change at organisational, cultural, technical and scientific levels.
3.3. WGS for source attribution
Source attribution is understood as partitioning the liability of a human food‐borne disease over different sources of the food‐borne pathogen (Mughini‐Gras et al., 2018a; Pires et al., 2018). The term ‘source’ in source attribution includes both reservoirs (e.g. animals, environment) and vehicles (e.g. food). Disease may be attributed at different points of attribution, including at the point of reservoir and at the point of exposure (Pires et al., 2018). ‘Source’ is thus not to be confused with the (food) ‘vehicle’ term used in the context of outbreak investigation, which refers to the identified specific source of transmission of the outbreak causative agent. WGS data originating from outbreak investigations are often posteriorly applied in source‐attribution modelling, usually together with WGS data from wider collections of isolates, including also sporadic human cases of the same food‐borne disease.
Source‐attribution often relies on microbial subtyping results. The basic principle of microbial subtyping source attribution is to group subtypes found among strains from human cases with the subtypes found in potential sources of the pathogen. Microbial subtyping source attribution methods include frequency‐matching models and population genetic models. In the first, the distribution of the subtypes detected in humans is compared to the frequencies of the same subtypes observed among different sources, and in the latter the pathogens′ evolutionary history is modelled across different sources (Pires et al., 2018).
Frequency‐matching models have been extensively used with traditional subtyping results, particularly serotyping, to attribute cases of human food‐borne disease to food sources of animal origin, assuming unidirectional transmission from animals to humans (Mughini‐Gras et al., 2018a). In these models, human disease cases are attributed to different sources according to the occurrence of indicator subtypes, i.e. subtypes regarded as indicators of a particular animal source due to their almost exclusive occurrence in that source. Frequency‐matching approaches include the Hald model (Hald et al., 2004) and its modified versions (Barco et al., 2013; de Knegt et al., 2016; Mullner et al., 2009) and the original and modified Dutch models (Mughini‐Gras et al., 2014; van Pelt et al., 1999). Frequency‐matching models cannot attribute the human cases infected with subtypes exclusively found in humans, thus resulting in a non‐attributable fraction of cases.
Population genetic models are often the choice with genotyping results. These models are especially preferred when the pathogen subtypes are not genetically stable along the farm‐to‐fork continuum (Mughini‐Gras et al., 2018b), i.e. genome changes are expected to have occurred along the transmission pathway from the animal reservoir to the consumer. In general, these methods are based on the identification of genetically similar individuals in a larger population by clustering genotype data based on statistical modelling of population structure, using either Bayesian or maximum‐likelihood based approaches.
The pathogen's clonality pattern and its degree of association with each source are determining factors for the optimal level of discrimination needed for source attribution. Ideally, the genetic diversity between isolates should allow inference about the source they originated from. By using WGS‐based subtyping schemes, the resolution of isolate typing that is possible to obtain is higher than that obtained using traditional phenotyping (serotyping) or genotyping methods (PFGE, MLVA, 7‐locus MLST). Thereafter, the approach chosen to analyse WGS data (e.g. based on allele or nucleotide differences) may also result in different levels of discrimination (Franz et al., 2016).
The success of source‐attribution also depends on the data representativeness of the epidemiological context in question. Studies are needed to define sampling strategies that ensure statistical power and enough representativeness. Representative data sets are rarely obtained due to biased sample availability (e.g. local sampling surveys of some sources against national sampling of other sources; lack of representativeness of all human cases, etc.) and lack of sampling of putative infection sources (e.g. Salmonella transmission from reptiles or wild birds) (Mughini‐Gras et al., 2018a; Thépault et al., 2018). Together with pathogen clonality, these are source attribution constraints that are not exclusive to WGS‐based models; however, they may have a more extensive impact on the attribution results as the discriminatory level of the data increases. Furthermore, it is important to consider the time span of isolate collections, since genotypic profiles may vary greatly over time (e.g. MLST profiles of Campylobacter) (Thépault et al., 2018). The extent to which source‐attribution may benefit from WGS depends on existing models (frequency‐matching and population genetics) being able to accommodate more discriminatory data, and on the development of new modelling approaches targeted at the use of WGS data. Once successful modelling approaches are available, the application of WGS in source attribution is expected to enhance the identification of transmission pathways.
3.3.1. Identification of transmission pathways
The higher resolution of WGS data, compared to phenotyping and other genotyping methods, offers the possibility to investigate pathogen transmission hypotheses previously elaborated based on results with lower molecular resolution, and thus enhances the understanding of transmission pathways. For example, Mather et al. (2015) provided an overview of population genetics source‐attribution studies using molecular data to understand the transmission of non‐typhoidal Salmonella in Africa. Non‐WGS molecular methods had predominantly shown that the salmonellae found in humans are different from those found in animals, and therefore the human population was believed to be the most relevant transmission source. WGS‐based source‐attribution studies subsequently confirmed this important role of human‐to‐human transmission, by demonstrating a clear adaptation of S. Typhimurium ST313, often responsible for invasive disease, to the human host (Okoro et al., 2015). Another example showed variable zoonotic potential among bovine E. coli O157 isolates, with only a minority predicted to be associated with human disease, contrary to preliminary assumptions (Lupolova et al., 2016).
New considerations in source‐attribution modelling, such as including spatiotemporal factors, multidirectional transmission and different properties of pathogen subtypes in interaction with the sources may be facilitated with the use of WGS (Mughini‐Gras et al., 2018b; Palma et al., 2018),additionally supporting the investigation of transmission pathways.
A recent frequency‐matching source‐attribution study for the transmission of extended‐spectrum β‐lactamase‐producing (ESBL) and plasmid‐mediated AmpC‐producing (pAmpC) Escherichia coli considered human‐to‐human transmission of ESBL and pAmpC genes (Mughini‐Gras et al., 2019). This study showed that the majority of community‐acquired carriage is attributable to human‐to‐human transmission. ‘Human’ is traditionally not considered as a source in frequency‐matching models. This new approach has been facilitated by the use of WGS (frequency of ESBL and pAmpC genes in E. coli isolates) instead of serotyping results.
WGS‐based comparative genomic studies have provided evidence that bacterial genomes can evolve in a host‐dependent manner. Such evidence provides valuable insights for the identification of transmission pathways. For example, it was possible to identify markers that appear to be associated with Salmonella adaptation to warm‐blooded hosts or a specific human population (den Bakker et al., 2011; Desaiet al., 2013; Okoro et al., 2015). Genetic evidence of host‐association of Salmonella Derby to pork and poultry was also found (Sévellec et al., 2018) and loss of gene function of particular genes was identified as a characteristic of host‐restricted Salmonella serovars Gallinarum and Pullorum (Langridge et al., 2015). Another study identified a seven‐gene region with a host association signal among cattle, chicken and wild bird Campylobacter isolates (Sheppard et al., 2013). Such studies stand however challenged, since several factors may influence the definition of host‐adapted lineages in natural bacterial populations (Sheppard et al., 2018) and factors that affect gene expression in vivo (Petersen et al., 2019; Qin et al., 2019) and epigenetics need to be considered in addition to WGS data in order to determine the epidemic potential of host‐adapted strains.
While WGS‐based source‐attribution may help determining transmission pathways, it does not suffice without complementary epidemiological data. Monophyletic relationship of isolates alone is often not sufficient to evaluate historical transmission, for which additional epidemiological information is necessary. Integration of epidemiological data into source attribution modelling has been considered a major challenge (Mughini‐Gras et al., 2018a). Also, clustering of isolates due to genome similarity may not necessarily indicate a common origin or a transmission link. For example, strains of Salmonella Bovismorbificans with highly conserved genomes have been found both in human cases and in host populations with unexplained relatedness (Bronowski et al., 2013). In summary, despite the advantages of the highly discriminatory nature of WGS for the investigation of transmission links, to which host‐adaptation studies may be highly relevant, genetic associations between isolates must still be critically interpreted and complementary epidemiological data must be accounted for whenever available.
3.3.2. Source‐attribution
WGS‐based typing offers many possibilities for subtype discrimination depending on the methods applied (i.e. MLST, cgMLST, wgMLST or SNP profiles) and allows various modelling choices, which offers the opportunity for evaluating a combination of approaches. However, this might complicate the selection of the most accurate output (Møller Nielsen et al., 2017; Thépault et al., 2018). The development of source attribution modelling approaches that can accommodate WGS data has been challenged by the issue of defining the optimal discrimination level that reflects the appropriate degree of pathogen‐clonality and pathogen–host association (Mughini‐Gras et al., 2018a). Furthermore, different modelling approaches can accommodate different levels of subtype discrimination (Møller Nielsen et al., 2017). This is related to the model structure and the number of predictor variables it can accommodate, and it is dependent on the level of between‐source and within‐source genetic variation that each model can cope with.
The underlying principle of frequency‐matching models, which depend on source‐exclusive indicator subtypes, can be expected to be challenged when WGS‐based typing results in a higher number of subtypes that are found in humans but not in the animal reservoirs. The occurrence of a large number of subtypes exclusively among isolates from humans presumably leads to a higher non‐attributable fraction of human cases. The traditional frequency‐matching models have nevertheless been shown to be possibly applied with WGS data (AMR genes, ST, MLST, cgMLST, SNP) in the source‐attribution of L. monocytogenes (Møller Nielsen et al., 2017) and ESBL‐producing and pAmpC‐producing E. coli (Mughini‐Gras et al., 2019).
Machine learning algorithms recognise patterns in large and complex data sets, which can be used for prediction of specific outcomes. The ability to deal with large data sets including a complex mix of predictor variables makes this an attractive choice to analyse WGS data (Mughini‐Gras et al., 2018a). In an empirical fashion that approximates the existing frequency‐matching approaches, in the context of source‐attribution, the algorithms identify host‐associated genetic markers that enable an accurate attribution of individual isolates to the reservoir of origin. Additionally, machine learning methods may be enhanced by a step of data dimensionality reduction, i.e. genetic markers with highest host specificity are identified and subsequently used in the attribution of human isolates to animal sources, and those with low host specificity are discarded. Due to the availability of WGS data from all Salmonella isolates found as part of the Salmonella surveillance for animals, food and humans in Denmark, in 2017 the traditionally used frequency‐matching Hald model was substituted by a supervised classification machine‐learning model using cgMLST (Anonymous, 2018), which included a step of dimensionality reduction. In another study, major S. Typhimurium outbreaks were retrospectively attributed to the correct source with a machine learning model, and 50 key genetic markers for attribution were identified (Zhang et al., 2019).
Data dimensionality reduction represents a breach in the strict use of established isolate profile standards, such as MLST. Such an approach may eventually lead to new insights into the identification of alleles that confer specific host‐adaptation in food‐borne pathogens (Zhang et al., 2019), and hence help improve the accuracy of source‐attribution studies. Another, less empirical, example of dimensionality reduction of WGS data that may enhance source‐attribution accuracy is comparative genomic fingerprinting, especially useful if the pathogen population has high genetic diversity, weak clonality, and high levels of intraspecific recombination, e.g. C. jejuni I (Taboada et al., 2012). In a comparison of source‐attribution of C. jejuni using 7‐loci MLST to source‐attribution using presence/absence of 40 genes belonging to the accessory genome (determined by Taboada et al., 2012) or 15 host segregating markers (determined by (Thépault et al., 2017)), the host segregating markers provided the most accurate predictions, especially with chicken isolates, suggesting that MLST‐based source‐attribution may underestimate the role of chicken in Campylobacter transmission to humans (Thépault et al., 2017).
While dimensionality reduction has the potential to lead to new insights on host‐adaptation markers, it may also be seen as a drawback and must be applied with caution. Filtering full genetic profiles down to a subset of markers, exclusively based on their predictive value for source, may potentially lead to model over fitting. Additionally, in case of random empirical dimensionality reduction, this approach may confound the identification of true host‐associated markers. Furthermore, variable selection and subsequent source‐attribution may be affected by the balance of the data set, which is rarely possible to achieve. Violations of this assumption can lead to incorrect inference regarding the origin of isolates, and to biased source attribution results.
Population genetic models may help identify elements associated with host adaptation and can identify the epidemiological relatedness of isolates. Models of population structure assume that an individual originates from a single population (no‐admixture model) or that it carries alleles from multiple populations (admixture model) and that the number of underlying populations in a given data set is fixed. Several methods have been developed including (Falush et al., 2003; Pritchard et al., 2000) and BAPS (Corander et al., 2003, 2008; Corander and Marttinen, 2006). A different approach is the Asymmetric Island model (Wilson et al., 2008). This method, specifically designed to work on MLST data and not on WGS data, models the non‐random association of alleles of different loci in the source populations (linkage disequilibrium) and estimates the relative contribution of each putative source population to the sequences of unknown origin. Traditional models have been applied with WGS data. Møller Nielsen et al. (2017) demonstrated how different traditional population genetic models (Asymmetric Island model, STRUCTURE) could cope with genetic profiles of different resolution, using L. monocytogenes WGS data and Thépault et al. (2017) applied the STRUCTURE model with WGS data from Campylobacter.
The success of WGS data application in existing population genetic models depends on the level of discrimination in the data and the model appropriateness. For example, the Asymmetric Island model (Wilson et al., 2018) was originally developed for conserved, slowly evolving genes from the core‐genome. It is therefore appropriate for MLST data, and inappropriate for fast‐changing, highly variable genetic markers (Mughini‐Gras et al., 2018a). As alternatives to the traditional versions of the existing models, several evolutions of those models have been developed, such as hierBAPS (Cheng et al., 2013), fastSTRUCTURE (Raj et al., 2014) fastBAPS (Tonkin‐Hill et al., 2019) and PopPUNK (Lees et al., 2019). These methods are specifically designed for accounting for the increase of the size of the data set used with the advent of WGS.
In summary, WGS data may be applied with traditional source attribution modelling approaches, depending on the model considered and the discriminatory level of the genetic profiles at hand. Several adapted modelling alternatives targeted to the use of WGS have recently emerged, both as evolutions of existing population structure models and as the empirical alternative to frequency matching models (machine learning algorithms). Nevertheless, there is in general a lack of benchmarking exercises for the different modelling approaches available.
3.3.3. Concluding remarks
WGS‐based source‐attribution is expected to enhance the identification of transmission pathways.
WGS‐based host‐adaptation studies support source‐attribution by identifying genetic signatures of association with specific hosts, while unravelling the genetic basis of microbial evolution.
WGS facilitates, due to its high discrimination potential, new considerations in source‐attribution modelling, such as the incorporation of spatiotemporal factors and multidirectional transmission.
Traditional source‐attribution approaches can be applied using WGS data, but at varying discriminatory levels (e.g. cgMLST, wgMLST, SNP), depending on the specific model and the genomic diversity of the pathogen.
The rapid increase in WGS use in food microbiology and public health has facilitated the development of new source‐attribution modelling approaches, adapted to the size and characteristics (e.g. discriminatory level) of WGS data. Several alternatives to traditional approaches are available, especially using population structure models.
Machine‐learning can be applied for source‐attribution using WGS data.
Source‐attribution approaches that involve data dimensionality reduction are expected to lead to the identification of alleles that confer specific host‐adaptation. However, caution must be taken when applying dimensionality reduction to avoid model over fitting.
WGS‐based source attribution should ideally also be complemented by epidemiological data and still depends on systematic, harmonised, representative and balanced data collection for all putative transmission sources and human cases. Studies are needed to define sampling strategies that ensure statistical power and representativeness.
There is a lack of benchmarking studies to assess the performance of the different available modelling approaches that are using WGS data.
3.4. WGS in microbial risk assessment
Risk assessment, understood as the scientific evaluation of known or potential adverse health effects resulting from human exposure to food‐borne hazards, consists of the following steps:
Hazard identification, which involves the identification of the agents capable of causing adverse health effects and which may be present in a particular food or group of foods.
Hazard characterisation, which involves the qualitative and/or quantitative evaluation of the nature of the adverse health effects associated with the hazards present in the food. For hazard characterisation, a dose–response assessment should be performed if data are available.
Exposure assessment, which involves the qualitative and/or quantitative evaluation of the likely intake of the hazards via food as well as through exposures from other sources if relevant.
Risk characterisation, which involves the qualitative and/or quantitative estimation, including attendant uncertainties, of the probability of occurrence and severity of known or potential adverse health effects in a given population based on hazard identification, hazard characterisation and exposure assessment.
3.4.1. Hazard identification
The hazard posed by food‐borne microorganisms may be assessed by WGS‐based on their pathogenic characteristics (Wright et al., 2016). Additionally, bacterial phenotypic characteristics, such as host adaptation, response to stresses prevailing in foods or in the host, and, in some cases, AMR, also influence the risks estimated in MRA (Ronholm et al., 2016). As a consequence, WGS represents a major benefit for a more targeted risk assessment, no longer focused at the species/genus level but at the level of strains/subtypes characterised by genetic markers or combinations thereof encoding for characteristics leading to an increased probability of persistence throughout the food chain and/or to serious adverse health effects, thereby leading to a high risk of infection or disease.
However, the realisation of this benefit depends ultimately on the ability to predict phenotypes from WGS data, which can be translated into a measure of risk. In many cases, phenotypic and functional information related to genetic markers is missing and the databases including virulence markers are far from complete. This genotype to phenotype prediction may also be influenced by variations in the expression of genes under different conditions (Hung et al., 2019).
Variability of virulence profiles among strains of one pathogen informs hazard identification by allowing targeting the risk assessment for epidemiologically relevant pathogen–food combinations. High‐risk pathogenic strains can be identified based on the presence of high‐risk phenotypic properties, such as virulence potential, but also persistence, or growth/survival under stress conditions prevailing in food or the host. WGS offers the possibility to perform comprehensive virulence profile typing, and to identify the link between genome markers and those phenotypic properties, by means of comparative genomics studies or genome‐wide association studies (GWAS). GWAS compare a large set of genomic data and associate them to specific phenotypic traits, allowing for the identification of genomic sequences as markers or indicators of specific phenotypes (Rantsiou et al., 2018).
The public health importance of the variability in virulence profiles in populations of food‐borne pathogens has been previously demonstrated. For example, among the diversity of all Salmonella strains, only a relatively small number of genetically related strains are associated with human disease (Allard et al., 2013). Likewise, the comparison of the genomes of L. monocytogenes isolates originated from food and from human cases of central nervous system or maternal‐neonatal listeriosis uncovered new putative virulence factors in L. monocytogenes and allowed for the experimental demonstration (in mice) of the contribution of a specific gene cluster in neural and placental tropisms (Maury et al., 2016). Furthermore, the association of L. monocytogenes clones with different virulence potential with various food products (Maury et al., 2019; Njage et al., 2019a) and different clinical outcomes (Njage et al., 2019b) has been uncovered with the use of WGS. For STEC, associations between genetic markers and (1) adhesive properties to human intestinal cells (Pielaat et al., 2015) and (2) clinical outcomes (Njage et al., 2019b) have also been demonstrated.
The accurate identification of relevant virulence markers may in some situations be hampered by the lack of appropriate animal models for confirmatory tests (Wright et al., 2016). In addition, virulence characterisation may be transient, since pathogenicity islands can be horizontally transferred (conferring virulence in a single genetic event), gained sequentially, or can be lost (Hu et al., 2019; Montero et al., 2019; Sheppard et al., 2018). Another possible limitation is that a comprehensive phylogenetic analysis which succeeds at describing the variability in the core genome, may fail to identify accessory‐genome associated clades, and hence fail to characterise virulence variability within specific strains if this virulence is attributed to features in the accessory genome.
In addition to the virulence potential, it is important to consider the ability of food‐borne pathogens to persist, survive and grow under stress conditions prevailing in food or the host. Variability of virulence profiles is often intertwined with the variability in these phenotypic traits, with virulence reflecting the diversity of ecological niches in which the pathogen evolves (Maury et al., 2019). For example, hypervirulent clones of L. monocytogenes are often best at colonising the intestinal lumen and invading intestinal tissues, showing a better host‐adaptation, than hypovirulent clones, which are on the other hand more resilient to food processing environments, showing high stress resistance, survival and biofilm formation capacity (Maury et al., 2019).
WGS host‐adaptation studies may additionally help to differentiate the public‐health relevance of different strains of a particular pathogen, while they also allow identifying the evolution process underlying adaptation, thereby helping to characterise and understand the genomic variation encountered in the hazard of interest. Some studies have already succeeded at finding indicators of adaptation to different hosts within food‐borne pathogen populations (see Section 3.3.1). This is achieved because WGS‐based studies can provide deep insights into the ecology of bacteria (Sheppard et al., 2018), thus allowing specifically to investigate among food‐borne pathogen populations how mutation and recombination contribute relatively to genetic variation and determine genomic signatures of host adaptation. Nonetheless, factors that affect gene expression in vivo (Petersen et al., 2019; Qin et al., 2019) and epigenetics need to be considered in order to determine the true epidemic potential of host‐adapted strains. Therefore, it is desirable to complement WGS studies with the functional characterisation of the identified genomic signatures and the validation of a causal link between those signatures and host‐adaptive phenotypic traits.
The potential benefit of WGS for the characterisation of AMR during hazard identification is multifold. It includes the prediction of phenotypic AMR profiles in silico, the retrospective update of hazard identification based on newly discovered AMR genes/mutations and the possibility to describe the potential for dissemination of AMR determinants by horizontal gene transfer.
Alternatively to, or ideally complementarily to, phenotypic AMR testing, WGS allows the in silico investigation of isolates for the presence of AMR genes and mutations conferring AMR (Oniciuc et al., 2018; Su et al., 2019). Several databases are now available to help identify AMR determinants (EFSA, 2019). Databases vary in size and specificity (Martínez et al., 2015) and may therefore return different AMR profiles from the same WGS data. There is, however, evidence for the association between genotypic‐ and phenotypic‐AMR profiles (see Table 5). Such predictions allow the integration of AMR as a factor in hazard identification in MRA, even in the absence of phenotypic AMR profiling. Moreover, sophisticated approaches based on machine learning and statistical models aimed at identifying potential new resistance genes that are not yet recognised are under development (Su et al., 2019). Such types of methods have also been shown to be useful for predicting from WGS data minimal inhibitory concentrations (MICs) for several antibiotics. Indeed, Nguyen et al. (2019) were able to predict, using machine learning methodologies, MICs for non‐typhoidal Salmonella, with the developed methods having an overall average accuracy of 95%.
Table 5.
Correlation of WGS‐based genotyping of strains for AMR with phenotypic antimicrobial susceptibility testinga
| Strain | WGS analysis tool | Study design | Resultb | Reference |
|---|---|---|---|---|
| Non‐typhoidal Salmonella enterica | Genefinder; database information on point mutations for β‐lactam and fluoroquinolone resistance; acquired antibiotic resistance genes by Resfinder and Comprehensive Antimicrobial Resistance Database | 3491 strains and 52,365 phenotypic antimicrobials; strains received by Public Health England's Gastrointestinal Bacteria Reference Unit between 4/2014 and 3/2015; phenotypic data using EUCAST cut‐off values |
Disagreement: – 76 strains (2.18%) – 88 antimicrobials (0.17%); – 59 of these (67.05%) for streptomycin resistance |
Neuert et al. (2018) |
|
Salmonella (n = 50) Escherichia coli (n = 50) Enterococcus faecalis (n = 50) Enterococcus faecium (n = 50) |
Resfinder β‐lactam for E. faecium on pbp5 gene comparison |
200 strains and 3051 phenotypic antimicrobials Strains from Danish pigs phenotypic data using EUCAST cut‐off values |
Disagreement: – 7 antimicrobials (0.26%) with exclusion of β‐lactams in enterococci and ciprofloxacin and nalidixic acid in S. Typhimurium and E. coli – 6 for spectinomycin resistance in E coli |
Zankari et al. (2013) |
|
Salmonella enterica 10 serotypes (n = 50) Escherichia coli (n = 50) Campylobacter jejuni (n = 50) |
Resfinder 2.1; Pointfinder and an in‐house method (mapping of raw WGS reads) to identify chromosomal point mutations |
150 strains and 685 phenotypic antimicrobials; n‐house strain collection of Statens Serum institute, Copenhagen, Denmark; Phenotypic data using EUCAST cut‐off values |
Complete agreement for Salmonella Discrepancies: – 11 antimicrobials (1.6%) of antimicrobial tests (C. jejuni, 2 for fluoroquinolone, 2 for erythromycin and 2 for nalidixic acid; E. coli, 5 for colistin) – 9 strains (6%) (4 C. jejuni and 2 E. coli) |
Zankari et al. (2017) |
|
Salmonella (n = 125) Escherichia coli (n = 164) |
PHE Genefinder; Resfinder 2.1, SRST2 v0.1.7 | Isolates from the EU AMR monitoring programme |
Salmonella all antibiotic classes 86–90% agreement E. coli all antibiotic classes 80–82% agreement; β‐lactams 55–58%, lower degree of agreement probably due to ampC mutations not detected by the tool |
Hendriksen et al. (2018) |
| Campylobacter spp. from poultry retail meat, collected in United States | Resfinder; chromosomal point mutations in gyrA and 23S rRNA genes by BLASTX and BLASTN | 589 strains; 5301 antimicrobials; phenotypic data using EUCAST cut‐off values |
Agreement ranged from 67.9% to 100% depending on the antimicrobial tested 100% agreement for ciprofloxacin, nalidixic acid, gentamicin, azithromycin, florfenicol Disagreement: – tetracycline (1.2% for the susceptible and 1.2% for the resistant phenotype), clindamycin (0.4% for the susceptible phenotype, 100% agreement for the resistant phenotype), telithroymycin (32.1% for the resistant and 2% for the susceptible phenotype) |
Whitehouse et al. (2018) |
|
Shiga toxin‐producing Escherichia coli serogroup O157 from all three lineages and 17 phage types (n = 396) O26 (n = 34) |
Genefinder, using Bowtie 2 to map reads to a set of reference sequences and Samtools to generate an mpileup file (M. Doumith, PHE, unpublished results) |
430 strains, part of them tested for each of the antimicrobials; Strains were derived from patients with symptoms of gastrointestinal disease and/or HUS; Phenotypic data using EUCAST cut‐off values, EFSA guidance and EU Reference Laboratory Antimicrobial Resistance recommended screening guidance (http://www.crl-ar.eu/201-resources.htm#cutoff) |
Complete agreement for all antimicrobials tested: β‐lactam resistance (n resistant = 55 and n susceptible = 23) quinolone resistance (n resistant = 10 and n susceptible = 69) phenicols (n resistant = 9 and n susceptible = 70) sulphonamides (n resistant = 61 and n susceptible = 17) trimethoprim (n resistant = 31 and n susceptible = 47) tetracyclines (n resistant = 51 and n susceptible = 27) aminoglycosides (n resistant = 63 and n susceptible = 15) |
Day et al. (2017) |
|
Campylobacter jejuni n = 32 Campylobacter coli n = 82 |
In‐house database of antimicrobial resistance genes downloaded from existing databases searched with BLASTX; specific genomic mutations by alignment using the MEGA program version 5.0 |
114 strains/1026 antimicrobials; strains isolated from 2000 till 2013 from humans, retail meats and caecal samples from food production animals in the US; phenotypic data using EUCAST cut‐off values |
Complete agreement for tetracycline, ciprofloxacin/nalidixic acid, erythromycin Disagreement for gentamicin (1.3% of the resistant strains), azithromycin (1.9% of the resistant strains), clindamycin (1.9% of the resistant strains and 1.6% of the susceptible), telithromycin (2% of the resistant strains and 4.6% of the susceptible) |
Zhao et al. (2016) |
| Staphylococcus aureus | In‐house database of antimicrobial resistance genes, searched with BLASTn for known resistance determinants on the chromosome and/or plasmids | 491 human strains (202 from carriage collection and 289 strains from bloodstream collection in the UK); phenotypic testing by automated broth dilution and disc diffusion methods with EUCAST cut‐off values |
Complete agreement for vancomycin, fusidic acid, gentamicin, mupirocin, rifampin Disagreement: penicillin (0.6% of resistant strains and 5.1% of susceptible); methicillin (0.4% of resistant and 0.4% of susceptible); ciprofloxacin (1.2% of resistant and 0.2% of susceptible); erythromycin (0.8% of resistant and 0.6% of susceptible); clindamycin (2.5% of resistant); tetracycline (0.4% of susceptible); trimethoprim (1.0% of resistant and 1.0% of susceptible) |
Gordon et al. (2014) |
| Staphylococcus aureus | Comparison between Genefinder (read based), Mykrobe (de Bruijn; graph based), Typewriter (BLAST based) |
1379 human strains (UK); 14464 antimicrobials; Agar dilution method with EUCAST cut‐off values |
Disagreement: 3.7% of resistant strains; 1.2% of susceptible strains; no big differences between the 3 methodologies: 0.23% for Typewriter in comparison with the other two, 0.16% for Mykrobe and 0.16% for Genefinder.: 0.3% differences on acquired resistance genes and 0.1% on chromosomal mutations |
Mason et al. (2018) |
The presented results are based on the literature search performed within the remit of the Opinion and is not a guarantee for completeness.
The results are expressed in disagreement meaning the % discrepancies; the agreement is 100% – % discrepancies; no ambiguous results are reported for AMR resistance.
The accumulation of genomes sequenced by laboratories creates a valuable data resource for the screening of AMR determinants deposited in databases. Newly discovered resistance genes can be immediately scanned against a repository of genomes, possibly elucidating how long the new marker has been circulating and what kind of bacterial subtypes are affected in clinical, veterinary and food settings. A prominent example of this application of WGS was the global concerted investigation of the mobilised colistin resistance (mcr) genes (Lima et al., 2019; Liu et al., 2016). Worldwide reports based on the bioinformatics search for mcr‐1 in genomes appeared very quickly after its first description in Southern China, showing the worldwide spread of the gene (Sun et al., 2018). The results of such retrospective investigations can contribute to update WGS‐based hazard identification in previous risk assessments, which would be difficult on an AMR phenotype‐based hazard identification scenario. The production of WGS data can also contribute to the development of molecular detection methods for these resistant microorganisms (Rebelo et al., 2018).
Bacteria contain extremely efficient genetic transfer systems capable of exchanging and accumulating AMR genes. Resistance genes can move between chromosomal and extra‐chromosomal DNA elements, and they may move between bacteria of the same or different species or to bacteria of different genera by horizontal gene transfer. The most important vehicles for transfer of resistance genes in bacteria are mobile genetic elements, such as plasmids, transposons, integrons, gene cassettes and genomic islands (Partridge et al., 2018). The identification of plasmid characteristics through plasmid profiling (i.e. plasmid replicon characterisation or Inc typing), and their association with different bacterial hosts provides important information to understand the transmission of AMR genes through these highly mobile extrachromosomal DNA elements (Rozwandowicz et al., 2018). To understand the transmission dynamics and the stability of AMR determinants in different bacterial hosts and environments the genetic characterisation of mobile genetic elements is important. WGS provides the possibility to characterise such complex genome structures in an efficient way. For example, using WGS, multiple mobile AMR elements for the mcr‐5 resistance gene could be easily detected and fully characterised, even differentiating between their location on a plasmid or on the chromosome within a host (Borowiak et al., 2017, 2019). The parallel identification of AMR genes and related mobile genetic elements contributes to a more precise hazard identification, by describing not only the AMR profile of the pathogen but also the potential for dissemination of AMR genes to commensal gut bacteria. WGS also showed added value allowing to elucidate the role of ICE (integrative conjugative elements) in the dissemination of carbapenemases (Botelho et al., 2018a).
Nevertheless, genotypic AMR profiling is not without its limitations. There are specific types of resistance that seem to be more difficult to detect via WGS‐based methods, such as spectinomycin resistance in E. coli and some carbapenem resistance in Enterobacteriaceae or in Pseudomonas aeruginosa (Ronholm et al., 2016). Additionally, genes and mutations responsible for novel resistance mechanisms must first be identified before they can be added to the available databases, which means that there will be a delay between the initial identification of a new AMR mechanism and the possibility for it being detected via WGS. Furthermore, the high homology level between some AMR genes poses a challenge to the interpretation of the annotation results, and hits against an AMR database have therefore a certain level of uncertainty associated. Finally, since most WGS strategies utilise short read sequencing platforms, it is currently difficult to perform plasmid reconstruction, resulting in fragmented plasmids and affecting the sensitivity of the detection of some resistance genes (Robertson and Nash, 2018).
A more detailed analysis of the strengths, weaknesses, opportunities and threats of using WGS for AMR monitoring is provided in the answer to ToR2, under Section 3.7.4.
3.4.2. WGS in other steps of microbial risk assessment
A risk assessment comprises more steps than the aspects of hazard identification described in Section 3.4.1. Here the opportunities offered by WGS for hazard characterisation, exposure assessment and risk characterisation are discussed based on recent developments in the field. These future perspectives are also summarised in Figure 2.
Figure 2.

Future perspectives for WGS to add value to microbial risk assessment
3.4.2.1.
Hazard characterisation
Integration of WGS in MRA, and its combination with phenotypic data (Pielaat et al., 2016), is expected to lead to revise current dose–response models, resulting in assessment of more targeted pathogen–human interactions (Kovac et al., 2017). For this purpose, the identification of virulence markers is crucial in order to account for variability in hazard characterisation (Chen et al., 2006, 2011), since virulent strains may have a higher probability of causing food‐borne infection and different strains may cause different clinical outcomes. However, expression of virulence genes may be affected by several environmental conditions along the food chain and within a colonised human, and therefore WGS should ideally be complemented with data generated using phenotypic tests (Pielaat et al., 2016) and other relevant methodologies (e.g. transcriptomics, proteomics and/or metabolomics) in order to identify markers effectively associated with critical phenotypic traits in bacteria involved in increased disease probability and severity.
Accounting for the virulence profiles in hazard characterisation is particularly important for STEC infections, as it is known that clinical outcomes vary significantly and are dependent on the presence of specific combinations of virulence genes (Persson et al., 2007; Dallman et al., 2015; Byrne et al., 2018). Health endpoints resulting from STEC infection can be also predicted from WGS data. In the study by (Njage et al., 2019b) accessory genes were used as predictors of health outcomes (diarrhoea, bloody diarrhoea, haemolytic uremic syndrome and a combination of these) and their severity, and genetic markers associated with more serious outcomes were identified, including proteins involved in initial attachment to the host cell, persistence of plasmids or genomic islands, conjugative plasmid transfer and formation of sex pili.
Some studies have already succeeded in the use of WGS for the investigation of genes associated with virulence and the improvement of hazard characterisation, especially with listeriosis. In the study by Fritsch et al. (2018), each of three classes of L. monocytogenes according to their virulence potential was associated with a different dose–response model. The risk assessment showed that uncommon high virulent strains were responsible for the majority of human cases. Similarly, in the study by (Njage et al., 2019a), several virulence genes of L. monocytogenes were identified as important predictors of higher frequency of illness. So far, the listeriosis case is the only example where dose response models have been adapted to the use of WGS data. Extending this example to other food‐borne pathogens could be challenging.
Exposure assessment
Different subtypes within a given bacterial species often show distinctive behaviours, such as various abilities to grow or survive under conditions prevailing during food processing and distribution. In this regard, WGS can be used to identify and to track markers useful for predicting microbial behaviour in foods, often through GWAS.
WGS can be used to predict the ability of a microorganism to grow or survive within the host or the food, as well as during processing, storage and distribution of foods. For example, (Fritsch et al., 2019) conducted a GWAS study where a number of genes and SNPs, as well as specific phylogenetic sublineages, were identified as associated with L. monocytogenes growth at low temperature (2°C). Through the estimation of the growth and survival potential of a given hazard, WGS can predict the probability that it will be transmitted from one step of the food chain to the next, when developing exposure assessment models. Models would in this case be build using genetic markers as input, next to phenotypic characteristics, such as for instance minimum growth temperature or growth pH (den Besten et al., 2018). In a similar fashion, as WGS can provide detailed information on the genetic background of identified AMR or virulence determinants, its use can facilitate the prediction of horizontal transfer events of AMR‐ or virulence‐related genes in the exposure assessment step (Collineau et al., 2019).
Exposure assessment is therefore expected to benefit from WGS due to (i) a more precise hazard identification allowing to focus the exposure assessment on specifically important pathogen–food associations, and (ii) the possibility of identifying biomarkers responsible for strain variability regarding growth potential or resistance to stress conditions in the food chain. Hence, the developed models can be targeted to particular exposure scenarios.
Another advantage of WGS for exposure assessment is the possibility of comparing genomic profiles at higher resolution respect to other typing methodologies between human clinical isolates and isolates collected along the exposure pathway, which may help identify causal links of exposure. In a recent study in Norway, antimicrobial resistant E. coli clinical isolates from humans with bloodstream infections were compared at the molecular level to resistant strains isolated from meat and meat products produced during the same time period (Sunde et al., 2015). The occurrence of similar multiresistance plasmids was detected in isolates from pork and a distantly related strain from a human with septicaemia, suggesting a possible role of meat as a source of AMR determinants for pathogenic E. coli strains. WGS data showing a similar AMR profile in E. coli isolated from ruminants and domestically acquired human clinical STEC indicate transmission of antimicrobial resistant E. coli from animals or the animal environment to humans, (Day et al., 2017). In another study, the L. monocytogenes genetic markers most contributing to human disease were mainly prevalent among strains from ready‐to‐eat, dairy and composite foods (Njage et al., 2019a).
Risk characterisation
Risk characterisation is expected to benefit from WGS as a consequence of its implementation in the previous risk assessment steps – hazard identification, hazard characterisation and exposure assessment.
In general terms, WGS‐based developments are expected to make it easier for risk assessors to focus on strains or subtypes of high public health relevance, or to group hazards into risk categories with similar genetic profiles and estimated phenotypic behaviour, advancing to a subtype‐ or strain‐based risk assessment approach. This will allow capturing the existing variability while decreasing the assessment uncertainties due to the existing variability in important characteristics like virulence, growth potential, etc., within the hazard.
The potential of WGS to refine quantitative microbiological risk assessment (QMRA) has recently been illustrated in the study of (Fritsch et al., 2018) where the previously developed QMRA for the assessment of the number of listeriosis cases associated to cold‐smoked salmon in France was updated with information on the characteristics of different clonal complexes of L. monocytogenes, including the identification of genetic markers for the ability of strains to grow at low temperatures and for their virulence potential. The results showed that uncommon highly virulent strains and strains with a low minimal growth temperature were responsible for the majority of predicted human cases.
The main challenge remaining for a successful tuning of risk characterisation with WGS is that small genetic variations may result in large phenotypic differences among strains, and hence high levels of genome similarity do not always imply similar behaviours in the food chain or similar virulence or AMR in the host (Franz et al., 2014).
To sum up, WGS has the potential to deal with strain variability, allowing to fine tune the hazard identification, and the dose–response and exposure models used in MRA. In addition, it may allow risk managers to prioritise hazards more accurately in risk ranking exercises (Cocolin et al., 2018; Haddad et al., 2018). However, some challenges for its application remain and will likely require its combination with phenotypic data obtained using conventional methods and data generated using other –omics techniques such as proteomics, transcriptomics and metabolomics. Also, important data needs will remain, e.g. related to food processing parameters and the variation therein, as well as to hazard prevalence and (variability in) concentration. Finally, the implementation of WGS in MRAs will require the evolution of the currently available toolbox of risk assessment methodologies, with the need to develop risk assessment modelling approaches specifically fitted to the use of WGS data.
3.4.3. Concluding remarks
Microbial risk assessment based on WGS data will be able to utilise information on strain variability based on several genetic markers, and this is expected to allow fine tuning of hazard identification, exposure assessment models and dose–response models. Achieving this will require future developments in risk assessment tools and modelling approaches, which will need to be specifically fitted to the use of WGS data.
WGS‐based host‐adaptation studies are expected to help differentiate the public‐health relevance of different strains. The identified genomic signatures should undergo functional characterisation to validate the causal link between the ignature and the host‐adaptive phenotypic trait.
Integrating genetic information on AMR in MRA will advance the knowledge on the spread of resistant bacteria and resistance determinants within and between sectors (humans, animals both domestic and wild, plants/crops, or the environment).
WGS‐based virulence profiling supports hazard identification, by allowing targeting the risk assessment to the most epidemiologically relevant pathogen–food combinations. In addition, it is expected to also facilitate hazard characterisation, by taking into account in dose–response modelling the interstrain variability in virulence potential and, therefore, in health outcomes.
Genetic markers for stress resistance and growth/survival under different scenarios depict the variability in the behaviour of different strains along the food chain, which are expected to help fine‐tuning exposure assessment models.
The integration of WGS in MRA, based on its combination with phenotypic data and data generated using other relevant methodologies (e.g. transcriptomics, proteomics and/or metabolomics) is expected to lead to the development of more targeted MRA. This may be realised by allowing the identification and tracking of genetic markers of stress resistance, host‐adaptation, AMR and virulence.
3.5. Metagenomics in food‐borne outbreak detection/investigation
The investigation of food‐borne outbreaks is normally supported by using many different culture‐dependent laboratory methods, such as serotyping, resistance or virulence profiling, phage typing, typing through classical molecular methods (e.g. pulsed field gel electrophoresis or MLST) or, more recently, through WGS for the identification of the causative agent. These methods always require the previous isolation of the suspect causative agent and are often laborious and time consuming, requiring at least several days until a complete characterisation is available. In addition, classic outbreak investigation methods are targeted, being focused on particular microorganisms, while it has been reported that in a significant number of cases (e.g. up to 80% of diarrhoeal stool samples from infants and young children) it is not possible to find the causative agent by conventional diagnostics (Vernacchio et al., 2006). Metagenomic methodologies and, in particular, shotgun metagenomics have the potential to overcome most of these limitations, since they can identify any kind of microorganism in many sample matrices, including foods and faeces. However, the use of metagenomics for investigation of outbreaks is still at an experimental stage and detection sensitivity for minor components of the microbial population can be low.
Shotgun metagenomics can be a powerful tool to detect and trace food‐borne pathogens throughout the food chain, and therefore may have potential to be implemented in programmes focused at identifying and typing biological hazards. Some recent practical experiences have demonstrated that metagenome assembly or short read alignment‐based bioinformatics analyses of shotgun metagenomics data can accurately and rapidly detect pathogenic strains in food products and clinical samples, being able to achieve strain‐level resolution, which is usually necessary for the accurate identification of pathogenic microorganisms in clinical specimens or food samples (Table 1). Thus, for instance, shotgun metagenomics has been successfully used for the detection and characterisation of pathogenic E. coli and K. pneumoniae in a subset of nunu (Ghanaian fermented milk) samples (Walsh et al., 2017), Shiga toxin‐producing E. coli in spinach samples (Leonard et al., 2015, 2016), or L. monocytogenes in ice cream samples linked to a listeriosis outbreak (Ottesen et al., 2016). It is a convenient, culture‐independent alternative for the detection of non‐culturable microorganisms (Nayfach et al., 2019), and difficult‐to‐culture or fastidious bacterial pathogens (Kawai et al., 2012). It is also an asset in the investigation of diverse populations of pathogens, which are common in pre‐harvest environments, (Wright et al., 2016), and it offers the opportunity to recover whole genome sequences of unknown microorganisms (Nayfach et al., 2019; Pasolli et al., 2019). Furthermore, it facilitates investigation of the existence in the microbiota of indicator microorganisms for the occurrence of specific pathogens (Salaheen et al., 2019). It can also be a useful technology for the investigation of cases of infection or outbreaks of unknown aetiology or with multiple causative agents (i.e. mixed infections). In addition, it offers the opportunity for performing a rapid preliminary typing and characterisation (i.e. serotyping, MLST typing, identification of resistance genes and virulence traits) of the involved microbial agent(s). It is important to note that the use of shotgun metagenomics for pathogen detection could be faster than traditional culture‐based methods and could potentially be used for more high‐throughput testing.
Table 1.
Use of metagenomics in food‐borne outbreak detection/investigation
| Features | Examples (references) | Observations |
|---|---|---|
| Identification of outbreaks with unknown aetiology | Joensen et al. (2017) |
|
| Identification of difficult‐to‐culture pathogens | Nayfach et al. (2019) |
|
| Identification of food‐borne outbreaks involving multiple causative agents and/or differentiation of cases caused by closely related agents | Huang et al. (2017) |
|
| Possibility to carry out immediate preliminary typing of the outbreak causative agent | Loman et al. (2018) |
|
| Limited sensitivity of metagenomics | Andersen et al. (2017) |
|
| Loman et al. (2018) |
|
|
| Joensen et al. (2017) |
|
|
| The application during routine diagnosis and surveillance may be challenging due to the lack of harmonised methods and other methodological constraints | Huang et al. (2017) |
|
| Results obtained may strongly depend on the wet laboratory methods, sequencing technology and bioinformatics pipelines/approaches used | Knudsen et al. (2016), Li et al. (2018) |
|
| Li et al. (2018), Albertsen et al. (2015), (Li et al., 2018) |
|
|
| Head et al. (2014) |
|
|
| Goodwin et al. (2016), (Liu et al., 2016) |
|
|
| Martínez et al. (2015) |
|
|
| Identification of unknown microorganisms | Nayfach et al. (2019), Pasolli et al. (2019) |
|
| Identification of target genes | Lanza et al. (2018) |
|
| Identification of associations between pathogens′ occurrence and microbiota composition | Salaheen et al. (2019) |
|
Bin: partial genome of an organism obtained after assembly of raw sequence reads into contigs and clustering of the contigs that belong together.
Specific bioinformatic pipelines have been designed to reconstruct the whole genome of strains of interest from raw metagenomics reads. Metagenomic data can be analysed on an assembly basis or on a read basis. (Quince et al., 2017) provided an overview of the strengths and weaknesses of both approaches and recommended that both were used in parallel whenever possible, for complementation and validation. While read‐based analysis provides useful information on the occurrence of particular taxa or genetic determinants in a given sample, assembly based analysis allows in addition the recovery of genomes. When a metagenome is de novo assembled, each sequence read is put into overlapping subsequences of a fixed length k, or contigs. It is then possible, through contig binning, to group thousands of contigs into species (Quince et al., 2017). Metagenomics assembly is hence a bioinformatics approach that aims to assemble microbial genomes directly from the metagenomics data (Tyson et al., 2004; Lin and Liao, 2016) and with binning it is possible to segregate assembled sequences to putative taxa or even strains. Binning can be supervised (mapping against a reference database of already sequenced genomes) or unsupervised (reference‐free) (Narayanasamy et al., 2016). Since many assembled contigs belong to genomes from uncultivated bacteria, supervised binning results in many assembled genomes being unmapped. Reference free clustering has demonstrated the potential to identify new unknown genomes from a complex microbial sample such as the human gut microbiome (Nayfach et al., 2019; Pasolli et al., 2019). For improved assembly several approaches have been suggested. Genomic signatures which are characteristic for individual species or strains are used, such as DNA methylation profiles (Beaulaurier et al., 2018). A recently developed technique cross‐links DNA sequences that are in close physical proximity within intact cells before library preparation and metagenomics shotgun sequencing (Beitel et al., 2014; Burton et al., 2014). The so called HI‐C method has been proven useful on metagenome bovine rumen content samples enabling to draft 913 near‐complete bacterial and archaeal individual genomes (Stewart et al., 2018). Co‐assembly and co‐binning (binning and assembly using more than one sample from the same individual/environment, typically collected in longitudinal studies) have also shown to increase the number of genomes assembled when a moderate number of samples from the same individual were available (Pasolli et al., 2019).
Finally, while shotgun metagenomics has shown limitations regarding sensitivity and specificity (misattribution of detected sequences) of pathogen detection (Loman et al., 2013; Andersen et al., 2017; Joensen et al. 2017), targeted metagenomics, i.e. the use of a targeted sequence capture platform, may help overcome these limitations, and it has been recently successfully applied for the targeted analysis of resistomes (Lanza et al., 2018).
Although having the potential to decrease detection time, the use of shotgun metagenomics to detect bacteria is met with some concerns:
The first is the detection of DNA instead of detection of a viable organism (Bergholz et al., 2014). Since DNA can originate from both dead and alive cells, this may be perceived as a shortcoming in the context of outbreak investigation. Some measures can be taken to reduce this problem. For example, a study reported that treating Gouda cheese with the DNA intercalating agent propidium monoazide (PMA) prior to DNA extraction enhanced the amplification of the intact DNA while inhibiting the amplification of DNA originated from membrane damaged cells (Erkus et al., 2016). However, this can also reduce the detection sensitivity for live cells (Takahashi et al., 2018). However, the detection of pathogens in a non‐viable state is as much an opportunity to prompt source‐tracking investigations as is its detection in a viable state. Moreover, shotgun metagenomics could be used to detect viable but non‐culturable (VBNC) bacteria, which represent a challenge for surveillance using traditional food microbiology analytical methods.
The limited sensitivity of the technology for the detection of microorganisms is an important limitation to overcome. In general, studies report a limited sensitivity, with limits of detection of about 104–105 CFU/mL (e.g. 7.75 × 10⁴ CFU/mL for Campylobacter in clinical faecal samples (Huang et al., 2017), although this can be improved after an enrichment step, as shown by Leonard et al. (2016) which achieved strain‐level identification of STEC in spinach initially contaminated at concentrations of ˜ 0.1 CFU/g. Nevertheless, the introduction of an enrichment step can also bias metagenomic detection towards easy‐to‐culture or fast‐growing species. The sensitivity may be particularly relevant when analysing suspect foods, where pathogen numbers are likely low. In clinical specimens, higher pathogen numbers are expected.
There are barriers to the use of metagenomics for the identification and quantification of pathogens for regulatory purposes due to the possible occurrence of misclassifications inherent to the sequencing technology. This is related to the challenge of getting deep coverage of the pathogenic organisms in the sample due to the existence of other prokaryote and eukaryote organisms within the sample and also because of the incompleteness of bacterial genome databases (Yang et al., 2016).
Regarding the analytical approach, it has been shown that results strongly depend on the choice of wet laboratory methods and bioinformatics pipelines (Clooney et al., 2016). Shotgun metagenomics results are also challenging to interpret (Quince et al., 2017) due to the fact that the effect size of sample processing steps can be greater than the effect size of a variable of interest (e.g. food source) – for example, the possible contamination of low‐biomass samples and the choice of the DNA extraction method may impact the microbial composition of the sample (Salter et al., 2014).
Additionally, there is the concern that fewer isolates for archiving and further study will be obtained from food‐borne illness patients with the transition to culture‐free diagnostic methods.
3.5.1. Concluding remarks
The use of metagenomics for outbreak investigation is still at an experimental stage.
The use of metagenomics for outbreak investigation can facilitate the detection of outbreaks with unknown aetiology and/or caused by non‐culturable, difficult‐to‐culture or fastidious bacterial pathogens. It can also aid the detection of cases of infection where multiple causative agents are involved (i.e. mixed infections).
Metagenomics offers the opportunity to recover whole genome sequences of microorganisms present in the specimen. Therefore, it may facilitate performing a rapid preliminary typing and characterisation of the involved microbial agent(s). However, the assignation of particular genetic determinants to the outbreak causative agent(s) is technically challenging and in most cases cannot be successfully achieved yet.
Some methodological constraints (e.g. the lack of harmonised methods, the low sensitivity for detection, limitations related to specificity or the fact that results obtained strongly depend on the choice of wet laboratory methods, such as sample size and DNA isolation methods), and the choice of bioinformatics pipelines represent a challenge which would need to be overcome for the application of metagenomics during routine diagnosis and surveillance.
3.6. Metagenomics in source attribution, hazard identification and in other steps of microbial risk assessment
WGS has been already successfully implemented for source‐attribution using several population genetic models (see Section 3.3.2). Metagenomics offers particular challenges regarding the accurate characterisation of pathogens in a sample. Therefore, more empirical models, i.e. models that do not attempt to determine the population structure of the pathogen, may offer an alternative solution to the integration of metagenomics in source‐attribution modelling. Machine learning algorithms applied to metagenomes originating from humans and from different sources to identify clusters of source‐specific genetic markers offer a promising approach. The potential of such a source‐attribution approach has been recently demonstrated by Gupta et al. (2019), who could distinguish distinct aquatic environments based on their resistome profiles, by applying an extremely randomised tree algorithm to identify discriminatory resistance genes. The method has been validated through the use of in silico generated data. Metagenomic data from different food‐producing animal reservoirs becomes increasingly available (Munk et al., 2018), offering the opportunity to develop and explore new source‐attribution approaches for metagenomics.
In relation to hazard identification, as already mentioned under Section 3.5, metagenomics offers the possibility to produce in some cases consensus draft genomes of the strains of interest which would allow for a very rapid characterisation (virulence and AMR repertoire, among others) of the pathogenic strains present in a sample. For example, metagenomic sequencing of sewage has recently been suggested as a means of monitoring the occurrence of AMR genes in the general human population (Hendriksen et al., 2019b) and, in fact, AMR occurrence in wastewater treatment plants has been shown to mirror the clinical prevalence of phenotypic resistance in several bacterial species (Pärnänen et al., 2019).
Shotgun metagenomics provides information on the complete pool of microbial genes from a particular sample, and therefore can be used to infer the full repertoire of resistance determinants within such sample, although depending on the approach those determinants might not be assigned to particular taxa and it is still difficult to obtain information on the AMR determinants harboured by specific bacterial strains. The pool of AMR determinants within a sample, the so‐called resistome, has been studied using shotgun metagenomics in several practical experiences carried out in food‐related settings (Table 2).
Table 2.
Scientific articles characterising the food chain resistome through shotgun metagenomics
| Reference | Type of sample | Databases used | Main findings |
|---|---|---|---|
| Noyes et al. (2016) | Samples from different points of the beef production chain | Master, non‐redundant database constructed using Resfinder, ARG‐ANNOT and CARD |
|
| Pitta et al. (2016) | Samples from animal faeces, manure, and soil samples collected from five dairy farms | Antibiotic Resistance Genes Database (ARDB) |
|
| Noyes et al. (2016) | Samples from dairy and beef production effluents | Master, non‐redundant database constructed using Resfinder, ARG‐ANNOT and CARD |
|
| Zhou et al. (2016) | Faeces and soil samples obtained from dairy farms | Antibiotic Resistance Genes Database (ARDB) |
|
| Munk et al. (2017) | Samples from integrated slaughter pig herds | ResFinder |
|
| Weinroth et al. (2018) | Bovine faecal samples during a clinical trial using ceftiofur and chlortetracycline | MEGARes |
|
| Munk et al. (2018) | Samples from pig and poultry farms | ResFinder |
|
| Auffret et al. (2017) | Ruminal digesta samples | ARG‐ANNOT |
|
| Hendriksen et al. (2019b) | Untreated urban sewage from 79 sites in 60 countries | ResFinder |
|
The main advantages of shotgun metagenomics over classical methods for analysing the resistome is that this methodology is faster, allows for the simultaneous detection of a vast number of resistance genes of different microbial origins within a given sample and the estimation of their relative abundance, and in some cases it is possible to get important information on the genetic background of the detected AMR determinants (microbial species or strain of origin and/or association with mobile genetic elements, such as plasmids, integrons, transposons, prophages, etc.). In fact, shotgun metagenomics can be also used to characterise the so‐called mobilome (pool of mobile genetic elements) in a given sample (Ravi et al., 2017). However, the attribution of the identified resistance genes to specific taxa or strains and their identification as transferable or non‐transferable resistance determinants is not possible in most cases yet, which would hamper the assessment of the risk posed by such AMR determinants. Recent developments in long‐read sequencing technologies may nevertheless provide the opportunity for increasing the resolution of AMR genes, enabling precise information on their location within mobile genetic elements or host strains to be obtained, as has been recently demonstrated in some pilot studies (Charalampous et al., 2019; Che et al., 2019).
In addition, with shotgun metagenomics, due to the long‐term storage of sequencing data, it would be possible to re‐analyse previously sequenced metagenomes in function of new emerging antibiotic resistance determinants and to link the occurrence of AMR genes with metadata available from the sample, allowing an increased understanding of the emergence and transmission routes of AMR in foods and other components of the food chain and facilitating the detection of new sources of AMR which can then affect AMR in food production animals and in food.
An important issue with monitoring of AMR through shotgun metagenomics is that the results of the analyses will greatly depend on the quality of the AMR databases used in the bioinformatics analyses of the sequencing reads. Thus, it is important to use reliable, well‐curated and updated databases as a reference to interpret the biological data obtained, which would avoid false positive (identification as AMR determinants of genes which are actually not conveying resistance) and false negative (databases which do not recognise as AMR determinants novel AMR genes not yet included in the databases) results. Also, without benchmarking studies, it is difficult to define a sequencing depth threshold that conveys appropriate coverage of both high‐ and low‐abundance resistance genes. Sensitivity for detection of low‐abundance genes is particularly relevant for early detection in situations of resistance emergence.
Finally, another limitation is that the detection of AMR determinants through shotgun metagenomics does not necessarily mean that they will be phenotypically relevant (i.e. they might be not expressed, or they might be identified as AMR determinants due to their high homology to those included in the used databases but will not convey resistance). This is a shared limitation for shotgun metagenomics and WGS. However, it is important to note that some practical exercises have obtained a high level of agreement between predicted resistance by WGS and phenotypic resistance monitored using classical microbiology methods (see Section 3.7.4.1).
Similar approaches to those followed to study the resistome through shotgun metagenomics can be used to identify in a given sample virulence determinants linked to colonisation, cellular communication or pathogenicity functions, although this has been less frequently carried out. However, there are some examples available in the literature. For instance, the role of the rumen as a reservoir of virulence‐associated genes has been monitored by (Singh et al., 2012) and (Auffret et al., 2017). The benefits (rapidity; simultaneous detection of a range of virulence genes; potential for obtaining information on the genetic background of the virulence determinants), limitations (results will depend on the quality of the databases; uncertainty on the agreement between virulence genes detection and phenotype), and opportunities (potential to re‐analyse previously sequenced genomes and to link sequencing data with metadata from the samples) of using shotgun metagenomics with this aim are similar to those previously described for the resistome.
Moreover, apart from the detection/characterisation of AMR determinants and virulence factors, there is potential to use shotgun metagenomics following similar approaches to detect genes associated with any other relevant function, such as determinants of microbial persistence, biofilm formation, stress response, biocide resistance, etc., as soon as reliable, curated and updated databases are made available for these particular purposes. Then, the distribution of these genetic determinants and their changes over time could be also modelled.
Metagenomics is a particularly interesting asset to characterise shifts in complex microbial populations which are comprised not only by easy‐to‐culture microorganisms but also by fastidious or yet uncultured microbes. This may have some potential applications related to surveillance, source attribution and risk assessment. First, it may be possible to identify microbial groups which tend to be positively (co‐occurrence) or negatively (antagonistic interaction) associated with pathogenic microorganisms in foods or clinical samples, which could thus be used as indicator or sentinel microorganisms. Microbial interactions within complex ecosystems can be evaluated through metagenomics, which would allow the determination of microbiome patterns which favour or prevent the growth or survival of food‐borne pathogens (den Besten et al., 2018), as well as the potential identification of suitable surrogate microorganisms that could be used, instead of pathogenic strains, when testing control measures. Second, it may be possible to obtain microbial signatures which can be compared across a set of samples allowing to (i) achieve successful source attribution of outbreak‐associated or sporadic illness cases, and (ii) identify transmission pathways and cross‐contamination events during processing. Metagenomics‐based source attribution is facilitated whenever draft genomes of the strains of interest can be obtained and typing (e.g. MLST) can be achieved from the shotgun metagenomics sequencing data, but this might not be always possible. Alternatively, shotgun metagenomics offers the possibility to perform source‐attribution based on genetic source‐indicators alternative to the established standards (cgMLST, SNPs, etc.), eventually even based on a mix of taxa and/or functional genes. Thirdly, it can be possible to integrate metagenomics outputs into predictive microbiology models describing the behaviour of the ecosystem as a whole. For instance, Mounier et al. (2008) modelled complex microbial communities during cheese fermentation, monitored through metagenomics, using Lotka–Volterra equations, which describe predator‐prey relationships among microorganisms. Similarly, it would also be possible to model the dominant taxa and their changes over time under different scenarios of food processing, preservation and storage, which would provide valuable information for exposure assessment (den Besten et al., 2018). Nevertheless, shotgun metagenomics results are also challenging to interpret (Quince et al., 2017). This is due to several reasons: (1) microbial content can vary greatly in the same environment, which requires a large number of samples to draw strong conclusions on the differences in bacterial composition among different reservoirs and/or scenarios; and (2) cross‐sectional studies of complex environments are of limited value due to the lack of controls, for which longitudinal studies are necessary.
Finally, metagenomics approaches also can provide information on the interaction of biological hazards with the human gut microbiota, which potentially might be valuable for hazard characterisation, since the health outcome can greatly depend on the prior gut microbiota status (i.e. intestinal dysbiosis can facilitate colonisation by food‐borne pathogens) (Coleman et al., 2018).
However, although metagenomics has so far shown potential for hazard identification and other steps of risk assessment, it only provides information on the relative abundance of taxa and/or genetic determinants (e.g. AMR or virulence determinants), whereas absolute estimates are more relevant for predictive modelling and risk assessment purposes. The correct interpretation of relative abundance data (Calle, 2019) and the development of approaches capable of translating shotgun sequencing data into absolute abundance estimates, as for instance in Chen et al. (2017), can thus facilitate the application of shotgun metagenomics in MRA. In addition, some future needs must be addressed to overcome the following challenges for its implementation for routine use:
The generation of representative data sets and the creation and curation of databases specially dedicated to food‐related ecosystems, updated in real time. In this regard, it is important to note that most databases available so far for microbiome analyses are mainly focused on the human gut microbiome and therefore are biased to some extent. The implementation of databases with a better representation of food microbiome relevant taxa and functions would increase the accuracy and power of metagenomics analyses for food safety purposes.
The development of harmonised or standardised protocols to conduct metagenomics analyses. It is widely recognised that several steps of the analysis (sampling, nucleic acids extraction, library preparation, bioinformatics pipelines) influence the output obtained. Therefore, harmonised protocols are needed to obtain, manage and interpret sequencing data minimising interlaboratory variation. For example, Clooney et al. (2016) investigating the impact of various sequencing approaches and analytical methods showed the risks associated with comparing data generated using different strategies. Indeed, they showed that the choice of taxonomic binning software for shotgun sequences proved to be of crucial importance.
The development of improved methodologies for the shotgun metagenomics analysis of low‐biomass samples (such as those of most food processing environments), which are currently prone to misinterpretation due to the potential presence of contaminating nucleic acids derived from laboratory reagents and environments (Salter et al., 2014).
To sum up, metagenomics has the potential, as described above, to provide information on a diversity of microbial communities, which can be used to move forward to a more targeted MRA. Whenever risk assessment requires evaluation of a microbial community or the evaluation of a known hazard in a complex ecosystem, metagenomics can offer new valuable information. This information can lead to new insights into the dynamics of the interaction of food pathogens within complex food products, within the processing environment or within the human microbiota after infection (Cocolin et al., 2018). This information can be used for fine tuning the actual exposure assessment as applied in current MRA models. Indeed, data could potentially be gathered on the presence of certain bacterial strains in food products and other complex ecosystems. The dynamics of these particular bacterial strains could potentially be quantified by applying metagenomics using markers of response intensity (den Besten et al., 2018).
3.6.1. Concluding remarks
Shotgun metagenomics can be used to infer the full repertoire of resistance determinants, virulence determinants and determinants or any other relevant function (i.e. biofilm formation, stress response, etc.) within a given sample.
Shotgun metagenomics allows for the simultaneous detection of a vast number of genetic determinants derived from different microbial origins within a given sample. However, it is not always possible to obtain important information on the genetic background of those determinants (e.g. microbial taxa of origin and/or association with mobile genetic elements).
Future risk assessments incorporating metagenomic data will require harmonised sample preparation and sequencing methods, as well as reliable, well‐curated and updated food‐related databases as a reference, which would reduce false positive and false negative results.
Metagenomics, in combination with other ‐omics methodologies for the study of complex microbial populations (e.g. metatranscriptomics, metaproteomics and metabolomics), has the potential to predict the phenotypic behaviour of the community as a whole. Taking into account information on the dynamics of microbial communities in the food product, the processing environment and the human microbiota upon infection, it has the potential to fine tune current MRAs. It can also lead to the development of new approaches in risk assessment which would consider the entire food microbiome.
3.7. Microbiological methods used in the scope of current EU food legislation and SWOT analysis of NGS‐based alternatives
3.7.1. Salmonella serotyping
Salmonella serotyping is the traditional method used for classification, characterisation and surveillance of Salmonella worldwide. Salmonella serotyping is important in both human and veterinary diagnostics. Serotypes differ enormously in their host range and infection syndromes that they cause in humans and animals. Some serovars are host restricted, such as Salmonella Typhi to humans and S. Gallinarum to poultry. Other serovars, like S. Dublin and S. Choleraesuis are host‐adapted, having a natural host species and rarely infecting other hosts. Finally, serovars like S. Enteritidis and S. Typhimurium have a broad host‐range, and often cause self‐limiting gastroenteritis in humans and other animal species but can also lead to severe disease outcomes including death (Uzzau et al., 2000; Langridge et al., 2012).
Serotyping is based on agglutination of O and H antigens with specific O and H antisera. Combinations of the O and H antigens form the basis of the serotyping scheme, presently representing over 2,600 serovars (Grimont and Weill, 2007; Issenhuth‐Jeanjean et al., 2014). Specific antigenic formula has been given a unique serovar name, some names historically denoting syndrome, relationship and host specificity. This was further developed, with names indicating the geographical origin of the first isolated strain of a new serovar. Names are maintained for subspecies enterica only, and all other serovars are designated by their antigenic formula (Grimont and Weill, 2007).
Salmonella serotyping forms the basis for harmonised surveillance in Europe, in principle covering the whole food chain from farm to fork. European Regulation (EC) No 2160/2003 ensures that measures are taken to reduce the prevalence of Salmonella serotypes in certain animal populations through the establishing of National Control Programmes (NCP) at MS level. Criteria for Salmonella monitoring have been laid down in Regulation (EC) No 2160/2003, listing the minimum requirements that competent authorities and food business operators have to respect in relation to having samples taken and analysed for the control of Salmonella in different animal species and categories. As far as flocks of Gallus gallus and turkeys are concerned, the Regulation requires all Salmonella serotypes ‘with public health significance’ to be monitored at various production stages based on specific criteria:
the most frequent Salmonella serotypes associated with human salmonellosis on the basis of data collected through European Commission monitoring systems.
the route of infection (that is, the presence of the serotype in relevant animal populations and feed).
whether any serotype shows a rapid and recent ability to spread and to cause disease in humans and/or animals.
whether any serotype shows increased virulence, for instance as regards invasiveness, or resistance to relevant therapies for human infections.
Prevalence targets have been defined for breeding flocks of G. gallus (Commission regulation (EU) No 200/2010), laying hens (Commission regulation (EU) No 517/2011), broilers (Commission regulation (EU) No 200/2012), and breeding and fattening turkeys (Commission regulation (EU) No 1190/2012) and correspond to the maximum annual percentage of flocks remaining positive for relevant serotypes. The relevant serotypes are S. Enteritidis and S. Typhimurium, including its monophasic variants; for breeding flocks of G. gallus, S. Infantis, S. Virchow and S. Hadar are considered to be relevant as well. In addition, according to Regulation (EC) No 2073/2005, fresh poultry meat from breeding flocks of G. gallus, laying hens, broilers and breeding and fattening flocks of turkeys must not be placed on the market if found contaminated with S. Enteritidis or S. Typhimurium, including its monophasic variant S. 1,4,[5],12:i:‐, during its shelf‐life (Regulation (EC) No 2073/2005).
The worldwide importance of Salmonella serotyping for subtyping, harmonised surveillance, diagnostics and communication has driven the development of tools for deriving the Salmonella serotype from WGS data within recent years. Formerly, the 7‐locus MLST has been shown to correlate quite well with many serovars of Salmonella (Achtman et al., 2012; Alikhan et al., 2018). The tool ‘Metric Oriented Sequence Typer’ (MOST) is a mapping‐based approach using short reads to derive the sequence type (ST) from WGS data and correlate them with the Salmonella serovar using the Public Health England (PHE) database (Ashton et al., 2016; Tewolde et al., 2016). A different approach for identifying the serotype of Salmonella from the WGS data is SeqSero, which analyses the sequences of the Salmonella O‐group and H antigen determinants (Zhang et al., 2015). An updated programme version (SeqSero 2) has been recently published (Zhang et al., 2019). A third approach that combines the sequences of antigen determinants and the MLST approach performs better than any method alone. Two applications have been developed combining the two methods, one being Salmonella in silico Typing Resource (SISTR) (Yoshida et al., 2016) and the other SamonellaTypeFinder (https://cge.cbs.dtu.dk/services/SalmonellaTypeFinder/) (Inouye et al., 2014). Many laboratories use one or more of these tools in a combination with in‐house pipelines that can also determine subspecies and other relevant targets.
Inconsistencies between the prediction tools and the conventional serotyping are not the result of errors but of a conceptual shift in how a serotype is defined (Yachison et al., 2017). Benchmarking studies on software and applications developed for WGS‐based Salmonella serotype prediction are summarised in Table 3. Benchmarking results will help to better understand the genetic basis of the phenotypic expression of the O‐ and H‐antigens which define the serotype. Furthermore, in silico serotyping is only as good as the database from which the genetic relatedness into a serotype is drawn. Also, certain quality parameters of the method itself can lead to ambiguous results. WGS data of insufficient quality might fail the correct prediction of the serotype. Similarly, antisera of low quality can result in false interpretation of agglutination results.
Table 3.
Correlation of in silico Salmonella serotype prediction approaches compared to phenotypic serotype determination according to the White–Kauffmann–Le Minor schemea
| Reference | Strain set tested (origin of genome sequences) | SeqSero/SeqSero2b | SISTRb | MOSTb | SalmonellaTypeFinder (SeqSero and SRST2)b | MLSTb |
|---|---|---|---|---|---|---|
| Zhang et al. (2015) | 3,061 (public sequences from GenomeTrakr consortium) |
SeqSero: 92.6% agreement 6.2% disagreement 1.2% no prediction |
Not tested | Not tested | Not tested | Not tested |
| 304 (public sequences from CDC) |
98.7% agreement 0.7% disagreement 0.7% no prediction |
Not tested | Not tested | Not tested | Not tested | |
| 324 (public assembled genomes) |
91.5% agreement 3.1% disagreement 5.4% no prediction |
Not tested | Not tested | Not tested | Not tested | |
| Ashton et al. (2016) | 6,887 (subspecies I, PHE isolates, all serotyped) | Not tested | Not tested |
96% agreement 4% disagreement/no prediction |
Not tested | Not tested |
| Yoshida et al. (2016) | 4,188 (public available sequences) | Not tested |
94.6% agreement 5.4% disagreement/no prediction |
Not tested | Not tested | Not tested |
| Yachison et al. (2017) | 813 (isolates from Canada including top 20 serotypes in Canada and also subspecies I to IV, all serotyped) |
SeqSero: 54.1% agreement 11.8% disagreementc 34.1% no prediction/ambiguous |
89.7% agreement 5.2% disagreement 5.2% no prediction/ambiguous |
Not tested | Not tested |
77.9% agreement 11.7% disagreementd 10.5% no prediction/ambiguous |
| Ibrahim and Morin (2018) | 1,041 (isolates with public health significance, all serotyped) |
SeqSero: 86.4% agreement 7.7% disagreement 5.9% no prediction |
Not tested | Not tested | Not tested | Not tested |
| Robertson et al. (2018) | 42,400 (public available sequences) | Not tested |
91.9% agreement 5.0% disagreement 3.1% no prediction/ambiguous |
Not tested | Not tested |
87.2% agreement 5.3% disagreement 7.5% no prediction/ambiguous |
| Hendriksen et al. (2014) | 786 (broad range of Salmonella genomes including 196 serotypes provided by APHA, DTU, PHE), all serotyped but not confirmed |
SeqSero: 65% agreement 3% disagreement 32% no prediction/ambiguous |
88% agreement 8% disagreement 3% no prediction/ambiguous |
85% agreement 4% disagreement 11% no prediction/ambiguous |
85% agreement 3% disagreement 11% no prediction/ambiguous |
Not tested |
| Zhang et al. (2019) | 2,280 (human clinical isolates submitted to NARMS at CDC) |
SeqSero2: 97.6% agreement 2.4% disagreement |
97.7% agreement 2.3% disagreement |
Not tested | Not tested | Not tested |
The presented results are based on the literature search performed within the remit of the Opinion and is not a guarantee for completeness.
Definitions: ‘Agreement’ means full serotype name match between in silico tool and traditional method; ‘disagreement’ means incorrect calling of various antigenic determinants; ‘no prediction’ means calls with no result; ‘ambiguous’ include results that yield several possible serotypes, where the expected serotype is found among these.
In the study of Yachison et al. (2017), SeqSero specifically displayed difficulty differentiating serotypes that have the same antigenic formula but differed on minor O antigenic factors, such as Carrau (6,14,[24]:y:1,7) vs. Madelia (1,6,14,25:y:1,7), or that differed in subspeciation, such as Javiana (subspecies I 1,9,12:l,z28:1,5) vs. subspecies II 9,12:l,z28:1,5. Furthermore, some monophasic serovars were detected as ambiguous.
In the study by Yachison et al. (2017), MLST results in disagreement especially for serotypes I 4,[5],12:i:‐, Carrau, and Paratyphi B var. Java.
3.7.2. STEC serotyping
Similar to Salmonella serotyping, a traditional phenotypic serotyping scheme for E. coli exists, which is based on antisera to a combination of immunogenic structures, including lipopolysaccharide (LPS) (O) and flagellar (H) antigens. The scheme, first developed in the 1940s, has stood the test of time because it is applicable across the E. coli species and provides a user‐friendly designation for taxonomic differentiation and pathogenic groups.
An early STEC seropathotype classification, developed by Karmali and colleagues, was based on serotype association with human epidemiology and HUS (Karmali et al., 2003). STEC O157:H7 and O157:NM, which are associated with large outbreaks and cause HUS, were assigned to seropathotype A. O26:H11, O103:H2, O111:NM, O121:H19 and O145:NM, which also cause large outbreaks (but less often than O157) and HUS, were assigned to seropathotype B, while O91:H21, O104:H21, O113:H21, O5:NM, O121:NM and O165:H25, found in sporadic cases (including HUS), were considered to be seropathotype C strains. Seropathotype D included serotypes associated with diarrhoea but not outbreaks or HUS, while seropathotype E strains had never been associated with human illness. In Europe, five serogroups (O157, O26, O111, O103 and O145) are associated with the majority of severe disease in humans (Karmali et al., 2003). In the USA, the main STEC serogroups associated with human illness are O157, O26, O45, O103, 0111, O121 and O145 (Karmali et al., 2003).
However, the list of serogroups commonly associated with HUS, mentioned above, varies in different countries and is not exhaustive. STEC serotypes are constantly being isolated from patients with HUS that were not previously known to cause this condition. The BIOHAZ Panel was previously requested to deliver an Opinion on STEC‐seropathotype and scientific criteria regarding pathogenicity. The assessment concluded ‘that the Karmali seropathotype classification does not define pathogenic VTEC nor does it provide an exhaustive list of pathogenic serotypes’ (EFSA BIOHAZ Panel, 2013b). The panel proposed a molecular approach, utilising genes encoding virulence characteristics additional to the presence of stx genes.
Nevertheless, a serotype is a designation that is used and understood at the global level. Furthermore, serotyping is currently required during testing for STEC in order to conform to the following European Commission regulations listed:
Commission regulation (EC) No 2073/2005 on microbiological criteria for foodstuffs, namely the STEC food safety criterion in sprouted seeds
Regulation (EC) No 882/2004 on official controls performed to ensure the verification of compliance with feed and food law
The Center for Genomic Epidemiology has constructed a database (Serotypefinder) for in silico serotyping from assembled WGS data, as a component of the publicly available CGE Web tools (http://cge.cbs.dtu.dk/services/) (Table 4). The database is based on the O‐antigen processing system genes wzx, wzy, wzm, and wzt for in silico O typing and the flagellin genes fliC, flkA, flmA, flnA, and fllA for in silico H typing. The content of the database was obtained by searching the NCBI nucleotide collection for all the above‐mentioned genes in E. coli and collecting only complete genes from the entries with assigned O types or H types, in accordance with the specific gene. All unique gene variants are stored in the database. In addition, a sequence set of O‐antigen processing genes from O1 to O187 reported by Iguchi et al. (2015) was also employed for the database construction. Finally, the E. coli reference strains Su4411‐41 (O14), F10018‐41 (O18ab), F8198‐41 (O57), 2745‐53 (125ab), 2129‐54 (125ac), 56‐54 (128ab), 5564‐64 (128ac), E68 (O141ab), and RVC2907 (O141ac) were sequenced at SSI, and the gene variants were extracted and added to the database. Similarly, the H24 reference strain K72 (H25w) was sequenced, and the fliC variant added to the H database (Joensen et al., 2015). The Genefinder tool developed at Public Health England uses the Serotypefinder database described above (Table 4).
Table 4.
Correlation of in silico STEC serotype prediction approaches compared to phenotypic serotyping by slide agglutination using antisera to the somatic O‐ and flagella H‐antigens
| Reference | Strain set tested | Database/searching tool | Resultsa , b | Comments |
|---|---|---|---|---|
| Joensen et al. (2015) | 682 clinically relevant strains of human origin, of which 569 were examined for O antigens and 508 were tested for H antigens | Serotypefinder/Serotypefinder CGEl |
98.4% agreement with classical O typing 99.2% agreement with classical H typing |
|
| Chattaway et al. (2016) | 102 strains of non‐O157 STEC | Serotypefinder/Genefinder |
96.1% agreement with classical O typing 100% agreement with classical H typing |
All but one of the 38 isolates that could not be phenotypically serotyped (designated O unidentifiable or O rough) were serotyped using WGS data |
| Ingle et al. (2016a) | A total of 197 EPEC isolates were available for analysis, including 185 atypical EPEC (aEPEC) and 11 typical EPEC from the Global Enteric Multi‐Center Study (GEMS) | EcOH/SRST2 |
Preliminary validation: 95% agreement with classical O typing 100% agreement with classical H typing Secondary validation: 93% agreement with classical O typing 95% agreement with classical O typing for isolates that were phenotypically typeable |
85% of isolates that were not serologically typeable (i.e. those which the reference laboratory identified as O‐non‐typeable or O‐rough) were genotyped discovering novel O antigen loci, which were added as a result of the study to the EcOH database |
The presented results are based on the literature search performed within the remit of the Opinion and is not a guarantee for completeness.
‘Agreement’ means full serotype name match between in silico tool and traditional method; ‘disagreement’ means incorrect calling of various antigenic determinants.
An alternative reference database is the EcOH database of O‐ and H‐type encoding sequences, which was initially constructed in 2014 from publicly available sequences identified in GenBank by reviewing the literature on the PCR detection of E. coli O‐ and H‐types (Wang et al., 2016; Ratiner et al., 2010; DebRoy et al., 2011). This was updated by a further review in May 2015 (Iguchi et al., 2015; Joensen et al., 2015). The EcOH database also includes sequences for all 53 known H‐types, allowing for the detection of both fliC and non‐fliC flagellin (flnA, fmlA, flkA and fllA) genes, and for the identification of isolates that may be able to undergo flagellum phase variation (Tominaga, 2004; Tominaga and Kutsukake, 2007). For the O‐groups, the database specifies the 16 O‐group clusters containing 37 O‐groups as identified by Iguchi et al. (2015) where there was > 95% sequence identity. The number of total O‐group/clusters is 161. The EcOH database is available at https://github.com/katholt/srst2 (Table 4).
Enterobase (https://enterobase.warwick.ac.uk/), an online resource for analysing and visualising genomic variation within enteric bacteria, has implemented a BLASTN based in silico E. coli prediction tool for the O‐ and H‐antigens of E. coli and Shigella (https://github.com/zheminzhou/EToKi%23ebeis%e2%80%94in-silico-serotype-prediction-for-escherichia-coli%e2%80%93shigella-spp). It uses essential genes (wzx, wzy, wzt and wzm for O‐antigens; fliC for H) as markers. The database is built from Serotypefinder and sequences published in DebRoy et al. (2018).
Proof of concept exercises carried out in the frame of the EFSA funded project INNUENDO have demonstrated the possibility of WGS to correctly determine E. coli pathotypes and serotypes.
The validations documented in the literature show that WGS analysis provides a reliable and robust one‐step process for STEC serotyping (Table 4). Previous studies have shown an increasing number of STEC strains reported as ‘O group unidentifiable’ due to antisera failing quality control procedures, unresolvable cross reactions, lack of expression of O antigens (designated ‘rough’) or novel serogroups (Byrne et al., 2014; Jenkins, 2015). There is good evidence that the majority of previously phenotypically untypeable isolates can be serotyped using WGS data.
3.7.3. SWOT analysis of WGS‐based Salmonella/STEC serotyping
3.7.3.1.
Strengths of WGS‐based serotyping
Both Salmonella and STEC serotypes can be predicted in silico based on WGS, with a high level of agreement with classical serotyping. Several tools to predict the serotype from WGS data have been published (Tables 3 and 4).
For predicting Salmonella serotype based on in silico WGS data, a combined analysis approach using different tools performs better than any method alone.
For STEC, isolates designated untypeable using classical serotyping (e.g. rough isolates, non‐motile strains, strains not expressing O‐ or H‐defining genes) and those isolates exhibiting unresolvable cross reactions can be fully assigned to a genome derived serotype using WGS data (Byrne et al., 2014; Do Nascimento et al., 2017). This will further strengthen the harmonised surveillance in Europe that is based on EU regulations targeting specific serotypes.
In silico WGS serotyping avoids the need for the resource intensive antisera production process and the inherent quality control issues requiring specialist resources and expertise.
For STEC, H‐typing can take several days up to weeks to complete as isolates need to be cultured on specified media in order to induce expression of the flagella (H) antigen. With WGS, it is possible to derive the full serotype in one test.
Identifying and establishing novel O‐ and H‐groups, especially for STEC, is much less demanding and operationally complex than producing and verifying new rabbit antisera for the phenotypic scheme, as novel O groups can be determined and characterised by analysing the genome data.
For STEC, WGS data offer valuable insights into the degree of variation in the O‐ and H‐antigen encoding genes within each O‐ and H‐type and the significance of cross‐reactions between O‐groups.
Analysis of WGS data provides the opportunity to examine the effect of mobile genetic elements, such as prophage, plasmids and genomic islands, on O‐antigen expression and evolution.
Weaknesses of WGS‐based serotyping
Different tools/databases and local pipelines are in use for predicting serotypes of Salmonella and STEC and can lead to results not being always comparable. This can depend on the quality of sequences, the assembly software and the method(s) used by the software to predict the serotype (e.g. O‐group and H‐antigen determinants or phylogeny/MLST based).
WGS offers a genotypic determination of the STEC serotype/pathotype, leaving open the possibility that genes (e.g. virulence genes) may not be expressed.
Opportunities of WGS‐based serotyping
The WGS inferred serotypes cannot be more accurate than the database/pipeline they were derived from. Databases rely on proper serotyping from providing laboratories.
Bioinformatic resources are required to analyse WGS data, including analysis pipelines for assembly, annotation, and interpretation of the data, which will require a coordinated international approach (Franz et al., 2014; Oulas et al., 2015).
Novel O‐ and H‐types continue to be identified, especially for STEC, and there is a requirement for continued database up‐dating and curation for Salmonella and STEC. WGS O‐ and H‐antigen data can be used to define new serotypes that do not match ‘classically defined’ serotypes.
WGS‐inferred serotypes can in most instances be compared directly with classical serotyping data ensuring comparability of results between laboratories working following different methods.
If WGS‐inferred serotypes of Salmonella and STEC are collected centrally in a timely way, these data could form the basis for a powerful first level detection of clusters in outbreak investigations and source tracing.
Identification of subgroups within Salmonella serotypes and discrimination among lineages of polyphyletic serotypes can provide insights into host specificity (Sévellec et al., 2018).
With WGS, control surveillance could be focused on the pathotype concept for STEC considering virulence genes instead of serogroup/serotype (sero‐/pathotype).
Threats for WGS‐based serotyping
Limited availability of funding could hinder the development, management and continuous update of available web‐based tools and databases for analysing sequencing data.
International standardisation, including validation studies of WGS serotyping, is delayed in time. It is important to assure the quality of the tools used to predict serotypes or pathotypes from WGS data.
A transition phase of new revisions of the White–Kauffmann–Le Minor scheme for Salmonella scheme to be adapted to WGS is expected. This could hamper the comparability of serotyping data and data exchanged due to the application of different approaches, i.e. classical phenotypic serotyping methods and new WGS serotyping methods.
3.7.4. Monitoring of antimicrobial resistance in zoonotic and commensal bacteria
Zoonotic bacteria that are resistant to antimicrobials are of particular concern, as they might compromise the effective treatment of infections in humans. Data from the EU MSs are collected and analysed in order to monitor the occurrence of AMR in zoonotic bacteria isolated from humans, animals and foods in the EU and published yearly in the EFSA and ECDC joint European Summary reports on AMR. For 2017, 28 MSs reported data on AMR in zoonotic bacteria to EFSA, and 24 MSs reported data to the ECDC. In addition, three other European countries reported data; Iceland and Norway reported to ECDC, while Iceland, Norway and Switzerland reported to EFSA (EFSA and ECDC, 2018a). The enhanced monitoring of AMR in bacteria from food and food‐producing animals set out in the Commission Implementing Decision 2013/652/EU was successfully implemented in reporting MSs and non‐MSs in the EU during 2017 and is performed in a harmonised way. However, the antimicrobial susceptibility testing (AST) methodology used for the human isolates is highly variable, MS dependent and therefore difficult to compare between countries or to data on isolates from food and food‐producing animals.
3.7.4.1. SWOT analysis of WGS‐based AMR monitoring
Monitoring for AMR is performed to monitor the evolution of the acquisition and spread of AMR in a one health approach. The data are forming the basis for a risk assessment, considering two distinct hazards: (1) the increased risk for human and/or animal health due to the occurrence of antimicrobial resistant pathogenic strains and (2) the risk for further dissemination of the AMR genetic elements to human and/or animal pathogenic strains due to horizontal gene transfer.
Strengths of WGS‐AMR monitoring
WGS offers the possibility to predict from a single assay the presence of an extended set of AMR elements. No other single tool has the potential to reach this sensitivity.
WGS is considered as a powerful tool for epidemiological monitoring of AMR along the food chain. The prediction of the susceptibility to antimicrobials based on WGS‐based genotyping of strains (see Table 5 for a summary of studies on the agreement between the two methodologies for different food‐borne pathogens and indicator organisms) is often correct.
WGS offers the possibility to differentiate between AMR due to acquired resistance genes and resistance due to chromosomal SNPs. It provides information on the location of AMR genes and on their possible association with mobile genetic elements. As resistance genes localised on mobile genetic elements, are, in general, more prone to dissemination by horizontal gene transfer, this information adds to the hazard characterisation.
WGS‐AMR offers a faster tool for AMR profiling compared to phenotypic assays in the case of slow‐growing (fastidious) bacteria as Mycobacterium spp.
WGS‐AMR offers the possibility to perform AMR testing with a minimum of pathogen cultivation leading to a reduced risk for infection of laboratory technicians and a reduced risk for environmental contamination and spread.
Weaknesses of WGS‐AMR monitoring
WGS offers a genotypic determination of chromosomal or acquired AMR genes without confirming their expression.
In contrast to the high predictive value observed for resistances linked to acquired AMR determinants, the ability of WGS‐AMR to predict resistance due to chromosomal alterations is less standardised in the general available tools and also limited by existing knowledge on the actual expression level and contribution to a resistance phenotype (Ellington et al., 2017; Hendriksen et al., 2018). Especially, chromosomal mutations that alter expression and functionality of the cell membrane permeability, antimicrobial efflux due to efflux pumps or changes in the lipopolysaccharide structure and corresponding increase in minimum inhibitory concentrations (MICs) that can be associated, have yet to be fully elucidated at the functional level (Ellington et al., 2017).
A major bottleneck for WGS‐AMR is formed by unknown, novel resistance genes or mutations as these will not be present in the available databases (Schürch and van Schaik, 2017), making complementation of WGS‐AMR by phenotypic tests still indispensable.
Opportunities of WGS‐AMR monitoring
WGS data are, once collected, maintained in databases and remain easily accessible for future investigations. This offers the opportunity to re‐analyse previously sequenced genomes in function of new emerging antibiotic resistance determinants. An example is the confirmation of the plasmid‐mediated colistin resistance gene mcr‐1 in human E. coli and Salmonella spp. in the UK since at least 2012 (Doumith et al., 2016). The information is independent of the maintenance of strains in culture collections, which is for practical reasons very often restricted in routine laboratories to a limited number of strains and, therefore, a limited number of years.
WGS data on AMR can be helpful in tracing transmission pathways of pathogenic strains. As such they can be useful in outbreak investigations as an additional tool.
Although WGS‐AMR monitoring programmes are increasingly implemented all over the world, a global WGS‐AMR monitoring system has not been realised. WGS‐AMR analysis, based on quality criteria and sufficiently standardised, has the potential to open perspectives for a global exchange of data leading to a global AMR monitoring system.
WGS‐AMR can be a standardised universal methodology for AMR testing of pathogenic strains isolated from humans, animals, food and the environment by using a standardised universal WGS‐based methodology. This testing is performed differently depending on the isolation source. Standardisation or harmonisation would increase the possibilities for assessing the dissemination of AMR in a ‘one‐health’ approach and would lead to an increased support of an effective AMR management based on AMR monitoring data of strains from different sources.
WGS‐AMR offers the opportunity to link for a group of strains the presence of AMR genes with information from strain evolution deduced from the general genome structure. This allows for increased understanding of the generation, spread and loss of AMR over time which was illustrated for Campylobacter isolates (McCarthy, 2017).
WGS‐AMR can contribute to an increased insight into the recognition and function of genetic elements able to mobilise resistance genes. Recently, it was recognised that several carbapenemases are mobilised by integrative conjugative elements (Botelho et al., 2018b) and that transposases can play a role in inducing AMR genes as has been reported for K. pneumoniae, where an insertion in mgrB led to colistin resistance (Poirel et al., 2015), and for E. coli, where an increased expression of an efflux system contributed to fluoroquinolone resistance (Jellen‐Ritter and Kern, 2001).
An increasing availability of WGS data from clinical samples will allow to determine the public health relevance of different AMR determinants.
3.7.4.2.
Threats/challenges for WGS‐AMR monitoring
Insufficient quality of WGS data could lead to inconsistent results. Quality control parameters are proposed and need to be implemented to improve the reliability of the obtained results (Ellington et al., 2017). Especially, short‐read WGS has difficulties for managing direct repeats and plasmid analysis and can be misleading in investigating plasmid‐related AMR genes.
Different databases/bioinformatic tools/nomenclature could hamper the comparative accuracy of the results. A comprehensive and curated catalogue of resistance mutations and genes has to be set up and agreed on, as well as the use of a harmonised computational approach to predict AMR from WGS data (Hendriksen et al., 2019a). Also, clear criteria to define a gene as ‘novel’ (i.e. % of identity with existing genes) need to be established (Ellington et al., 2017).
The level of agreement between WGS‐AMR and prediction of antimicrobial susceptibility varies among bacterial species and AMR determinants. This variation is mostly related to resistances due to chromosomal mutations and much less to those related to acquired genes. Therefore, depending on the monitoring objective, the organisms and/or the resistances, complementation with phenotypic data should still be envisaged. Also, discordance because of lack of phenotypic expression of genetic AMR determinants may occur.
3.7.4.3. SWOT analysis of metagenomics‐based AMR monitoring
AMR monitoring based on shotgun metagenomics is a field which is rapidly evolving. However, the implementation of metagenomics for routine use is still far away mainly due to the lack of standardisation and validation of methods and protocols to conduct metagenomic analyses across different sectors (e.g. human/food samples). Most of the strengths and weaknesses of metagenomics‐based AMR monitoring are common to those previously described for WGS‐based AMR monitoring. In addition, taking into account recent reports highlighting the potential of this relatively novel technology, it is possible to mention some extra opportunities and threats for the application of WMS for AMR monitoring, as described below.
Strengths/opportunities of metagenomics‐based AMR monitoring
Shotgun metagenomics can be a more rapid AMR monitoring technique since it does not require the cultivation of microbial isolates.
With the use of shotgun metagenomics, it may be possible to predict AMR phenotypes without the need for culture of dangerous pathogenic microorganisms in the laboratory. Metagenomics can be a useful tool for AMR profiling in the case of slow‐growing or non‐cultivable bacteria.
Shotgun metagenomics offers the possibility to detect in a single assay AMR genes associated with different microbial taxa or species/strains.
Shotgun metagenomics offers the opportunity to link the presence of AMR genes with information on mobile genetic elements, and determinants of virulence, biofilm formation, etc., and with metadata available from the sample.
Shotgun metagenomics has potential to provide information on the genetic background of the detected AMR determinants (microbial species or strain of origin), due to novel approaches such as metagenomics binning.
Weaknesses/Threats for metagenomics‐based AMR monitoring
There are no available microbial isolates to be re‐analysed if necessary.
Shotgun metagenomics is not able to differentiate DNA coming from live and dead cells, and therefore the presence in a metagenome of an AMR determinant does not necessarily imply a risk.
The attribution of the identified resistance genes to specific taxa or strains and their identification as transferable or non‐transferable resistance determinants is not always possible, which may hamper the assessment of the risk posed by such AMR determinants.
Insufficient quality of shotgun metagenomics data could impede obtaining information on the genetic background of the detected AMR determinants. Low‐biomass samples (such as those of most food processing environments), which are currently prone to misinterpretation due to the potential presence of contaminating nucleic acids derived from laboratory reagents and environments, can be especially difficult to manage. This poses also a challenge for the use of shotgun metagenomics in integrated monitoring, where human, animal, food and environmental samples must be compared.
3.7.5. Concluding remarks
WGS is a multipurpose tool offering from a single assay information on serotype, in the case of Salmonella and STEC, and on the presence of an extended set of AMR elements.
Novel serotypes and AMR genes continue to be identified and there is a requirement for continued database updating and curation.
WGS offers the possibility to perform serotyping and AMR profiling with a minimum of pathogen cultivation leading theoretically to a reduced risk for infection of laboratory technicians and a reduced risk for environmental contamination and spread.
WGS data can be more easily stored and maintained in databases compared to the storage of the bacterial isolates in strain collections and, therefore, WGS offers the opportunity to re‐analyse previously sequenced genomes in function of new insights and knowledge on e.g. virulence factors, AMR determinants, outbreak strains. This does not ignore the importance of keeping pathogen strain collections for complementary analyses e.g. in relation to risk assessment.
-
A high level of agreement between phenotype and WGS‐based genotyping can be reached for serotyping Salmonella and STEC and for AMR monitoring, suggesting that these approaches are able to produce reliable results in the context of the relevant EU regulations.
-
○
For Salmonella and STEC, the majority of isolates, previously not typeable by conventional serotyping, can be serotyped using data derived from the genome. This will provide more comprehensive and harmonised surveillance based on EU regulations targeting specific serotypes.
-
○
For Salmonella, a combination of different software tools performs better than each on its own.
-
○
For AMR, the limited degree of disagreement is mainly related to chromosomal alterations or variable expression of resistance genes.
-
•
WGS offers new opportunities for increasing the performance of Salmonella serotyping, STEC serotyping and AMR monitoring.
-
○
The benefits of WGS‐based serotyping highlight the importance of updating the food safety regulations based on classical serotyping and publishing appropriate validation requirements in a timely way to accommodate new typing parameters.
-
○
For Salmonella, the White–Kauffmann–Le Minor scheme needs to be updated by integrating genetic information aiming to resolve inconclusive/incorrect matches recorded by the in silico tools. The relevant Salmonella regulations will need to take into account this updated scheme incorporating both phenotypic and genotypic data.
-
○
For STEC, WGS‐based serotyping is a superior technique compared to phenotypic serotyping and it would be appropriate to incorporate this approach into the relevant EU regulation.
-
○
For AMR monitoring, the use of WGS can provide extra information on the nature and localisation of the resistance determinants. AMR due to acquired resistance genes localised on mobile elements affects their dissemination potential by horizontal gene transfer and their contribution potential to the burden of AMR in humans.
-
○
For AMR monitoring, it would be appropriate to follow a gradual approach to the integration of WGS within the harmonised AMR monitoring.
-
•
An important limitation for WGS‐AMR monitoring is formed by unknown, novel resistance genes or mutations as these will not be present in the available databases, making complementation of WGS‐AMR by phenotypic tests still indispensable.
-
•
Insufficient quality of WGS data could lead to inconsistent results. Different databases/bioinformatic tools/nomenclature could hamper comparative accuracy of the results.
-
•
In the transition period of WGS implementation, the change to WGS may lead to operational adaptations of reference services at national and international level and to difficulties in data exchange.
-
•
Metagenomics is a relatively novel technology which shows potential to be used for AMR monitoring, offering some extra opportunities and threats in comparison to WGS. It does not require the cultivation of microbial isolates and offers the possibility to detect in a single assay AMR genes associated with different taxa or microbial species/strains. However, it is not able to differentiate DNA coming from live and dead cells, and therefore the presence in a metagenome of an AMR determinant does not necessarily imply a risk, and there are no available microbial isolates to be re‐analysed if necessary.
-
•
Metagenomics can be a useful tool for AMR profiling in the case of slow‐growing or non‐cultivable bacteria. For these bacteria no phenotypic verification of the AMR is possible.
-
○
-
○
4. Conclusions
Answer to ToR 1. Evaluate the possible use of NGS (e.g. WGS and metagenomic strategies) in food‐borne outbreak detection/investigation and hazard identification (e.g. generation of data on virulence and AMR genes, plasmid typing) based on the outcomes of the ongoing WGS outsourcing activities, experience from different countries and underlining the added value for risk assessment.
WGS offers, in comparison to conventional typing methodologies, a more detailed outcome and new possibilities for food‐borne outbreak detection/investigation, source‐attribution and hazard identification. This methodology will underpin future developments in MRA and risk management directed at distinct subgroups of bacteria containing linked genetic markers.
WGS can be used for multiple purposes by running several bioinformatic analyses on the same data set. These can be performed in parallel in relation to the required output of the analyses (e.g. food‐borne outbreak investigation, source attribution, risk assessment) and allow the use of previously sequenced genomes in new outbreak investigations and risk assessments.
The discriminatory power of WGS for pathogen characterisation is superior, compared to conventional molecular typing methods, leading to more robust case identification. Matching of clinical strains to those from contaminated food products enables linking of sporadic cases, even derived from different food products and different geographical regions, to an outbreak and may facilitate epidemiological investigations. Thresholds of genetic differences for inclusion and exclusion of isolates within an outbreak are not absolute and can be a source of misinterpretation if they are applied without considering the epidemiological context. Regardless of the thresholds used, epidemiological information should be always used to define outbreaks.
WGS offers the possibility to enhance source attribution by providing improved identification of transmission pathways, facilitating the integration of spatiotemporal factors and the detection of multidirectional transmission and pathogen–host interactions. WGS‐based source attribution should ideally also be complemented by epidemiological data and still depends on a systematic, harmonised, representative data collection of all putative transmission sources and human cases.
Metagenomics is a culture‐independent methodology with potential for food‐borne outbreak detection/investigation (including those with unknown aetiology) and risk assessment of food‐borne pathogens, especially in relation to the identification and characterisation of non‐culturable, difficult‐to‐culture or slow‐growing microorganisms, the tracking of hazard‐related genetic determinants and markers (e.g. AMR determinants, virulence determinants, or markers linked to microbial behaviour), and the execution of risk assessments requiring the evaluation of complex microbial communities. Nevertheless, the impact of metagenomics on future risk assessment of food‐borne pathogens will depend on the ability to overcome some current methodological constraints (e.g. the lack of harmonised methods, the low sensitivity for detection, limitations related to specificity or the fact that results obtained strongly depend on the choice of wet laboratory methods and bioinformatics pipelines).
Answer to ToR 2. Critically analyse advantages, disadvantages and limitations of existing NGS‐based methodologies (including WGS) as compared to microbiological methods cited in the current EU food legislation (e.g. Salmonella serotyping, STEC monitoring, AMR testing), taking into account benchmarking exercises.
WGS is a multipurpose tool offering in a single assay information on serotype in the case of Salmonella and STEC, and on the presence of an extended set of AMR determinants.
A high level of agreement between phenotype and WGS‐based genotyping can be reached for serotyping Salmonella and STEC and for AMR monitoring, suggesting that these approaches are able to produce reliable results in the context of the relevant EU regulations.
For Salmonella and STEC, the majority of isolates, previously not typeable by conventional serotyping, can be serotyped using data derived from the genome.
For STEC, WGS‐based serotyping is a superior technique (more accurate, more discriminatory) compared to phenotypic serotyping and it would be appropriate to incorporate this approach into the relevant EU regulation.
For Salmonella, the White–Kauffmann–Le Minor scheme needs to be updated by integrating genetic information aiming to resolve inconclusive/incorrect matches recorded by in silico tools. The relevant Salmonella regulations will need to take into account this updated scheme incorporating both phenotypic and genotypic data.
For AMR, the limited degree of disagreement between phenotype and genotype is mainly related to chromosomal alterations or variable expression of resistance genes. The use of WGS can provide extra information on the genes present and their dissemination potential by horizontal gene transfer. The assessment of this Opinion confirms the conclusion that it would be appropriate to follow a gradual approach to the integration of WGS within the harmonised AMR monitoring.1
In the transition period of WGS implementation, the change to WGS may lead to operational adaptations of reference services at national and international level and to difficulties in data exchange.
Metagenomics shows potential to be used for AMR monitoring, offering some extra opportunities but also some limitations in comparison to WGS.
5. Recommendations
Standardisation and quality control parameters should be internationally agreed and validation should be initiated on a global scale to provide evidence that the methods are repeatable, reproducible and accurate. The methodology needs to be adapted to facilitate high throughput analysis especially when intended for routine use.
WGS and/or metagenomics‐based analysis using serotype, virulence and AMR markers should always be performed using updated, curated databases.
It is important to develop guidance to combine molecular and epidemiological information in the most effective way to define and investigate outbreaks.
Interoperable systems, respecting the interests of the different partners in the food chain, need to be implemented for sharing WGS data. The data collected in databases need to be well documented in a comprehensible and standardised way.
It is recommended that sufficient attention should be given to capacity building for the application of WGS (and metagenomics) within European laboratories and also worldwide.
Integration of WGS and metagenomics in MRA, based on the combination with phenotypic data, (meta)transcriptomics, (meta)proteomics and metabolomics, should be encouraged to achieve a more targeted risk management and to execute more targeted risk assessments including those focused on the evaluation of complex microbial communities.
The application of WGS and metagenomics should be encouraged to track genetic determinants (e.g. AMR determinants, virulence determinants, or markers linked to microbial behaviour) that are relevant to microbial hazards along the food chain.
Research is encouraged to develop metagenomics‐based approaches capable of linking relative abundance of taxa/genetic determinants with their absolute concentration and to improve the unequivocal association of such determinants to the taxa.
It is recommended to develop risk assessment methodologies/models specifically tailored to use data obtained through these novel NGS technologies.
Glossary
- Agreement
The probability that a pair of individuals have a certain characteristic, given that one of the pair has the characteristic. Twins are concordant when both have or both lack a given trait.
- Allele nomenclature schema
a collection of name designations for allelic variations (i.e. allele sequences) of each locus of a set of loci (i.e. schema) defined for a species or genus.
- Assembly
output from process of aligning and merging sequencing reads into larger contiguous sequences (contigs)
- Acquired AMR
ability of bacteria to resist the activity of an antimicrobial agent to which it was previously susceptible, i.e. bacteria with acquired resistance survive at higher antimicrobial concentrations compared to the wild‐type population. Acquired resistance results from gene change and/or exchange by either mutation or horizontal gene transfer.
- Barcodes
individual sequences that are added to each DNA fragment during NGS library preparation to allow for the identification and sorting of reads after sequencing. Especially useful when libraries from a large number of samples are sequenced simultaneously (multiplexing) in high‐throughput sequencing.
- Bin
partial genome of an organism obtained after assembly of raw sequence reads into contigs and clustering of the contigs that belong together
- Binning
is the process of grouping reads or contigs and assigning them to operational taxonomic units.
- Bioinformatics
collection, storage, and analysis of genome sequence data
- cgMLST scheme
A cgMLST scheme is a fixed and agreed upon number of genes for each species or group of closely related species that is ideally suited to standardise whole genome sequencing (WGS) based bacterial genotyping.
- Clade
Monophyletic group, is a group of organisms that consists of a common ancestor and all its lineal descendants.
- Clonal complexes (CC)
A clonal complex is a group of organisms based on the sequence similarity of a chosen target
- Conjugation
Main mechanism of horizontal gene transfer that consists on the direct cell‐to‐cell contact between two closely related bacteria and transfer of plasmids.
- Core genome
those parts of the genome shared by all members of a defined subset of bacteria.
- Coverage
is the average number of sequencing reads representing a given nucleotide, i.e. the average number of times a specific nucleotide base is read during sequencing. It is calculated from the length of the original genome, the number of reads, and the average read length. A high coverage may decrease errors in assembly.
- Data dimensionality
in statistics, it refers to how many explanatory variables (or attributes) a data set has. High dimensional data contains a high number of attributes, possibly exceeding the number of observations.
- Dimensionality reduction (see page 17, Section 3.3.2 )
In statistics, machine learning, and information theory, dimensionality reduction or dimension reduction is the process of reducing the number of random variables under consideration by obtaining a set of principal variables.
- Discriminatory power
the ability to distinguish between strains that should be considered unrelated in the epidemiological context of the application purpose.
- Epidemiological data
a data set describing the sample unit (e.g. date and place of sampling, type of sample and origin of sample, for example animal/food/feed) which needs to be coupled with molecular typing data when a bacterial isolate can be obtained from the sample.
- EU Reference Laboratories (EURLs)
laboratories for feed and food, which, among others: (i) shall be responsible for providing national reference laboratories (NRLs) with details of analytical methods, including reference methods and reference materials and (ii) coordinating, within their area of competence, practical arrangements needed to apply new analytical methods and informing NRLs of advances in this field. The activities of reference laboratories should cover all the areas of feed and food law and animal health, in particular those areas where there is a need for standardised and harmonised analytical results. These laboratories are supported in the scope of Regulation (EC) No 882/2004.
- Genetic drift
refers to random fluctuations (i.e. increases and decreases by chance over time) in the numbers of gene variants in a population.
- Genomic/genetic diversity
Genetic diversity is the total number of genetic differences between organisms both between and within populations.
- Genome wide association study (GWAS)
Investigation of the association of a genome‐wide set of genetic variants in different strains to a certain phenotypic trait.
- Homology
any similarity between characteristics that is due to their shared ancestry.
- Functional metagenomics
study of the functionality of complex microbial communities through the construction and screening of metagenomic libraries, or collections of clones which express the genetic information from an environmental sample in a routinely culturable surrogate host.
- Genetic marker
gene or DNA sequence which can be used to identify a particular microbial species or subtype or to predict a particular phenotype (e.g. growth potential, virulence potential, antimicrobial resistance, etc.).
- Horizontal gene transfer
the passing of genetic information among cells that do not necessarily share a common parent by processes other than descent.
- Intrinsic AMR (or insensitivity)
innate tolerance to a specific antimicrobial agent/class shared by all members of a bacterial group (species level or above), i.e. the wild‐type population, due to inherent structural or functional characteristics.
- Lineage
a group of bacteria all of which share an ancestor, usually used to define clonal subgroups within bacterial populations.
- Metadata
Data that defines and describes other data. Metadata can be associated with the sample collection, with the isolate or with the sequence. Metadata should be supplied according to the sample type (epidemiological data), according to the testing performed or according to the operations performed information (technical data) that is held as a description of stored sequencing data.
- Natural selection
Differential survival or reproduction of different genotypes in a population leading to changes in the gene frequencies of a population.
- Next generation sequencing
A high‐throughput method used to determine the nucleotide sequence of a genome or of a portion of it. This technique utilises DNA sequencing technologies that are capable of processing multiple DNA sequences in parallel. Also called massively parallel sequencing and NGS.
- Metagenomics
study by high throughput sequencing of the genetic material recovered from a specific sample, directly or after the amplification of a selected gene marker.
- Metatranscriptomics
the study of the complete set of RNA transcripts that are produced by the metagenome.
- Mobile genetic element
A piece of genetic material that is capable of moving its location within a genome or is transferable from one cell to another cell. Different types of mobile genetic elements are known, e.g. transposons, plasmids, integrons, bacteriophage elements.
- Monitoring
in agreement with the Directive 2003/99/EC, the term ‘monitoring’ will be applied to a system of collecting, analysing and disseminating data on the occurrence of zoonoses, zoonotic agents and antimicrobial resistance related thereto.
- Multilocus sequence typing (MLST)
- refers to the sequencing of multiple genes or a genetic locus, displaying enough polymorphism to be used in a typing scheme. These are ideally ‘house‐keeping’ genes, i.e. genes encoding enzymes that are involved in primary metabolism of the organism in question and which are therefore present in all isolates.
- Ribosomal Multilocus Sequence Typing (rMLST) is a similar approach to MLST that indexes variation of the 53 genes encoding the bacterial ribosome protein subunits (rps genes) as a means of integrating microbial taxonomy and typing.14
- Whole genome MLST (wgMLST) is defined as a non‐redundant set of genes that are present across a set of genomes representing a species, akin to a pan‐genome. Consequently, a wgMLST scheme includes a greater number of genes and may also include highly variable elements such as repetitive genes and pseudogenes, if they are present in any included genome (Pearce et al., 2018).
- Core genome MLST (cgMLST) schemes balance the number of loci used in a scheme with the maximum possible resolution, by including those loci present in the majority of isolates (ranging from 95% to 99%) in a given grouping of bacteria. Ideally these genes reflect the true genealogy within the species and do not change presence over time; and elements not under strict selection pressures, such as repetitive genes and pseudogenes should be excluded (Pearce et al., 2018).
- Multilocus variable‐number tandem‐repeat analysis (MLVA)
method used to perform molecular typing utilising the naturally occurring variation in the number of tandem repeated DNA sequences found in many different loci in the genome of a variety of organisms.15
- Node (in network analysis)
(social) network analysis characterises networked structures, by mapping and measuring the relationships between connected entities. The nodes in the network are the entities (individuals or groups) while the links show relationships or flows between the nodes.
- NRLs
National reference laboratories
- One Health
has been defined as the collaborative effort of multiple disciplines — working locally, nationally, and globally — to attain optimal health for people, animals and the environment.
- Phylogeny
refers to the evolutionary relationships between organisms.
- Pipeline
computational algorithms for detecting and interpreting variants from alignment of genomic sequences.
- Pulsed‐field gel electrophoresis (PFGE)
is a variant of the restriction endonuclease analysis (REA); a technique to separate long strands of DNA though an agarose gel matrix and visualised as bands. The discriminatory power of PFGE depends on the number and distribution of restriction sites throughout the genome, including extra‐chromosomal DNA, which define the number and sizes of bands in the profile, and can be increased by using different or combinations of restriction endonucleases.
- Resistome
collection of genes in a (meta)genome conferring resistance to antimicrobials – usually refers to acquired resistance.
- Sequence type (ST)
Numerical designation for a particular allelic DNA sequence profile. Originally, seven loci are indexed for which each unique sequence for each loci is assigned an arbitrary and unique allele number which is incorporated into the allelic profile. STs are used in multilocus sequence typing schemes as the unit of comparison based on the record of allelic variants. Isolates that possess identical alleles for all sequences are assigned to a common Sequence Type (ST).
- Serotyping
classification scheme based on the antigenic or sequence‐based detection of bacteria surface molecules, for the Enterobacteriaceae refers specifically the lipopolysaccharide somatic O antigen and the flagella H antigen(s)
- Serogroup identification
classification of bacteria based on the antigenic or sequence‐based detection of bacteria surface molecules, with respect to E. coli refers specifically to the lipopolysaccharide somatic O antigen
- Single Nucleotide Polymorphism (SNP)
A single‐nucleotide polymorphism,(SNP), is a substitution of a single nucleotide that occurs at a specific position in the genome.
- Single nucleotide polymorphism (SNP) typing
SNP genotyping is the measurement of genetic variations of single nucleotide polymorphisms (SNPs) between members of a species.
- Shotgun metagenomics
technique which involves the fragmentation and subsequent sequencing, assembly and annotation of total genomic DNA isolated from a given simple, allowing to gain information on its entire gene content.
- Standardisation
process of implementing and developing technical standards based on the consensus of different parties that include firms, users, interest groups, standards organisations and governments.
- Strain
A strain is considered a pure culture, and a uniform population of bacteria that is genetically different from other populations of the same species, possessing a set of defined characteristics. A strain is often used as a laboratory reference, or maintained by subculture.
- Subspecies
in bacterial taxonomy subgroups of a specie that differ in their phenotypic or genotypic characteristics.
- Subtype
a grouping of bacteria within a species that share certain characteristics, usually derived by molecular typing (molecular or genotypic subtype). Proteins, such as toxins, may also be divided into subtypes
- Transcriptomics
the study of the complete set of RNA transcripts that are produced by the genome.
- Wet laboratory
laboratories where chemicals, drugs or other biological matter are tested and analysed, in contrast to a dry laboratory where computational or applied mathematical analyses are done with assistance of computer generated models
- Validation
Establishment of the performance characteristics of a method and provision of objective evidence that the particular requirements for a specified intended use are fulfilled. Results obtained by an alternative method should demonstrate that they are comparable to those obtained by the reference method.
- Whole genome (including accessory genome)
genomic sequence(s) and their associated metadata.
- Whole genome sequencing (WGS)
process of determining the DNA sequence of an organism's genome using total genomic DNA as input
Abbreviations
- AMR
antimicrobial resistance
- ANSES
Agence Nationale Sécurité Sanitaire Alimentaire Nationale
- ARDB
Antibiotic Resistance Database
- AST
antimicrobial susceptibility testing
- CC
clonal complex(es)
- CDC
Centers for Disease Control and Prevention
- CEN
European Committee for Standardization
- CFU
colony forming unit
- cgMLST
core genome MLST
- DDBJ
DNA Data Bank of Japan
- EAEC
enteroaggregative E. coli
- EBI
European Bioinformatics Institute
- ECDC
European Centre for Disease Prevention and Control
- EFSA
European Food Safety Authority
- EIEC
enteroinvasive E. coli
- ENA
European Nucleotide Archive
- EPEC
Enteropathogenic E. coli
- ESBL
extended‐spectrum beta‐lactamase
- EQA
external quality assessment
- ETEC
enterotoxigenic E. coli
- EURL
European Union Reference Laboratory
- EVIRA
Finnish Food Safety Authority
- FWD
Food‐ and waterborne disease
- GWAS
genome‐wide association studies
- HUS
haemolytic uraemic syndrome
- INSDC
International Sequence Database Collaboration
- ISO
International Organization for Standardization
- ISS
Istituto superiore di sanità
- LPS
lipopolysaccharide
- MDR
multidrug resistant
- MIC
minimum inhibitory concentration
- MOST
Metric Oriented Sequence Typer
- MLST
multilocus sequence typing
- MLVA
multilocus variable‐number tandem repeat analysis
- MoU
memorandum of understanding
- MRA
microbial risk assessment
- MS
Member State
- NARMS
National Antimicrobial Resistance Monitoring System
- NCBI
National Center for Biotechnology
- NCP
National Control Programmes
- NGS
next generation sequencing
- NRL
National reference laboratory(ies)
- OTU
operative taxonomic unit
- PATRIC
Pathosystems Resource Integration Center
- PFGE
pulsed‐field gel electrophoresis
- PHE
Public Health England
- PMA
propidium monoazide
- QMRA
quantitative microbiological risk assessment
- ROA
Rapid Outbreak Assessment
- RIVM
Netherlands National Institute for Public Health and the Environment
- rMLST
ribosomal MLST
- RTE
ready‐to‐eat
- SOP
standard operation procedure
- SRA
Sequence Read Archive
- SRST2
short read sequence typing 2
- STEC
Shigatoxin‐producing Escherichia coli
- SNP
single‐nucleotide polymorphism
- SSI
Statens Serum Institut (SSI),
- SWOT
strengths, weaknesses, opportunities, threats
- ST
sequence type
- THL
Finnish National Institute for Health and Welfare
- ToR
Terms of Reference
- UA
University of Aberdeen
- VBNC
viable but non‐culturable
- VTEC
verotoxigenic Escherichia coli
- wgMLST
whole genome MLST
- WGS
whole genome sequencing
- WMS
whole metagenome sequencing
Appendix A – Closing data gaps for performing risk assessment on L. monocytogenes in ready‐to‐eat (RTE) Foods – activity 3: the comparison of isolates from different compartments along the food chain, and from humans using whole genome sequencing (WGS) analysis, LISEQ (SSI/ANSES/PHE/UA)
1.
An external scientific report entitled Closing gaps for performing a risk assessment on Listeria monocytogenes in ready‐to‐eat (RTE) foods: activity 3, the comparison of isolates from different compartments along the food chain, and from humans using whole genome sequencing (WGS) analysis (hereafter named LISEQ) was published in 2017 (Møller Nielsen et al., 2017). LISEQ was produced in the context of a contract between EFSA and a consortium of contractors, namely Statens Serum Institut (SSI), French Agency for Food, Environmental and Occupational Health & Safety (ANSES), Public Health England (PHE) and University of Aberdeen (UA).
LISEQ aimed at comparing isolates of L. monocytogenes collected in the EU and originated from ready‐to‐eat (RTE) foods, from compartments along the food chain and from human cases using whole genome sequencing (WGS).
For this purpose, a total of 1,143 L. monocytogenes isolates were selected, including 333 human clinical isolates and 810 isolates from the food chain.
Briefly, high‐quality DNA was extracted from all isolates and pair‐end sequenced on the Illumina HiSeq sequencing platform. Short reads were de novo assembled and the assembled genomes were annotated in terms of protein coding features and RNA features. The molecular characterisation of a selection of L. monocytogenes isolates originating from different compartments was achieved employing three gene‐by‐gene‐based typing schemes performed on the assembled genome. The classical 7‐locus MLST (Ragon et al., 2008) scheme hosted at the Pasteur Institute database allowed the identification of sequence types (STs) further assigned to Clonal Complexes (CCs). This analysis was followed by the 1,748‐locus core genome (cg) MLST scheme analysis proposed by Moura et al. (2016) and by a 30‐locus ribosomial (r) MLST scheme analysis. Microbial typing methods provided the framework to answer questions on genetic diversity and epidemiological relationships. The STs that were identified via the 7‐locus MLST and that best represented each CC, underwent the single nucleotide polymorphism (SNP) analysis. This was done to maximise the phylogenetic resolution. The phylogenetic representations of the strain population structures provided the framework to assess the diversity of L. monocytogenes within and between the different sources at the lineage, CC and strain level.
L. monocytogenes contains a large number of variants. The extension to which this variation, or genetic diversity, may differ by source reservoirs or from humans was characterised. The Simpson's Diversity Index was employed to obtain an estimate of the diversity of strains by source (Simpson, 1949); the rarefaction curve technique was used to indicate whether all the L. monocytogenes genotypes had been sampled; and the Nei's genetic distance method (Nei, 1975), applied to genetic locus and SNP data, was used to explore whether populations had genotypes in common (Manly, 2007). These three measures gave an overall understanding of the diversity within and between sources/reservoirs and allowed the differences to be statistically tested.
The epidemiological relationship of L. monocytogenes from the different sources was achieved using two approaches. The first was the source attribution method as defined in Pires et al. (2009). Source attribution modelling was based on the host animal (e.g. ovine, bovine, piscine etc.). Since information is available on the animal origin of the food matrix (e.g. the origin of the milk is known, bovine/sheep/goat, for milk and milk products) the different foods could be linked to their host animal. The sources of isolates and their respective genomes were determined by combining all the isolates that originated from a particular reservoir. Human clinical listeriosis cases were attributed to these sources by comparing the genotypic subtypes (MLST, cgMLST, core genome SNPs, etc.) from the human and source isolates. These data were further used in five mathematical models, i.e. Dutch model, Hald model, STRUCTURE, Asymmetric Island model and Aberdeen model. The second approach identified clusters of clinical and food isolates based on SNP differences. WGS data were analysed along with the epidemiological information to assess retrospectively relationships between L. monocytogenes strains circulating in EU in 2010–2012.
Putative markers conferring the potential to survive/multiply in the food chain and/or cause disease in humans, i.e. antibiotic resistance genes, virulence factors, genes implicated in persistence, and markers of host association were searched in the LISEQ collection.
The suitability of WGS in outbreak investigation was also evaluated in a retrospective analysis of isolates from nine outbreaks of human listeriosis selected with respect to a range of different characteristics (food source, time span, geography, number of cases, etc.). The sequences from each outbreak were analysed together with all other isolates of the same CC in the LISEQ project regardless of epidemiological relationship to the outbreak. The high‐discriminatory methods employed for characterising the diversity of isolates within outbreaks were SNP and 1748‐locus cgMLST analyses.
Appendix B – Establishing next generation sequencing ability for genomic analysis in Europe (ENGAGE)
1.
The aim of the ENGAGE project, also co‐funded by EFSA (Grant number: GP/EFSA/AFSCO/2015/01), was to establish scientific collaboration between the public health, food and veterinary sectors among European laboratories to build capacity for WGS and bioinformatics analysis in food safety and public health protection. An external Scientific Report was published on June 2018 (Hendriksen et al., 2018). The consortium of contractors were, namely Danish Technical University‐National Food Institute (DTU Food) Istituto Zooprofilattico Sperimentale del Lazio e della Toscana (IZSLT) from Italy, German Federal Institute for Risk Assessment (BfR), National Institute of Public Health–National Institute of Hygiene (NIPH‐NIH) from Poland, National Veterinary Research Institute (NVRI) from Poland, Public Health England (PHE), Animal and Plant Health Agency (APHA) in England, and Istituto Zooprofilattico Sperimentale delle Venezie (IZSVe) from Italy. The ENGAGE consortium opted to focus on exchanging expertise, developing and providing training and conducting proficiency tests on WGS, providing consensus quality parameters on NGS outputs applied to WGS‐based characterisation of bacterial pathogens, providing benchmarking exercises on bioinformatics tools and producing SOPs and training materials. The project implemented joint proof‐of‐concept WGS tools in projects that focused on subtypes of Escherichia coli and Salmonella spp. to investigate genetic diversity, epidemiological links, virulence and AMR of isolates from different compartments. The ENGAGE consortium included isolates from the nine most common Salmonella serotypes from both humans and food/animals, commensal E. coli as well as multidrug resistant (MDR)/extended‐spectrum beta‐lactamase (ESBL) producing Salmonella and E. coli from the EU AMR monitoring programmes. It was also decided to keep the list flexible to target future emerging subtypes. Additional relevant and already available genomes were identified among the partners for both proof‐of‐concept and benchmarking activities.
Altogether six benchmarking exercises were conducted:
de novo assembly tools: SPAdes 3.9 vs Velvet 1.2
benchmarking of genotypic Salmonella serotype prediction
benchmarking of genotypic Salmonella serotype prediction complying to the Draft International Standard ISO 16140‐6 (ISO/DIS 16140‐6 Microbiology of the food chain –Method validation – Part 6: Protocol for the validation of alternative (proprietary) methods for microbiological confirmation and typing procedures)
genotypic detection of antimicrobial resistance (AMR) genes
Salmonella Enteritidis phylogeny
Campylobacter coli phylogeny.
Appendix C – Analytical platform and standard procedures for the integration of WGS to surveillance and the outbreak investigation of food‐borne pathogens in the context of small countries with limited resources (INNUENDO)
1.
An external scientific report entitled ‘INNUENDO: A cross‐sectoral platform for the integration of genomics in the surveillance of food‐borne pathogens was published in 2018 (Llarena et al., 2018). The INNUENDO project received co‐funding from EFSA (GP/EFSA/AFSCO/2015/01/CT2) in response to the call ‘‘New approaches in identifying and characterising microbial and chemical hazards’.
The project INNUENDO (https://sites.google.com/site/theinnuendoproject/) aimed to design an analytical platform and standard procedures for the use of whole genome sequencing (WGS) in the surveillance, outbreak detection and investigation of food‐borne pathogens in the context of small countries with limited resources. In the project, several objectives were defined including: identifying functionalities, flaws and needs in data flow during outbreak investigations; designing bioinformatics solutions, and a flexible and portable software platform for the analysis of WGS data from the major food‐borne bacterial pathogens; developing a standard reactive framework to assess the effectiveness of using WGS in food‐borne pathogen surveillance and outbreak investigation; and evaluating the possibilities of efficient utilisation of WGS‐based information in solving outbreaks. To achieve these goals, a user‐centred design strategy involving the end‐users, such as microbiologists in public health and veterinary authorities, in every step of the design, development and implementation phases of the analytical platform and of its components (including bioinformatic tools and communication protocols) was applied.
Within the remit of the project a rapid methodology for in silico typing of E. coli from raw sequence reads was developed. The rationale was to deploy to the INNUENDO Platform user a rapid methodology for assigning to predefined pathotypes (suing the patho_typing module) and serotypes (using the seq_typing module) strains of E. coli at early stage of the WGS‐based analysis. The method was designed to accommodate the needs identified by the public health and food/veterinary authorities participating to the project. The definition of E. coli pathotypes was based on the classification used at the Finnish National Institute for Health and Welfare (THL) and at the Finnish Food Safety Authority (EVIRA), largely according to (Nyholm, 2016). In order to validate the efficiency of the patho_typing module, raw reads of 655 E. coli strains belonging to different pathotypes were selected from the available literature (Dallman et al., 2013; von Mentzer et al., 2014; Grande et al., 2016; Ingle et al., 2016b; Pettengill et al., 2016): 20 Enteroaggregative E. coli (EAEC), 26 Enteroinvasive E. coli (EIEC), 198 EPEC, 268 Enterotoxigenic E. coli (ETEC), 55 Shigella spp. and 98 STEC. Using EnteroBase prediction as reference methodology, the ability of the seq_typing module in predicting E. coli serotype using SerotypeFinder (https://cge.cbs.dtu.dk/services/SerotypeFinder/) database was evaluated on a large set of public available genomes. To sample several times each O and H type, up to two strains from each available O/H combination type were selected. Raw fastq reads for a total of 2,719 samples were downloaded from the European Nucleotide Archive (ENA) or Sequence Read Archive (SRA) using getSeqENA (https://github.com/B-UMMI/getSeqENA).
During the development of the INNUENDO platform, three major exercises were organised with the scope of providing feedback to the INNUENDO developers on the usability of the platform and its tools, and for providing evidences on the added value of shared WGS‐based molecular typing data in the identification and investigation of food‐borne outbreaks. Through these exercises, the user's ability to complete one or more tasks using the platform (i.e. proof‐of‐concept studies) was measured while the efficiency, user‐friendliness and satisfaction with all aspects of the platform, with special interest in sequence upload, graphics, the interface and communication protocols, was evaluated. The proof‐of‐concept studies performed in the context of the usability tests consisted of observing how well the phylogenetic framework worked to identify clusters and how the add‐on software can predict in silico pathotype and serotype, and to predict the presence of resistance and virulence genes.
A first usability test was performed during a workshop in Vitoria‐Gasteiz (Spain) where approximately forty students acted as central national authorities. Students were divided in 10 groups of four which performed a simulation experiment on a set of well‐characterised STEC strains from an US outbreak (Rusconi et al., 2016) using the first prototype version of the INNUENDO platform.
The second was a usability test conducted at national level in Finland (Finnish public health and veterinary authorities). For this exercise, the participants analysed a set of 26 isolates of E. coli of human, food, animals and environmental origin from three documented STEC outbreaks happened in Finland in August 2016 (Kinnula et al., 2018). The users were told to communicate cluster‐detections to the corresponding authorities by E‐mail and deliver outbreak‐reports to the study organisers. A logbook was kept concurrently by the study organisers to document the investigation process and evaluate the data flow and functionalities of the platform.
A third exercise was a remote usability evaluation with twelve authorities across the EU. The outbreak isolates were the same as used in the second usability test (Kinnula et al., 2018). A total of 120 genomes were divided between the participants, ensuring that each participant received samples belonging to one of the three previously identified clusters. The participants were instructed to trace back the source (food, animal or environmental) that possibly caused the outbreak through email communication. The participants playing food laboratories were given additional source information that was not visible to all on the INNUENDO platform. They were expected to communicate this information with other participants involved in outbreak investigation. However, no epidemiological information (such as person identification, symptoms, place of infection, date of sampling, or connection to farms) was given to public health laboratories.
Appendix D – ECDC/EFSA joint Rapid Outbreak Assessments (ROAs)
1.
Coordination at EU level is crucial when there are multi‐country food‐borne outbreaks. One aspect of this coordination is the joint production of a rapid outbreak assessment (ROA) by EFSA and ECDC in close cooperation with affected countries. The joint ROA gives an overview of the situation in terms of public health and aims to identify the contaminated food vehicle that caused the human infections. It also includes trace‐back and trace‐forward investigations to identify the origin of the outbreak and where contaminated food products have been distributed. This is crucial to identify the relevant control measures in order to prevent further spread of the outbreak.
In May 2011, during the STEC O104:H4 outbreak, ECDC published the so called ‘Rapid risk assessment for the outbreak of STEC in Germany’. This led to discussions with EFSA resulting in the development of a joint procedure to collaborate across sectors/agencies in situations of multi‐country food‐borne outbreaks with the aim to draft/publish the ROA reports.
Since 2017, ROAs have been using WGS to provide evidence for the microbiological link between the human and the non‐human isolates in the scope of the multi‐country food‐borne outbreaks. Hypotheses about the implicated food vehicles have been formulated by:
searching for profiles matching the outbreak strain in the joint EFSA‐ECDC molecular typing database (currently only including PFGE and MLVA types and intended to be expanded with WGS data. This expansion should take place most probably during 2020–2021);
consulting the relevant EURLs and their NRL‐networks;
extracting relevant data from RASFF notifications;
interviewing recent human cases about consumption of the suspected food vehicle and
performing joint WGS analysis (based on cgMLST and/or SNP analysis) of human and non‐human isolates, supporting the epidemiological and traceability investigations. Until now this joint WGS analysis has been done by ECDC, EFSA, the relevant EURLs and public health microbiology laboratories.
The joint ROAs represent a multisectorial approach and collaboration between public health authorities (follow‐up of human cases), food safety authorities (investigations of the suspected food vehicle), laboratories (typing of isolates), risk assessors and risk managers.
Until now eight joint ECDC‐EFSA ROAs have been published including WGS analysis (listed below):
Multi‐country outbreak of new Salmonella enterica 11:z41:e,n,z15 infections associated with sesame seeds (2017) (EFSA and ECDC, 2017a);
Multi‐country outbreak of Salmonella Enteritidis infections linked to Polish eggs (2017) (EFSA and ECDC, 2017b);
Multi country Salmonella Agona outbreak possibly linked to ready‐to‐eat food (2018) (EFSA and ECDC, 2018g);
Multi‐country outbreak of Listeria monocytogenes serogroup IVb, multi‐locus sequence type 6, infections probably linked to frozen corn (2018) (EFSA and ECDC, 2018d,e);
Multi‐country outbreak of Salmonella Agona infections linked to infant formula (2018) (EFSA and ECDC, 2018f);
Multi‐country outbreak of Listeria monocytogenes ST8 infections linked to the consumption of salmon products (2018) (EFSA and ECDC, 2018c);
Multi‐country outbreak of Salmonella Poona infections linked to consumption of infant formula (2019) (ECDC and EFSA, 2019b);
Multi‐country outbreak of Listeria monocytogenes clonal complex 8 infections linked to consumption of cold‐smoked fish products (2019) (ECDC and EFSA, 2019a).
Appendix E – Uncertainty analysis
1.
The uncertainty analysis defines on a qualitative way the sources or location of the main uncertainties related to the impact of NGS on food‐borne microbiological risk assessment, source attribution and outbreak investigation. It is expected that NGS will further impact the way food‐borne microbiological risk assessment, source attribution and outbreak investigation will be carried out in the future and will replace or complement most of the current used methodologies. A higher impact would mean that a quicker and more fundamental transition of the methodology would take place as currently concluded in the Opinion; a lower impact would indicate the opposite, a slower and less fundamental transition process.
The nature or the causes of the uncertainties are described as well as their impact on the possible use of WGS and metagenomics for microbiological risk assessment, source attribution and outbreak investigation (Table E.1).
Suggested citation: EFSA BIOHAZ Panel (EFSA Panel on Biological Hazards) , Koutsoumanis K, Allende A, Alvarez‐Ordóñez A, Bolton D, Bover‐Cid S, Chemaly M, Davies R, De Cesare A, Hilbert F, Lindqvist R, Nauta M, Peixe L, Ru G, Simmons M, Skandamis P, Suffredini E, Jenkins C, Malorny B, Ribeiro Duarte AS, Torpdahl M, da Silva Felício MT, Guerra B, Rossi M and Herman L, 2019. Scientific Opinion on the whole genome sequencing and metagenomics for outbreak investigation, source attribution and risk assessment of food‐borne microorganisms. EFSA Journal 2019;17(12):5898, 78 pp. 10.2903/j.efsa.2019.5898
Requestor: EFSA
Question number: EFSA‐Q‐2018‐00058
Panel members: Ana Allende, Avelino Alvarez‐Ordóñez, Declan Bolton, Sara Bover‐Cid, Marianne Chemaly, Robert Davies, Alessandra De Cesare, Lieve Herman, Friederike Hilbert, Kostas Koutsoumanis, Roland Lindqvist, Maarten Nauta, Luisa Peixe, Giuseppe Ru, Marion Simmons, Panagiotis Skandamis and Elisabetta Suffredini.
Acknowledgements: The Panel wishes to thank Eleonora Sarno for her contributions to the drafting of this scientific output.
Adopted: 23 October 2019
Notes
EFSA (European Food Safety Authority), Aerts M, Battisti A, Hendriksen R, Kempf I, Teale C, Tenhagen B‐A, Veldman K, Wasyl D, Guerra B, Liébana E, Thomas‐López D and Belœil P‐A, 2019. Technical specifications on harmonised monitoring of antimicrobial resistance in zoonotic and indicator bacteria from food‐producing animals and food. EFSA Journal 2019;17:e05709. https://doi.org/10.2903/j.efsa.2019.5709
These external scientific reports have been published on 29 June 2018 (Hendriksen et al., 2018) and on 26 November 2018 (Llarena et al., 2018), respectively.
This external scientific report has been published on 16 May 2018 ((Technical University of Denmark ‐National Food Institute, 2018).
Commission Regulation (EU) No 200/2010 of 10 March 2010 implementing Regulation (EC) No 2160/2003 of the European Parliament and of the Council as regards a Union target for the reduction of the prevalence of Salmonella serotypes in adult breeding flocks of Gallus gallus (Text with EEA relevance). OJ L 61, 11.3.2010, p. 1–9.
Commission Regulation (EU) No 517/2011 of 25 May 2011 implementing Regulation (EC) No 2160/2003 of the European Parliament and of the Council as regards a Union target for the reduction of the prevalence of certain Salmonella serotypes in laying hens of Gallus gallus and amending Regulation (EC) No 2160/2003 and Commission Regulation (EU) No 200/2010 (Text with EEA relevance). OJ L 138, 26.5.2011, p. 45–51.
Commission Regulation (EU) No 200/2012 of 8 March 2012 concerning a Union target for the reduction of Salmonella enteritidis and Salmonella Typhimurium in flocks of broilers, as provided for in Regulation (EC) No 2160/2003 of the European Parliament and of the Council (Text with EEA relevance). OJ L 71, 9.3.2012, p. 31–36.
Commission Regulation (EU) No 1190/2012 of 12 December 2012 concerning a Union target for the reduction of Salmonella Enteritidis and Salmonella Typhimurium in flocks of turkeys, as provided for in Regulation (EC) No 2160/2003 of the European Parliament and of the Council (Text with EEA relevance). OJ L 340, 13.12.2012, p. 29–34.
Regulation (EC) No 2160/2003 of the European Parliament and of the Council of 17 November 2003 on the control of salmonella and other specified food‐borne zoonotic agents. OJ L 325, 12.12.2003, p. 1–15.
Commission Regulation (EC) No 2073/2005 of 15 November 2005 on microbiological criteria for foodstuffs. OJ L 338, 22.12.2005, p. 1–26.
Regulation (EC) No 882/2004 of the European Parliament and of the Council of 29 April 2004 on official controls performed to ensure the verification of compliance with feed and food law, animal health and animal welfare rules. OJ L 165, 30.4.2004, p. 1–141.
EN ISO 16140‐6: 2019. Microbiology of the food chain — Method validation — Part 6: Protocol for the validation of alternative (proprietary) methods for microbiological confirmation and typing procedures. International Organization for Standardization, Geneva.
References
- Aarestrup FM and Koopmans MG, 2016. Sharing data for global infectious disease surveillance and outbreak detection. Trends in Microbiology, 24, 241–245. 10.1016/j.tim.2016.01.009 [DOI] [PubMed] [Google Scholar]
- Achtman M, Wain J, Weill FX, Nair S, Zhou Z, Sangal V, Krauland MG, Hale JL, Harbottle H, Uesbeck A, Dougan G, Harrison LH and Brisse S, 2012. Multilocus sequence typing as a replacement for serotyping in Salmonella enterica . PLoS Pathogens, 8, e1002776 10.1371/journal.ppat.1002776 [DOI] [PMC free article] [PubMed] [Google Scholar]
- Albertsen M, Karst SM, Ziegler AS, Kirkegaard RH and Nielsen PH, 2015. Back to basics – the influence of DNA extraction and primer choice on phylogenetic analysis of activated sludge communities. PLoS ONE, 10, e0132783 10.1371/journal.pone.0132783 [DOI] [PMC free article] [PubMed] [Google Scholar]
- Alikhan NF, Zhou Z, Sergeant MJ and Achtman M, 2018. A genomic overview of the population structure of Salmonella . PLoS Genetics, 14, e1007261 10.1371/journal.pgen.1007261 [DOI] [PMC free article] [PubMed] [Google Scholar]
- Allard MW, Luo Y, Strain E, Pettengill J, Timme R, Wang C, Li C, Keys CE, Zheng J, Stones R, Wilson MR, Musser SM and Brown EW, 2013. On the evolutionary history, population genetics and diversity among isolates of Salmonella Enteritidis PFGE pattern JEGX01.0004. PLoS ONE, 8, e55254 10.1371/journal.pone.0055254 [DOI] [PMC free article] [PubMed] [Google Scholar]
- Allard MW, Strain E, Melka D, Bunning K, Musser SM, Brown EW and Timme R, 2016. Practical value of food pathogen traceability through building a whole‐genome sequencing network and database. Journal of Clinical Microbiology, 54, 1975–1983. 10.1128/jcm.00081-16 [DOI] [PMC free article] [PubMed] [Google Scholar]
- Andersen SC, Kiil K, Harder CB, Josefsen MH, Persson S, Nielsen EM and Hoorfar J, 2017. Towards diagnostic metagenomics of Campylobacter in fecal samples. BMC Microbiology, 17, 133 10.1186/s12866-017-1041-3 [DOI] [PMC free article] [PubMed] [Google Scholar]
- Anonymous , 2018. Annual report on zoonoses in Denmark 2017. National Food Institute, Technical University of Denmark. [Google Scholar]
- Ashton PM, Nair S, Peters TM, Bale JA, Powell DG, Painset A, Tewolde R, Schaefer U, Jenkins C, Dallman TJ, de Pinna EM and Grant KA, 2016. Identification of Salmonella for public health surveillance using whole genome sequencing. PeerJ, 4, e1752 10.7717/peerj.1752 [DOI] [PMC free article] [PubMed] [Google Scholar]
- Auffret MD, Dewhurst RJ, Duthie C‐A, Rooke JA, John Wallace R, Freeman TC, Stewart R, Watson M and Roehe R, 2017. The rumen microbiome as a reservoir of antimicrobial resistance and pathogenicity genes is directly affected by diet in beef cattle. Microbiome, 5, 159 10.1186/s40168-017-0378-z [DOI] [PMC free article] [PubMed] [Google Scholar]
- den Bakker HC, Moreno Switt AI, Govoni G, Cummings CA, Ranieri ML, Degoricija L, Hoelzer K, Rodriguez‐Rivera LD, Brown S, Bolchacova E, Furtado MR and Wiedmann M, 2011. Genome sequencing reveals diversification of virulence factor content and possible host adaptation in distinct subpopulations of Salmonella enterica . BMC Genomics, 12, 425 10.1186/1471-2164-12-425 [DOI] [PMC free article] [PubMed] [Google Scholar]
- Barco L, Barrucci F, Olsen JE and Ricci A, 2013. Salmonella source attribution based on microbial subtyping. International Journal of Food Microbiology, 163, 193–203. 10.1016/j.ijfoodmicro.2013.03.005 [DOI] [PubMed] [Google Scholar]
- Beaulaurier J, Zhu S, Deikus G, Mogno I, Zhang XS, Davis‐Richardson A, Canepa R, Triplett EW, Faith JJ, Sebra R, Schadt EE and Fang G, 2018. Metagenomic binning and association of plasmids with bacterial host genomes using DNA methylation. Nature Biotechnology, 36, 61–69. 10.1038/nbt.4037 [DOI] [PMC free article] [PubMed] [Google Scholar]
- Beitel CW, Froenicke L, Lang JM, Korf IF, Michelmore RW, Eisen JA and Darling AE, 2014. Strain‐ and plasmid‐level deconvolution of a synthetic metagenome by sequencing proximity ligation products. PeerJ, 2, e415 10.7717/peerj.415 [DOI] [PMC free article] [PubMed] [Google Scholar]
- Bergholz TM, Moreno Switt AI and Wiedmann M, 2014. Omics approaches in food safety: fulfilling the promise? Trends in Microbiology, 22, 275–281. 10.1016/j.tim.2014.01.006 [DOI] [PMC free article] [PubMed] [Google Scholar]
- Besser J, Carleton HA, Gerner‐Smidt P, Lindsey RL and Trees E, 2018. Next‐generation sequencing technologies and their application to the study and control of bacterial infections. Clinical Microbiology & Infection, 24, 335–341. 10.1016/j.cmi.2017.10.013 [DOI] [PMC free article] [PubMed] [Google Scholar]
- den Besten HMW, Amezquita A, Bover‐Cid S, Dagnas S, Ellouze M, Guillou S, Nychas G, O'Mahony C, Perez‐Rodriguez F and Membre JM, 2018. Next generation of microbiological risk assessment: potential of omics data for exposure assessment. International Journal of Food Microbiology, 287, 18–27. 10.1016/j.ijfoodmicro.2017.10.006 [DOI] [PubMed] [Google Scholar]
- Borowiak M, Fischer J, Hammerl JA, Hendriksen RS, Szabo I and Malorny B, 2017. Identification of a novel transposon‐associated phosphoethanolamine transferase gene, mcr‐5, conferring colistin resistance in d‐tartrate fermenting Salmonella enterica subsp. enterica serovar Paratyphi B. Journal of Antimicrobial Chemotherapy, 72, 3317–3324. 10.1093/jac/dkx327 [DOI] [PubMed] [Google Scholar]
- Borowiak M, Hammerl JA, Deneke C, Fischer J, Szabo I and Malorny B, 2019. Characterization of mcr‐5‐Harboring Salmonella enterica subsp. enterica Serovar Typhimurium isolates from animal and food origin in Germany. Antimicrobial Agents and Chemotherapy, 63, 298. 10.1128/aac.00063-19 [DOI] [PMC free article] [PubMed] [Google Scholar]
- Botelho J, Roberts AP, Leon‐Sampedro R, Grosso F and Peixe L, 2018a. Carbapenemases on the move: it's good to be on ICEs. Mobile DNA, 9, 37 10.1186/s13100-018-0141-4 [DOI] [PMC free article] [PubMed] [Google Scholar]
- Botelho J, Roberts AP, León‐Sampedro R, Grosso F and Peixe L, 2018b. Carbapenemases on the move: it's good to be on ICE. bioRxiv, 392894. 10.1101/392894 [DOI] [PMC free article] [PubMed] [Google Scholar]
- Bronowski C, Fookes MC, Gilderthorp R, Ashelford KE, Harris SR, Phiri A, Hall N, Gordon MA, Wain J, Hart CA, Wigley P, Thomson NR and Winstanley C, 2013. Genomic characterisation of invasive non‐typhoidal Salmonella enterica subspecies enterica serovar Bovismorbificans isolates from Malawi. PLoS Neglected Tropical Diseases, 7, e2557 10.1371/journal.pntd.0002557 [DOI] [PMC free article] [PubMed] [Google Scholar]
- Burton JN, Liachko I, Dunham MJ and Shendure J, 2014. Species‐level deconvolution of metagenome assemblies with Hi‐C‐based contact probability maps. G3 (Bethesda), 4, 1339–1346. 10.1534/g3.114.011825 [DOI] [PMC free article] [PubMed] [Google Scholar]
- Byrne L, Elson R, Dallman TJ, Perry N, Ashton P, Wain J, Adak GK, Grant KA and Jenkins C, 2014. Evaluating the use of multilocus variable number tandem repeat analysis of Shiga toxin‐producing Escherichia coli O157 as a routine public health tool in England. PLoS ONE, 9, e85901 10.1371/journal.pone.0085901 [DOI] [PMC free article] [PubMed] [Google Scholar]
- Byrne L, Jenkins C, Launders N, Elson R and Adak GK, 2015. The epidemiology, microbiology and clinical impact of Shiga toxin‐producing Escherichia coli in England, 2009–2012. Epidemiology and Infection, 143, 3475–3487. 10.1017/s0950268815000746 [DOI] [PMC free article] [PubMed] [Google Scholar]
- Byrne L, Adams N, Glen K, Dallman TJ, Kar‐Purkayastha I, Beasley G, Willis C, Padfield S, Adak G and Jenkins C, 2016. Epidemiological and microbiological investigation of an outbreak of severe disease from Shiga toxin‐producing Escherichia coli O157 infection associated with consumption of a slaw garnish. Journal of Food Protection, 79, 1161–1168. 10.4315/0362-028x.Jfp-15-580 [DOI] [PubMed] [Google Scholar]
- Byrne L, Dallman TJ, Adams N, Mikhail AFW, McCarthy N and Jenkins C, 2018. Highly pathogenic clone of Shiga toxin‐producing Escherichia coli O157:H7, England and Wales. Emerging Infectious Diseases, 24, 2303–2308. 10.3201/eid2412.180409 [DOI] [PMC free article] [PubMed] [Google Scholar]
- Calle ML, 2019. Statistical analysis of metagenomics data. Genomics Inform, 17, e6 10.5808/GI.2019.17.1.e6 [DOI] [PMC free article] [PubMed] [Google Scholar]
- Carrico JA, Rossi M, Moran‐Gilad J, Van Domselaar G and Ramirez M, 2018. A primer on microbial bioinformatics for nonbioinformaticians. Clinical Microbiology & Infection, 24, 342–349. 10.1016/j.cmi.2017.12.015 [DOI] [PubMed] [Google Scholar]
- Charalampous T, Kay GL, Richardson H, Aydin A, Baldan R, Jeanes C, Rae D, Grundy S, Turner DJ, Wain J, Leggett RM, Livermore DM and O'Grady J, 2019. Nanopore metagenomics enables rapid clinical diagnosis of bacterial lower respiratory infection. Nature Biotechnology, 37, 783–792. 10.1038/s41587-019-0156-5 [DOI] [PubMed] [Google Scholar]
- Chattaway MA, Dallman TJ, Gentle A, Wright MJ, Long SE, Ashton PM, Perry NT and Jenkins C, 2016. Whole genome sequencing for public health surveillance of Shiga toxin‐producing Escherichia coli other than serogroup O157. 7. 10.3389/fmicb.2016.00258 [DOI] [PMC free article] [PubMed]
- Che Y, Xia Y, Liu L, Li A‐D, Yang Y and Zhang T, 2019. Mobile antibiotic resistome in wastewater treatment plants revealed by Nanopore metagenomic sequencing. Microbiome, 7, 44 10.1186/s40168-019-0663-0 [DOI] [PMC free article] [PubMed] [Google Scholar]
- Chen Y, Ross WH, Gray MJ, Wiedmann M, Whiting RC and Scott VN, 2006. Attributing risk to Listeria monocytogenes subgroups: dose response in relation to genetic lineages. Journal of Food Protection, 69, 335–344. 10.4315/0362-028x-69.2.335 [DOI] [PubMed] [Google Scholar]
- Chen Y, Ross WH, Whiting RC, Van Stelten A, Nightingale KK, Wiedmann M and Scott VN, 2011. Variation in Listeria monocytogenes dose responses in relation to subtypes encoding a full‐length or truncated internalin A. Applied and Environment Microbiology, 77, 1171 10.1128/AEM.01564-10 [DOI] [PMC free article] [PubMed] [Google Scholar]
- Chen EZ, Bushman FD and Li H, 2017. A model‐based approach for species abundance quantification based on shotgun metagenomic data. Staistics in Biosciences, 9, 13–27. 10.1007/s12561-016-9148-x [DOI] [PMC free article] [PubMed] [Google Scholar]
- Cheng L, Connor TR, Siren J, Aanensen DM and Corander J, 2013. Hierarchical and spatially explicit clustering of DNA sequences with BAPS software. Molecular Biology and Evolution, 30, 1224–1228. 10.1093/molbev/mst028 [DOI] [PMC free article] [PubMed] [Google Scholar]
- Cisneros JJL, Aarestrup FM and Lund O, 2018. Public health surveillance using decentralized technologies. Blockchain in. Health Care Today. [Google Scholar]
- Clooney AG, Fouhy F, Sleator RD, Od A, Stanton C, Cotter PD and Claesson MJ, 2016. Comparing apples and oranges?: next generation sequencing and its impact on microbiome analysis. PLoS ONE, 11, e0148028 10.1371/journal.pone.0148028 [DOI] [PMC free article] [PubMed] [Google Scholar]
- Cocolin L, Mataragas M, Bourdichon F, Doulgeraki A, Pilet M‐F, Jagadeesan B, Rantsiou K and Phister T, 2018. Next generation microbiological risk assessment meta‐omics: the next need for integration. International Journal of Food Microbiology, 287, 10–17. 10.1016/j.ijfoodmicro.2017.11.008 [DOI] [PubMed] [Google Scholar]
- Coleman M, Elkins C, Gutting B, Mongodin E, Solano‐Aguilar G and Walls I, 2018. Microbiota and dose response: evolving paradigm of health triangle. Risk Analysis, 38, 2013–2028. 10.1111/risa.13121 [DOI] [PubMed] [Google Scholar]
- Collineau L, Boerlin P, Carson CA, Chapman B, Fazil A, Hetman B, McEwen SA, Parmley EJ, Reid‐Smith RJ, Taboada EN and Smith BA, 2019. Integrating whole‐genome sequencing data Into quantitative risk assessment of food‐borne antimicrobial resistance: a review of opportunities and challenges. Frontiers in Microbiology, 10, 1107 10.3389/fmicb.2019.01107 [DOI] [PMC free article] [PubMed] [Google Scholar]
- Corander J and Marttinen P, 2006. Bayesian identification of admixture events using multilocus molecular markers. Molecular Ecology, 15, 2833–2843. 10.1111/j.1365-294X.2006.02994.x [DOI] [PubMed] [Google Scholar]
- Corander J, Waldmann P and Sillanpaa MJ, 2003. Bayesian analysis of genetic differentiation between populations. Genetics, 163, 367–374. [DOI] [PMC free article] [PubMed] [Google Scholar]
- Corander J, Marttinen P, Siren J and Tang J, 2008. Enhanced Bayesian modelling in BAPS software for learning genetic structures of populations. BMC Bioinformatics, 9, 539 10.1186/1471-2105-9-539 [DOI] [PMC free article] [PubMed] [Google Scholar]
- Dallman T, Cross L, Bishop C, Perry N, Olesen B, Grant KA and Jenkins C, 2013. Whole genome sequencing of an unusual serotype of Shiga toxin‐producing Escherichia coli . Emerging Infectious Diseases, 19, 1302–1304. 10.3201/eid1908.130016 [DOI] [PMC free article] [PubMed] [Google Scholar]
- Dallman TJ, Ashton PM, Byrne L, Perry NT, Petrovska L, Ellis R, Allison L, Hanson M, Holmes A, Gunn GJ, Chase‐Topping ME, Woolhouse MEJ, Grant KA, Gally DL, Wain J and Jenkins C, 2015. Applying phylogenomics to understand the emergence of Shiga‐toxin‐producing Escherichia coli O157:H7 strains causing severe human disease in the UK. Microbial Genomics, 1, 13 10.1099/mgen.0.000029 [DOI] [PMC free article] [PubMed] [Google Scholar]
- Day M, Doumith M, Jenkins C, Dallman TJ, Hopkins KL, Elson R, Godbole G and Woodford N, 2017. Antimicrobial resistance in Shiga toxin‐producing Escherichia coli serogroups O157 and O26 isolated from human cases of diarrhoeal disease in England, 2015. Journal of Antimicrobial Chemotherapy, 72, 145–152. 10.1093/jac/dkw371 [DOI] [PubMed] [Google Scholar]
- DebRoy C, Roberts E and Fratamico PM, 2011. Detection of O antigens in Escherichia coli . Animal Health Research Reviews, 12, 169–185. 10.1017/s1466252311000193 [DOI] [PubMed] [Google Scholar]
- DebRoy C, Fratamico PM and Roberts E, 2018. Molecular serogrouping of Escherichia coli . Animal Health Research Reviews, 19, 1–16. 10.1017/S1466252317000093 [DOI] [PubMed] [Google Scholar]
- Deng X, Desai P, den Bakker H, Mikoleit M, Tolar B, Hyytia‐Trees E, Hendriksen R, Frye JG, Porwollik S, Weimer B, Wiedmann M, Weinstock G, Fields P and McClelland M, 2014. Genomic epidemiology of Salmonella enterica serotype Enteritidis based on population structure of prevalent lineages. Emerging Infectious Diseases, 20, 1481–1489. 10.3201/eid2009.131095 [DOI] [PMC free article] [PubMed] [Google Scholar]
- Desai PT, Porwollik S, Long F, Cheng P, Wollam A, Clifton SW, Weinstock GM and McClelland M, 2013. Evolutionary genomics of Salmonella enterica subspecies. mBio, 4, e00579–e00512. 10.1128/mBio.00579-12 [DOI] [PMC free article] [PubMed] [Google Scholar]
- Do Nascimento V, Day MR, Doumith M, Hopkins KL, Woodford N, Godbole G and Jenkins C, 2017. Comparison of phenotypic and WGS‐derived antimicrobial resistance profiles of enteroaggregative Escherichia coli isolated from cases of diarrhoeal disease in England, 2015–16. Journal of Antimicrobial Chemotherapy, 72, 3288–3297. 10.1093/jac/dkx301 [DOI] [PubMed] [Google Scholar]
- Dos SRC, Koopmans MP and Haringhuizen GB, 2018. Threats to timely sharing of pathogen sequence data. Science, 362, 404–406. 10.1126/science.aau5229 [DOI] [PubMed] [Google Scholar]
- Doumith M, Godbole G, Ashton P, Larkin L, Dallman T, Day M, Day M, Muller‐Pebody B, Ellington MJ, de Pinna E, Johnson AP, Hopkins KL and Woodford N, 2016. Detection of the plasmid‐mediated mcr‐1 gene conferring colistin resistance in human and food isolates of Salmonella enterica and Escherichia coli in England and Wales. Journal of Antimicrobial Chemotherapy, 71, 2300–2305. 10.1093/jac/dkw093 [DOI] [PubMed] [Google Scholar]
- ECDC (European Centre for Disease Prevention and Control), 2018a. Eighth external quality assessment scheme for Salmonella typing. Stockholm: ECDC. Available online: https://ecdc.europa.eu/sites/portal/files/documents/salmonella-external-quality-assessment-eight-2018.pdf
- ECDC (European Centre for Disease Prevention and Control), 2018b. Fifth external quality assessment scheme for Listeria monocytogenes typing. Stockholm: ECDC. Available online: https://ecdc.europa.eu/sites/portal/files/documents/Fifth-EQA-Listeria-monocytogenes-August-2018.pdf
- ECDC (European Centre for Disease Prevention and Control), 2019a. External quality assessment scheme for typing of Shiga toxin‐producing Escherichia coli. Stockholm: ECDC. Available online: https://ecdc.europa.eu/sites/portal/files/documents/EQA-8%20STEC.pdf
- ECDC (European Centre for Disease Prevention and Control), 2019b. Proficiency test for Listeria monocytogenes whole genome assembly 2018. Stockholm: ECDC. Available online: https://www.ecdc.europa.eu/en/publications-data/proficiency-test-listeria-monocytogenes-whole-genome-assembly-2018
- ECDC and EFSA (European Centre for Disease Prevention and Control and European Food Safety and Authority), 2019a. Multi‐country outbreak of Listeria monocytogenes clonal complex 8 infections linked to consumption of cold‐smoked fish products. EFSA Supporting Publications 2019:EN‐1665 10.2903/sp.efsa.2019.EN-1665 [DOI] [Google Scholar]
- ECDC and EFSA (European Centre for Disease Prevention and Control and European Food Safety and Authority), 2019b. Multi‐country outbreak of Salmonella Poona infections linked to consumption of infant formula. EFSA Supporting Publications 2019:EN‐1594 10.2903/sp.efsa.2019.EN-1594 [DOI] [Google Scholar]
- ECDC and EFSA (European Centre for Disease Prevention and Control and European Food Safety and Authority), Van Walle I, Guerra B, Borges V, André Carriço J, Cochrane G, Dallman T, Franz E, Karpíšková R, Litrup E, Mistou M‐Y, Morabito S, Mossong J, Alm E, Barrucci F, Bianchi C, Costa G, Kotila S, Mangone I, Palm D, Pasinato L, Revez J, Struelens M, Thomas‐López D and Rizzi V, 2019. EFSA and ECDC technical report on the collection and analysis of whole genome sequencing data from food‐borne pathogens and other relevant microorganisms isolated from human, animal, food, feed and food/feed environmental samples in the joint ECDC‐EFSA molecular typing database. EFSA Supporting Publications 2019:EN‐1337. 10.2903/sp.efsa.2019.EN-1337 [DOI]
- EFSA (European Food Safety and Authority), 2015. EFSA's 20th scientific colloquium on whole genome sequencing of food‐borne pathogens for public health protection. EFSA Supporting Publications 2015:EN‐743 10.2903/sp.efsa.2015.EN-743 [DOI] [Google Scholar]
- EFSA (European Food Safety and Authority), Aerts M, Battisti A, Hendriksen R, Kempf I, Teale C, Tenhagen B‐A, Veldman K, Wasyl D, Guerra B, Liébana E, Thomas‐López D and Belœil P‐A, 2019. Technical specifications on harmonised monitoring of antimicrobial resistance in zoonotic and indicator bacteria from food‐producing animals and food. EFSA Journal 2019;17 (6):5709, 122 pp. 10.2903/j.efsa.2019.5709 [DOI] [PMC free article] [PubMed] [Google Scholar]
- EFSA and ECDC (European Food Safety and Authority and European Centre for Disease Prevention and Control), 2017a. Multi‐country outbreak of new Salmonella enterica 11:z41: e, n, z15 infections associated with sesame seeds. EFSA Supporting Publications 2017:EN‐1256 10.2903/sp.efsa.2017.EN-1256 [DOI] [Google Scholar]
- EFSA and ECDC (European Food Safety and Authority and European Centre for Disease Prevention and Control), 2017b. Multi‐country outbreak of Salmonella Enteritidis infections linked to Polish eggs. EFSA Supporting Publications 2017:EN‐1353 10.2903/sp.efsa.2017.EN-1353 [DOI] [Google Scholar]
- EFSA and ECDC (European Food Safety and Authority and European Centre for Disease Prevention and Control), 2018a. The European Union summary report on antimicrobial resistance in zoonotic and indicator bacteria from humans, animals and food in 2016. EFSA Journal 2018;16 (2):5182, 270 pp. 10.2903/j.efsa.2018.5182 [DOI] [PMC free article] [PubMed] [Google Scholar]
- EFSA and ECDC (European Food Safety and Authority and European Centre for Disease Prevention and Control), 2018b. The European Union summary report on trends and sources of zoonoses, zoonotic agents and food‐borne outbreaks in 2017. EFSA Journal 2018;16 (12):5500, 262 pp. 10.2903/j.efsa.2018.5500 [DOI] [PMC free article] [PubMed] [Google Scholar]
- EFSA and ECDC (European Food Safety and Authority and European Centre for Disease Prevention and Control), 2018c. Multi‐country outbreak of Listeria monocytogenes sequence type 8 infections linked to consumption of salmon products. EFSA Supporting Publications 2018:EN‐1496 10.2903/sp.efsa.2018.EN-1496 [DOI] [Google Scholar]
- EFSA and ECDC (European Food Safety and Authority and European Centre for Disease Prevention and Control), 2018d. Multi‐country outbreak of Listeria monocytogenes serogroup IVb, multi‐locus sequence type 6, infections linked to frozen corn and possibly to other frozen vegetables – first update. EFSA Supporting Publications 2018:EN‐1448 10.2903/sp.efsa.2018.EN-1448 [DOI] [Google Scholar]
- EFSA and ECDC (European Food Safety and Authority and European Centre for Disease Prevention and Control), 2018e. Multi‐country outbreak of Listeria monocytogenes serogroup IVb, multi‐locus sequence type 6, infections probably linked to frozen corn. EFSA Supporting Publications 2018:EN‐1402. 10.2903/sp.efsa.2018.EN-1402 [DOI]
- EFSA and ECDC (European Food Safety and Authority and European Centre for Disease Prevention and Control), 2018f. Multi‐country outbreak of Salmonella Agona infections linked to infant formula. EFSA Supporting Publications 2018:EN‐1365 10.2903/sp.efsa.2018.EN-1365 [DOI] [Google Scholar]
- EFSA and ECDC (European Food Safety and Authority and European Centre for Disease Prevention and Control), 2018g. Multi‐country outbreak of Salmonella Agona infections possibly linked to ready‐to‐eat food. EFSA Supporting Publications 2018:EN‐1465 10.2903/sp.efsa.2018.EN-1465 [DOI] [Google Scholar]
- EFSA BIOHAZ Panel (EFSA Panel on Biological Hazards), 2013a. Scientific Opinion on the evaluation of molecular typing methods for major food‐borne microbiological hazards and their use for attribution modelling, outbreak investigation and scanning surveillance: part 1 (evaluation of methods and applications). EFSA Journal 2013;11 (12):3502, 84 pp. 10.2903/j.efsa.2013.3502 [DOI] [Google Scholar]
- EFSA BIOHAZ Panel (EFSA Panel on Biological Hazards), 2013b. Scientific Opinion on VTEC‐seropathotype and scientific criteria regarding pathogenicity assessment. EFSA Journal 2013;11 (4):3138, 106 pp. 10.2903/j.efsa.2013.3138 [DOI] [Google Scholar]
- EFSA BIOHAZ Panel (EFSA Panel on Biological Hazards), 2014. Scientific Opinion on the evaluation of molecular typing methods for major food‐borne microbiological hazards and their use for attribution modelling, outbreak investigation and scanning surveillance: part 2 (surveillance and data management activities). EFSA Journal 2014;12 (7):3784, 46 pp. 10.2903/j.efsa.2014.3784 [DOI] [Google Scholar]
- EFSA Scientific Committee , 2018. Guidance on uncertainty analysis in scientific assessments. EFSA Journal 2018;16 (1):5123, 39 pp. 10.2903/j.efsa.2018.5123 [DOI] [PMC free article] [PubMed] [Google Scholar]
- Ellington MJ, Ekelund O, Aarestrup FM, Canton R, Doumith M, Giske C, Grundman H, Hasman H, Holden MTG, Hopkins KL, Iredell J, Kahlmeter G, Koser CU, MacGowan A, Mevius D, Mulvey M, Naas T, Peto T, Rolain JM, Samuelsen O and Woodford N, 2017. The role of whole genome sequencing in antimicrobial susceptibility testing of bacteria: report from the EUCAST Subcommittee. Clinical Microbiology & Infection, 23, 2–22. 10.1016/j.cmi.2016.11.012 [DOI] [PubMed] [Google Scholar]
- Erkus O, de Jager VC, Geene RT, van Alen‐Boerrigter I, Hazelwood L, van Hijum SA, Kleerebezem M and Smid EJ, 2016. Use of propidium monoazide for selective profiling of viable microbial cells during Gouda cheese ripening. International Journal of Food Microbiology, 228, 1–9. 10.1016/j.ijfoodmicro.2016.03.027 [DOI] [PubMed] [Google Scholar]
- EURL‐VTEC , 2019. Report of the first inter‐laboratory exercise on Whole Genome Sequencing of Shiga toxin‐producing Escherichia coli strains 2017‐2018 (PT‐WGS1). Available online: http://old.iss.it/binary/vtec/cont/Report_PT_WGS1_Rev2.pdf
- Falush D, Stephens M and Pritchard JK, 2003. Inference of population structure using multilocus genotype data: linked loci and correlated allele frequencies. Genetics, 164, 1567–1587. [DOI] [PMC free article] [PubMed] [Google Scholar]
- FAO (Food and Agriculture Organization of the United Nations), 2016. Applications of whole genome sequencing in food safety management. Available online: http://www.fao.org/3/a-i5619e.pdf
- Franz E, Delaquis P, Morabito S, Beutin L, Gobius K, Rasko DA, Bono J, French N, Osek J, Lindstedt BA, Muniesa M, Manning S, LeJeune J, Callaway T, Beatson S, Eppinger M, Dallman T, Forbes KJ, Aarts H, Pearl DL, Gannon VP, Laing CR and Strachan NJ, 2014. Exploiting the explosion of information associated with whole genome sequencing to tackle Shiga toxin‐producing Escherichia coli (STEC) in global food production systems. International Journal of Food Microbiology, 187, 57–72. 10.1016/j.ijfoodmicro.2014.07.002 [DOI] [PubMed] [Google Scholar]
- Franz E, Gras LM and Dallman T, 2016. Significance of whole genome sequencing for surveillance, source attribution and microbial risk assessment of food‐borne pathogens. Current Opinion in Food Science, 8, 74–79. 10.1016/j.cofs.2016.04.004 [DOI] [Google Scholar]
- Fritsch L, Guillier L and Augustin J‐C, 2018. Next generation quantitative microbiological risk assessment: refinement of the cold smoked salmon‐related listeriosis risk model by integrating genomic data. Microbial Risk Analysis, 10, 20–27. 10.1016/j.mran.2018.06.003 [DOI] [Google Scholar]
- Fritsch L, Felten A, Palma F, Mariet JF, Radomski N, Mistou MY, Augustin JC and Guillier L, 2019. Insights from genome‐wide approaches to identify variants associated to phenotypes at pan‐genome scale: application to L. monocytogenes’ ability to grow in cold conditions. International Journal of Food Microbiology, 291, 181–188. 10.1016/j.ijfoodmicro.2018.11.028 [DOI] [PubMed] [Google Scholar]
- Gerner‐Smidt P, Carleton H and Trees E, 2017. Role of whole genome sequencing in the public health surveillance of food‐borne pathogens In: Deng X, den Bakker HC. and Hendriksen RS. (eds.). Applied Genomics of Foodborne Pathogens. Springer International Publishing, Cham: pp. 1–11. [Google Scholar]
- Gillesberg Lassen S, Ethelberg S, Bjorkman JT, Jensen T, Sorensen G, Kvistholm Jensen A, Muller L, Nielsen EM and Molbak K, 2016. Two Listeria outbreaks caused by smoked fish consumption‐using whole‐genome sequencing for outbreak investigations. Clinical Microbiology & Infection, 22, 620–624. 10.1016/j.cmi.2016.04.017 [DOI] [PubMed] [Google Scholar]
- Gilmour MW, Graham M, Van Domselaar G, Tyler S, Kent H, Trout‐Yakel KM, Larios O, Allen V, Lee B and Nadon C, 2010. High‐throughput genome sequencing of two Listeria monocytogenes clinical isolates during a large food‐borne outbreak. BMC Genomics, 11, 120 10.1186/1471-2164-11-120 [DOI] [PMC free article] [PubMed] [Google Scholar]
- Gobin M, Hawker J, Cleary P, Inns T, Gardiner D, Mikhail A, McCormick J, Elson R, Ready D, Dallman T, Roddick I, Hall I, Willis C, Crook P, Godbole G, Tubin‐Delic D and Oliver I, 2018. National outbreak of Shiga toxin‐producing Escherichia coli O157:H7 linked to mixed salad leaves, United Kingdom, 2016. Euro Surveillance, 23, 17–00197. 10.2807/1560-7917.ES.2018.23.18.17-00197 [DOI] [PMC free article] [PubMed] [Google Scholar]
- Goodwin S, McPherson JD and McCombie WR, 2016. Coming of age: ten years of next‐generation sequencing technologies. Nature Reviews Genetics, 17, 333 10.1038/nrg.2016.49 [DOI] [PMC free article] [PubMed] [Google Scholar]
- Gordon NC, Price JR, Cole K, Everitt R, Morgan M, Finney J, Kearns AM, Pichon B, Young B, Wilson DJ, Llewelyn MJ, Paul J, Peto TE, Crook DW, Walker AS and Golubchik T, 2014. Prediction of Staphylococcus aureus antimicrobial resistance by whole‐genome sequencing. Journal of Clinical Microbiology, 52, 1182–1191. 10.1128/jcm.03117-13 [DOI] [PMC free article] [PubMed] [Google Scholar]
- Grande L, Michelacci V, Bondi R, Gigliucci F, Franz E, Badouei MA, Schlager S, Minelli F, Tozzoli R, Caprioli A and Morabito S, 2016. Whole‐genome characterization and strain comparison of VT2f‐producing Escherichia coli causing hemolytic uremic syndrome. Emerging Infectious Diseases, 22, 2078–2086. 10.3201/eid2212.160017 [DOI] [PMC free article] [PubMed] [Google Scholar]
- Griffiths E, Dooley D, Graham M, Van Domselaar G, Brinkman FSL and Hsiao WWL, 2017. Context is everything: harmonization of critical food microbiology descriptors and metadata for improved food safety and surveillance. Frontiers in Microbiology, 8, 1068 10.3389/fmicb.2017.01068 [DOI] [PMC free article] [PubMed] [Google Scholar]
- Grimont P and Weill F‐X, 2007. Antigenic formulae of the Salmonella serovars. WHO Collaborating Centre for Reference and Research on Salmonella. Institute Pasteur, Paris. 166 pp.
- Gupta S, Arango‐Argoty G, Zhang L, Pruden A and Vikesland P, 2019. Identification of discriminatory antibiotic resistance genes among environmental resistomes using extremely randomized tree algorithm. Microbiome, 7, 123 10.1186/s40168-019-0735-1 [DOI] [PMC free article] [PubMed] [Google Scholar]
- Gymoese P, Sorensen G, Litrup E, Olsen JE, Nielsen EM and Torpdahl M, 2017. Investigation of outbreaks of Salmonella enterica serovar Typhimurium and its monophasic variants using whole‐genome sequencing, Denmark. Emerging Infectious Diseases, 23, 1631–1639. 10.3201/eid2310.161248 [DOI] [PMC free article] [PubMed] [Google Scholar]
- Haddad N, Johnson N, Kathariou S, Métris A, Phister T, Pielaat A, Tassou C, Wells‐Bennik MHJ and Zwietering MH, 2018. Next generation microbiological risk assessment—potential of omics data for hazard characterisation. International Journal of Food Microbiology, 287, 28–39. 10.1016/j.ijfoodmicro.2018.04.015 [DOI] [PubMed] [Google Scholar]
- Hald T, Vose D, Wegener HC and Koupeev T, 2004. A Bayesian approach to quantify the contribution of animal‐food sources to human salmonellosis. Risk Analysis, 24, 255–269. 10.1111/j.0272-4332.2004.00427.x [DOI] [PubMed] [Google Scholar]
- Head SR, Komori HK, LaMere SA, Whisenant T, Nieuwerburgh FV, Salomon DR and Ordoukhanian P, 2014. Library construction for next‐generation sequencing: overviews and challenges. BioTechniques, 56, 61–77. 10.2144/000114133 [DOI] [PMC free article] [PubMed] [Google Scholar]
- Hendriksen RS, Pedersen SK, Leekitcharoenphon P, Malorny B, Borowiak M, Battisti A, Franco A, Alba P, Carfora V, Ricci A, Mastrorilli E, Losasso C, Longo A, Petrin S, Barco L, Wołkowicz T, Gierczyński R, Zacharczuk K, Wolaniuk N, Wasyl D, Zajac M, Wieczorek K, Pόłtorak K, Petrovska‐Holmes L, Davies R, Tang Y, Grant K, Underwood A, Dallman T, Painset A, Hartman H, Al‐Shabib A and Cowley L, 2018. Final report of ENGAGE ‐ Establishing Next Generation sequencing Ability for Genomic analysis in Europe.e01431E. 10.2903/sp.efsa.2018.EN-1431 [DOI]
- Hendriksen RS, Bortolaia V, Tate H, Tyson GH, Aarestrup FM and McDermott DF, 2019a. Using genomics to track global antimicrobial resistance. Frontiers in Public Health. 7, 242. 10.3389/fpubh.2019.00242 [DOI] [PMC free article] [PubMed] [Google Scholar]
- Hendriksen RS, Munk P, Njage P, van Bunnik B, McNally L, Lukjancenko O, Roder T, Nieuwenhuijse D, Pedersen SK, Kjeldgaard J, Kaas RS, Clausen P, Vogt JK, Leekitcharoenphon P, van de Schans MGM, Zuidema T, de Roda Husman AM, Rasmussen S, Petersen B, Amid C, Cochrane G, Sicheritz‐Ponten T, Schmitt H, Alvarez JRM, Aidara‐Kane A, Pamp SJ, Lund O, Hald T, Woolhouse M, Koopmans MP, Vigre H, Petersen TN and Aarestrup FM, 2019b. Global monitoring of antimicrobial resistance based on metagenomics analyses of urban sewage. Nature Communications, 10, 1124 10.1038/s41467-019-08853-3 [DOI] [PMC free article] [PubMed] [Google Scholar]
- Hu Y, Wang Z, Qiang B, Xu Y, Chen X, Li Q and Jiao X, 2019. Loss and gain in the evolution of the Salmonella enterica serovar Gallinarum biovar Pullorum genome. mSphere, 4 10.1128/mSphere.00627-18 [DOI] [PMC free article] [PubMed] [Google Scholar]
- Huang AD, Luo C, Pena‐Gonzalez A, Weigand MR, Tarr CL and Konstantinidis KT, 2017. Metagenomics of two severe food‐borne outbreaks provides diagnostic signatures and signs of coinfection not attainable by traditional methods. Applied and Environment Microbiology, 83, 10.1128/aem.02577-16. [DOI] [PMC free article] [PubMed] [Google Scholar]
- Hung C‐C, Eade CR, Betteken MI, Pavinski Bitar PD, Handley EM, Nugent SL, Chowdhury R and Altier C, 2019. Salmonella invasion is controlled through the secondary structure of the hilD transcript. PLoS Pathogens, 15, e1007700 10.1371/journal.ppat.1007700 [DOI] [PMC free article] [PubMed] [Google Scholar]
- Ibrahim GM and Morin PM, 2018. Salmonella serotyping using whole genome sequencing. Frontiers in Microbiology, 9, 2993 10.3389/fmicb.2018.02993 [DOI] [PMC free article] [PubMed] [Google Scholar]
- Iguchi A, Iyoda S, Kikuchi T, Ogura Y, Katsura K, Ohnishi M, Hayashi T and Thomson NR, 2015. A complete view of the genetic diversity of the Escherichia coli O‐antigen biosynthesis gene cluster. DNA Research, 22, 101–107. 10.1093/dnares/dsu043 [DOI] [PMC free article] [PubMed] [Google Scholar]
- Ingle DJ, Valcanis M, Kuzevski A, Tauschek M, Inouye M, Stinear T, Levine MM, Robins‐Browne RM and Holt KE, 2016a. In silico serotyping of E. coli from short read data identifies limited novel O‐loci but extensive diversity of O: H serotype combinations within and between pathogenic lineages. Microbial Genomoics, 2, e000064 10.1099/mgen.0.000064 [DOI] [PMC free article] [PubMed] [Google Scholar]
- Ingle DJ, Valcanis M, Kuzevski A, Tauschek M, Inouye M, Stinear T, Levines MM, Robins‐Browne RM and Holt KE, 2016b. In silico serotyping of E. coli from short read data identifies limited novel O‐loci but extensive diversity of O:H serotype combinations within and between pathogenic lineages. 2 10.1099/mgen.0.00006 [DOI] [PMC free article] [PubMed] [Google Scholar]
- Inouye M, Dashnow H, Raven LA, Schultz MB, Pope BJ, Tomita T, Zobel J and Holt KE, 2014. SRST2: rapid genomic surveillance for public health and hospital microbiology labs. Genome Medicine, 6, 90 10.1186/s13073-014-0090-6 [DOI] [PMC free article] [PubMed] [Google Scholar]
- Issenhuth‐Jeanjean S, Roggentin P, Mikoleit M, Guibourdenche M, de Pinna E, Nair S, Fields PI and Weill FX, 2014. Supplement 2008‐2010 (no. 48) to the White‐Kauffmann‐Le Minor scheme. Research in Microbiology, 165, 526–530. 10.1016/j.resmic.2014.07.004 [DOI] [PubMed] [Google Scholar]
- Jagadeesan B, Gerner‐Smidt P, Allard MW, Leuillet S, Winkler A, Xiao Y, Chaffron S, Van Der Vossen J, Tang S, Katase M, McClure P, Kimura B, Ching Chai L, Chapman J and Grant K, 2019. The use of next generation sequencing for improving food safety: translation into practice. Food Microbiology, 79, 96–115. 10.1016/j.fm.2018.11.005 [DOI] [PMC free article] [PubMed] [Google Scholar]
- Jellen‐Ritter AS and Kern WV, 2001. Enhanced expression of the multidrug efflux pumps AcrAB and AcrEF associated with insertion element transposition in Escherichia coli mutants selected with a fluoroquinolone. Antimicrobial Agents and Chemotherapy, 45, 1467–1472. 10.1128/aac.45.5.1467-1472.2001 [DOI] [PMC free article] [PubMed] [Google Scholar]
- Jenkins C, 2015. Whole‐genome sequencing data for serotyping Escherichia coli‐it's time for a change!. Journal of Clinical Microbiology, 53, 2402–2403. 10.1128/jcm.01448-15 [DOI] [PMC free article] [PubMed] [Google Scholar]
- Jenkins C, Dallman TJ and Grant KA, 2019. Impact of whole genome sequencing on the investigation of food‐borne outbreaks of Shiga toxin‐producing Escherichia coli serogroup O157:H7, England, 2013 to 2017. Eurosurveillance Weekly, 24, 1800346 10.2807/1560-7917.ES.2019.24.4.1800346 [DOI] [PMC free article] [PubMed] [Google Scholar]
- Joensen KG, Tetzschner AMM, Iguchi A, Aarestrup FM and Scheutz F, 2015. Rapid and easy in silico serotyping of Escherichia coli isolates by use of whole‐genome sequencing data. Journal of Clinical Microbiology, 53, 2410 10.1128/JCM.00008-15 [DOI] [PMC free article] [PubMed] [Google Scholar]
- Joensen KG, Engsbro ALO, Lukjancenko O, Kaas RS, Lund O, Westh H and Aarestrup FM, 2017. Evaluating next‐generation sequencing for direct clinical diagnostics in diarrhoeal disease. European Journal of Clinical Microbiology and Infectious Diseases, 36, 1325–1338. 10.1007/s10096-017-2947-2 [DOI] [PMC free article] [PubMed] [Google Scholar]
- Kanagarajah S, Waldram A, Dolan G, Jenkins C, Ashton PM, Carrion Martin AI, Davies R, Frost A, Dallman TJ, De Pinna EM, Hawker JI, Grant KA and Elson R, 2018. Whole genome sequencing reveals an outbreak of Salmonella Enteritidis associated with reptile feeder mice in the United Kingdom, 2012‐2015. Food Microbiology, 71, 32–38. 10.1016/j.fm.2017.04.005 [DOI] [PubMed] [Google Scholar]
- Karmali MA, Mascarenhas M, Shen S, Ziebell K, Johnson S, Reid‐Smith R, Isaac‐Renton J, Clark C, Rahn K and Kaper JB, 2003. Association of genomic O island 122 of Escherichia coli EDL 933 with verocytotoxin‐producing Escherichia coli seropathotypes that are linked to epidemic and/or serious disease. Journal of Clinical Microbiology, 41, 4930–4940. 10.1128/jcm.41.11.4930-4940.2003 [DOI] [PMC free article] [PubMed] [Google Scholar]
- Kawai T, Sekizuka T, Yahata Y, Kuroda M, Kumeda Y, Iijima Y, Kamata Y, Sugita‐Konishi Y and Ohnishi T, 2012. Identification of Kudoa septempunctata as the causative agent of novel food poisoning outbreaks in Japan by consumption of Paralichthys olivaceus in raw fish. Clinical Infectious Diseases, 54, 1046–1052. 10.1093/cid/cir1040 [DOI] [PubMed] [Google Scholar]
- Kinnula S, Hemminki K, Kotilainen H, Ruotsalainen E, Tarkka E, Salmenlinna S, Hallanvuo S, Leinonen E, Jukka O and Rimhanen‐Finne R, 2018. Outbreak of multiple strains of non‐O157 Shiga toxin‐producing and enteropathogenic Escherichia coli associated with rocket salad, Finland, autumn 2016. Eurosurveillance Weekly, 23, 10.2807/1560-7917.Es.2018.23.35.1700666 [DOI] [PMC free article] [PubMed] [Google Scholar]
- Kleta S, Hammerl JA, Dieckmann R, Malorny B, Borowiak M, Halbedel S, Prager R, Trost E, Flieger A, Wilking H, Vygen‐Bonnet S, Busch U, Messelhausser U, Horlacher S, Schonberger K, Lohr D, Aichinger E, Luber P, Hensel A and Al Dahouk S, 2017. Molecular tracing to find source of protracted invasive listeriosis outbreak, Southern Germany, 2012‐2016. Emerging Infectious Diseases, 23, 1680–1683. 10.3201/eid2310.161623 [DOI] [PMC free article] [PubMed] [Google Scholar]
- de Knegt LV, Pires SM, Lofstrom C, Sorensen G, Pedersen K, Torpdahl M, Nielsen EM and Hald T, 2016. Application of molecular typing results in source attribution models: the case of multiple locus variable number tandem repeat analysis (MLVA) of Salmonella isolates obtained from integrated surveillance in Denmark. Risk Analysis, 36, 571–588. 10.1111/risa.12483 [DOI] [PubMed] [Google Scholar]
- Knudsen BE, Bergmark L, Munk P, Lukjancenko O, Priemé A, Aarestrup FM and Pamp SJ, 2016. Impact of sample type and DNA isolation procedure on genomic inference of microbiome composition. mSystems, 1, e00095–e00016. 10.1128/mSystems.00095-16 [DOI] [PMC free article] [PubMed] [Google Scholar]
- Kovac J, Bakker Hd, Carroll LM and Wiedmann M, 2017. Precision food safety: a systems approach to food safety facilitated by genomics tools. TrAC Trends in Analytical Chemistry, 96, 52–61. 10.1016/j.trac.2017.06.001 [DOI] [Google Scholar]
- Langridge GC, Wain J and Nair S, 2012. Invasive salmonellosis in Humans. EcoSal Plus, 5, 10.1128/ecosalplus.8.6.2.2 [DOI] [PubMed] [Google Scholar]
- Langridge GC, Fookes M, Connor TR, Feltwell T, Feasey N, Parsons BN, Seth‐Smith HM, Barquist L, Stedman A, Humphrey T, Wigley P, Peters SE, Maskell DJ, Corander J, Chabalgoity JA, Barrow P, Parkhill J, Dougan G and Thomson NR, 2015. Patterns of genome evolution that have accompanied host adaptation in Salmonella . Proceedings of the National Academy of Sciences of the United States of America, 112, 863–868. 10.1073/pnas.1416707112 [DOI] [PMC free article] [PubMed] [Google Scholar]
- Lanza VF, Baquero F, Martinez JL, Ramos‐Ruiz R, Gonzalez‐Zorn B, Andremont A, Sanchez‐Valenzuela A, Ehrlich SD, Kennedy S, Ruppe E, van Schaik W, Willems RJ, de la Cruz F and Coque TM, 2018. In‐depth resistome analysis by targeted metagenomics. Microbiome, 6, 11 10.1186/s40168-017-0387-y [DOI] [PMC free article] [PubMed] [Google Scholar]
- Lees JA, Harris SR, Tonkin‐Hill G, Gladstone RA, Lo SW, Weiser JN, Corander J, Bentley SD and Croucher NJ, 2019. Fast and flexible bacterial genomic epidemiology with PopPUNK. Genome Research, 29, 304–316. 10.1101/gr.241455.118 [DOI] [PMC free article] [PubMed] [Google Scholar]
- Leonard SR, Mammel MK, Lacher DW and Elkins CA, 2015. Application of metagenomic sequencing to food safety: detection of Shiga Toxin‐producing Escherichia coli on fresh bagged spinach. Applied and Environment Microbiology, 81, 8183–8191. 10.1128/aem.02601-15 [DOI] [PMC free article] [PubMed] [Google Scholar]
- Leonard SR, Mammel MK, Lacher DW and Elkins CA, 2016. Strain‐level discrimination of Shiga toxin‐producing Escherichia coli in spinach using metagenomic sequencing. PLoS ONE, 11, e0167870 10.1371/journal.pone.0167870 [DOI] [PMC free article] [PubMed] [Google Scholar]
- Li A‐D, Metch JW, Wang Y, Garner E, Zhang AN, Riquelme MV, Vikesland PJ, Pruden A and Zhang T, 2018. Effects of sample preservation and DNA extraction on enumeration of antibiotic resistance genes in wastewater. FEMS Microbiology Ecology, 94, 10.1093/femsec/fix189 [DOI] [PubMed] [Google Scholar]
- Lima T, Domingues S and Da Silva GJ, 2019. Plasmid‐mediated colistin resistance in Salmonella enterica: a review. Microorganisms, 7, 10.3390/microorganisms7020055 [DOI] [PMC free article] [PubMed] [Google Scholar]
- Lin HH and Liao YC, 2016. Accurate binning of metagenomic contigs via automated clustering sequences using information of genomic signatures and marker genes. Scientific Reports, 6, 24175 10.1038/srep24175 [DOI] [PMC free article] [PubMed] [Google Scholar]
- Liu YY, Wang Y, Walsh TR, Yi LX, Zhang R, Spencer J, Doi Y, Tian G, Dong B, Huang X, Yu LF, Gu D, Ren H, Chen X, Lv L, He D, Zhou H, Liang Z, Liu JH and Shen J, 2016. Emergence of plasmid‐mediated colistin resistance mechanism MCR‐1 in animals and human beings in China: a microbiological and molecular biological study. The Lancet Infectious Diseases, 16, 161–168. 10.1016/s1473-3099(15)00424-7 [DOI] [PubMed] [Google Scholar]
- Llarena A‐K, Ribeiro‐Gonçalves BF, Nuno Silva D, Halkilahti J, Machado MP, Da Silva MS, Jaakkonen A, Isidro J, Hämäläinen C, Joenperä J, Borges V, Viera L, Gomes JP, Correia C, Lunden J, Laukkanen‐Ninios R, Fredriksson‐Ahomaa M, Bikandi J, Millan RS, Martinez‐Ballesteros I, Laorden L, Mäesaar M, Grantina‐Ievina L, Hilbert F, Garaizar J, Oleastro M, Nevas M, Salmenlinna S, Hakkinen M, Carriço JA and Rossi M, 2018. INNUENDO: a cross‐sectoral platform for the integration of genomics in the surveillance of food‐borne pathogens. EFSA Supporting Publications 2018:EN‐1498 10.2903/sp.efsa.2018.EN-1498 [DOI] [Google Scholar]
- Loman NJ, Constantinidou C, Christner M, Rohde H, Chan JZ, Quick J, Weir JC, Quince C, Smith GP, Betley JR, Aepfelbacher M and Pallen MJ, 2013. A culture‐independent sequence‐based metagenomics approach to the investigation of an outbreak of Shiga‐toxigenic Escherichia coli O104:H4. JAMA, 309, 1502–1510. 10.1001/jama.2013.3231 [DOI] [PubMed] [Google Scholar]
- Lupolova N, Dallman TJ, Matthews L, Bono JL and Gally DL, 2016. Support vector machine applied to predict the zoonotic potential of E. coli O157 cattle isolates. Proceedings of the National Academy of Sciences of the United States of America, 113, 11312–11317. 10.1073/pnas.1606567113 [DOI] [PMC free article] [PubMed] [Google Scholar]
- Lüth S, Kleta S and Al Dahouk S, 2018. Whole genome sequencing as a typing tool for food‐borne pathogens like Listeria monocytogenes – The way towards global harmonisation and data exchange. Trends in Food Science & Technology, 73, 67–75. 10.1016/j.tifs.2018.01.008 [DOI] [Google Scholar]
- Maiden MC, Jansen van Rensburg MJ, Bray JE, Earle SG, Ford SA, Jolley KA and McCarthy ND, 2013. MLST revisited: the gene‐by‐gene approach to bacterial genomics. Nature Reviews Microbiology, 11, 728–736. 10.1038/nrmicro3093 [DOI] [PMC free article] [PubMed] [Google Scholar]
- Manly BF, 2007. Randomization, bootstrap and Monte Carlo methods in biology. CRC Press, FL, USA. [Google Scholar]
- Martínez JL, Coque TM and Baquero F, 2015. What is a resistance gene? Ranking risk in resistomes. Nature Reviews Microbiology, 13, 116–123. 10.1038/nrmicro3399 [DOI] [PubMed] [Google Scholar]
- Mason A, Foster D, Bradley P, Golubchik T, Doumith M, Gordon NC, Pichon B, Iqbal Z, Staves P, Crook D, Walker AS, Kearns A and Peto T, 2018. Accuracy of different bioinformatics methods in detecting antibiotic resistance and virulence factors from Staphylococcus aureus whole‐genome sequences. Journal of Clinical Microbiology, 56, e01815–e01817. 10.1128/jcm.01815-17 [DOI] [PMC free article] [PubMed] [Google Scholar]
- Mather AE, Vaughan TG and French NP, 2015. Molecular approaches to understanding transmission and source attribution in nontyphoidal Salmonella and their application in Africa. Clinical Infectious Diseases, 61, S259–S265. 10.1093/cid/civ727% [DOI] [PubMed] [Google Scholar]
- Maury MM, Tsai YH, Charlier C, Touchon M, Chenal‐Francisque V, Leclercq A, Criscuolo A, Gaultier C, Roussel S, Brisabois A, Disson O, Rocha EPC, Brisse S and Lecuit M, 2016. Uncovering Listeria monocytogenes hypervirulence by harnessing its biodiversity. Nature Genetics, 48, 308–313. 10.1038/ng.3501 [DOI] [PMC free article] [PubMed] [Google Scholar]
- Maury MM, Bracq‐Dieye H, Huang L, Vales G, Lavina M, Thouvenot P, Disson O, Leclercq A, Brisse S and Lecuit M, 2019. Hypervirulent Listeria monocytogenes clones’ adaption to mammalian gut accounts for their association with dairy products. Nature Communications, 10, 2488 10.1038/s41467-019-10380-0 [DOI] [PMC free article] [PubMed] [Google Scholar]
- McCarthy N, 2017. Campylobacter In: Deng X, den Bakker HC. and Hendriksen RS. (eds.). Applied Genomics of Foodborne Pathogens. Springer International Publishing, Cham: pp. 127–143. [Google Scholar]
- von Mentzer A, Connor TR, Wieler LH, Semmler T, Iguchi A, Thomson NR, Rasko DA, Joffre E, Corander J, Pickard D, Wiklund G, Svennerholm AM, Sjoling A and Dougan G, 2014. Identification of enterotoxigenic Escherichia coli (ETEC) clades with long‐term global distribution. Nature Genetics, 46, 1321–1326. 10.1038/ng.3145 [DOI] [PubMed] [Google Scholar]
- Mikhail AFW, Jenkins C, Dallman TJ, Inns T, Martin AIC, Fox A, Cleary P, Elson R and Hawker J, 2018. An outbreak of Shiga toxin‐producing Escherichia coli O157:H7 associated with contaminated salad leaves: epidemiological, genomic and food trace back investigations. Epidemiology and Infection, 146, 187–196. 10.1017/s0950268817002874 [DOI] [PMC free article] [PubMed] [Google Scholar]
- Møller Nielsen E, Björkman JT, Kiil K, Grant K, Dallman T, Painset A, Amar C, Roussel S, Guillier L, Félix B, Rotariu O, Perez‐Reche F, Forbes K and Strachan N, 2017. Closing gaps for performing a risk assessment on Listeria monocytogenes in ready‐to‐eat (RTE) foods: activity 3, the comparison of isolates from different compartments along the food chain, and from humans using whole genome sequencing (WGS) analysis. EFSA Supporting Publications 2017:EN‐1151 10.2903/sp.efsa.2017.EN-1151 [DOI] [Google Scholar]
- Montero DA, Canto FD, Velasco J, Colello R, Padola NL, Salazar JC, Martin CS, Onate A, Blanco J, Rasko DA, Contreras C, Puente JL, Scheutz F, Franz E and Vidal RM, 2019. Cumulative acquisition of pathogenicity islands has shaped virulence potential and contributed to the emergence of LEE‐negative Shiga toxin‐producing Escherichia coli strains. Emerging Microbes & Infections, 8, 486–502. 10.1080/22221751.2019.1595985 [DOI] [PMC free article] [PubMed] [Google Scholar]
- Mook P, Gardiner D, Verlander NQ, McCormick J, Usdin M, Crook P, Jenkins C and Dallman TJ, 2018. Operational burden of implementing Salmonella Enteritidis and Typhimurium cluster detection using whole genome sequencing surveillance data in England: a retrospective assessment. Epidemiology and Infection, 146, 1452–1460. 10.1017/s0950268818001589 [DOI] [PMC free article] [PubMed] [Google Scholar]
- Morganti M, Bolzoni L, Scaltriti E, Casadei G, Carra E, Rossi L, Gherardi P, Faccini F, Arrigoni N, Sacchi AR, Delledonne M and Pongolini S, 2018. Rise and fall of outbreak‐specific clone inside endemic pulsotype of Salmonella 4,[5],12:i:‐; insights from high‐resolution molecular surveillance in Emilia‐Romagna, Italy, 2012 to 2015. Eurosurveillance Weekly, 23, 10.2807/1560-7917.Es.2018.23.13.17-00375 [DOI] [PMC free article] [PubMed] [Google Scholar]
- Mounier J, Monnet C, Vallaeys T, Arditi R, Sarthou A‐S, Hélias A and Irlinger F, 2008. Microbial interactions within a cheese microbial community. Applied and Environment Microbiology, 74, 172 10.1128/AEM.01338-07 [DOI] [PMC free article] [PubMed] [Google Scholar]
- Moura A, Criscuolo A, Pouseele H, Maury MM, Leclercq A, Tarr C, Bjorkman JT, Dallman T, Reimer A, Enouf V, Larsonneur E, Carleton H, Bracq‐Dieye H, Katz LS, Jones L, Touchon M, Tourdjman M, Walker M, Stroika S, Cantinelli T, Chenal‐Francisque V, Kucerova Z, Rocha EP, Nadon C, Grant K, Nielsen EM, Pot B, Gerner‐Smidt P, Lecuit M and Brisse S, 2016. Whole genome‐based population biology and epidemiological surveillance of Listeria monocytogenes . Nature Microbiology, 2, 16185 10.1038/nmicrobiol.2016.185 [DOI] [PMC free article] [PubMed] [Google Scholar]
- Mughini‐Gras L, Barrucci F, Smid JH, Graziani C, Luzzi I, Ricci A, Barco L, Rosmini R, Havelaar AH, Vanp W and Busani L, 2014. Attribution of human Salmonella infections to animal and food sources in Italy (2002‐2010): adaptations of the Dutch and modified Hald source attribution models. Epidemiology and Infection, 142, 1070–1082. 10.1017/s0950268813001829 [DOI] [PMC free article] [PubMed] [Google Scholar]
- Mughini‐Gras L, Franz E and van Pelt W, 2018a. New paradigms for Salmonella source attribution based on microbial subtyping. Food Microbiology, 71, 60–67. 10.1016/j.fm.2017.03.002 [DOI] [PubMed] [Google Scholar]
- Mughini‐Gras L, Kooh P, Augustin J‐C, David J, Fravalo P, Guillier L, Jourdan‐Da‐Silva N, Thébault A, Sanaa M and Watier L and TAWGoSAoFD , 2018b. Source attribution of foodborne diseases: potentialities, hurdles, and future expectations. 9 10.3389/fmicb.2018.01983 [DOI] [PMC free article] [PubMed] [Google Scholar]
- Mughini‐Gras L, Dorado‐García A, van Duijkeren E, van den Bunt G, Dierikx CM, Bonten MJM, Bootsma MCJ, Schmitt H, Hald T, Evers EG, de Koeijer A, van Pelt W, Franz E, Mevius DJ and Heederik DJJ, 2019. Attributable sources of community‐acquired carriage of Escherichia coli containing β‐lactam antibiotic resistance genes: a population‐based modelling study. The Lancet Planetary Health, 3, e357–e369. 10.1016/S2542-5196(19)30130-5 [DOI] [PubMed] [Google Scholar]
- Mullner P, Jones G, Noble A, Spencer SE, Hathaway S and French NP, 2009. Source attribution of food‐borne zoonoses in New Zealand: a modified Hald model. Risk Analysis, 29, 970–984. 10.1111/j.1539-6924.2009.01224.x [DOI] [PubMed] [Google Scholar]
- Munk P, Andersen VD, de Knegt L, Jensen MS, Knudsen BE, Lukjancenko O, Mordhorst H, Clasen J, Agerso Y, Folkesson A, Pamp SJ, Vigre H and Aarestrup FM, 2017. A sampling and metagenomic sequencing‐based methodology for monitoring antimicrobial resistance in swine herds. Journal of Antimicrobial Chemotherapy, 72, 385–392. 10.1093/jac/dkw415 [DOI] [PubMed] [Google Scholar]
- Munk P, Knudsen BE, Lukjancenko O, Duarte ASR, Van Gompel L, Luiken REC, Smit LAM, Schmitt H, Garcia AD, Hansen RB, Petersen TN, Bossers A, Ruppe E, Lund O, Hald T, Pamp SJ, Vigre H, Heederik D, Wagenaar JA, Mevius D and Aarestrup FM, 2018. Abundance and diversity of the faecal resistome in slaughter pigs and broilers in nine European countries. Nature Microbiology, 3, 898–908. 10.1038/s41564-018-0192-9 [DOI] [PubMed] [Google Scholar]
- Nadon C, Van Walle I, Gerner‐Smidt P, Campos J, Chinen I, Concepcion‐Acevedo J, Gilpin B, Smith AM, Man Kam K, Perez E, Trees E, Kubota K, Takkinen J, Nielsen EM and Carleton H, 2017. PulseNet International: vision for the implementation of whole genome sequencing (WGS) for global food‐borne disease surveillance. Eurosurveillance Weekly, 22, 10.2807/1560-7917.Es.2017.22.23.30544 [DOI] [PMC free article] [PubMed] [Google Scholar]
- Narayanasamy S, Jarosz Y, Muller EE, Heintz‐Buschart A, Herold M, Kaysen A, Laczny CC, Pinel N, May P and Wilmes P, 2016. IMP: a pipeline for reproducible reference‐independent integrated metagenomic and metatranscriptomic analyses. Genome Biology, 17, 260 10.1186/s13059-016-1116-8 [DOI] [PMC free article] [PubMed] [Google Scholar]
- Nayfach S, Shi ZJ, Seshadri R, Pollard KS and Kyrpides NC, 2019. New insights from uncultivated genomes of the global human gut microbiome. Nature, 568, 505–510. 10.1038/s41586-019-1058-x [DOI] [PMC free article] [PubMed] [Google Scholar]
- Nei M, 1975. Molecular population genetics and evolution. North‐Holland Publishing Company. [PubMed] [Google Scholar]
- Neuert S, Nair S, Day MR, Doumith M, Ashton PM, Mellor KC, Jenkins C, Hopkins KL, Woodford N, de Pinna E, Godbole G and Dallman TJ, 2018. Prediction of phenotypic antimicrobial resistance profiles from whole genome sequences of non‐typhoidal Salmonella enterica . Frontiers in Microbiology, 9, 592 10.3389/fmicb.2018.00592 [DOI] [PMC free article] [PubMed] [Google Scholar]
- Nguyen M, Long SW, McDermott PF, Olsen RJ, Olson R, Stevens RL, Tyson GH, Zhao S and Davis JJ, 2019. Using machine learning to predict antimicrobial MICs and associated genomic features for nontyphoidal Salmonella . Journal of Clinical Microbiology, 57, e01260–e01218. 10.1128/JCM.01260-18 [DOI] [PMC free article] [PubMed] [Google Scholar]
- Njage PMK, Henri C, Leekitcharoenphon P, Mistou M‐Y, Hendriksen RS and Hald T, 2019a. Machine learning methods as a tool for predicting risk of illness applying next‐generation sequencing data. Risk Analysis, 39, 1397–1413. 10.1111/risa.13239 [DOI] [PMC free article] [PubMed] [Google Scholar]
- Njage PMK, Leekitcharoenphon P and Hald T, 2019b. Improving hazard characterization in microbial risk assessment using next generation sequencing data and machine learning: predicting clinical outcomes in shigatoxigenic Escherichia coli. International Journal of Food Microbiology, 292, 72–82. 10.1016/j.ijfoodmicro.2018.11.016 [DOI] [PubMed] [Google Scholar]
- Noyes NR, Yang X, Linke LM, Magnuson RJ, Cook SR, Zaheer R, Yang H, Woerner DR, Geornaras I, McArt JA, Gow SP, Ruiz J, Jones KL, Boucher CA, McAllister TA, Belk KE and Morley PS, 2016. Characterization of the resistome in manure, soil and wastewater from dairy and beef production systems. Scientific Reports, 6, 24645 10.1038/srep24645 [DOI] [PMC free article] [PubMed] [Google Scholar]
- Nyholm O, 2016. Virulence variety and hybrid strains of diarrheagenic Escherichia coli in Finland and Burkina Faso. University of Helsinki. Doctoral dissertation, article‐based, http://urn.fi/URN:ISBN:978-951-51-2625-2
- Okoro CK, Barquist L, Connor TR, Harris SR, Clare S, Stevens MP, Arends MJ, Hale C, Kane L, Pickard DJ, Hill J, Harcourt K, Parkhill J, Dougan G and Kingsley RA, 2015. Signatures of adaptation in human invasive Salmonella Typhimurium ST313 populations from sub‐Saharan Africa. PLoS Neglected Tropical Diseases, 9, e0003611 10.1371/journal.pntd.0003611 [DOI] [PMC free article] [PubMed] [Google Scholar]
- Oniciuc EA, Likotrafiti E, Alvarez‐Molina A, Prieto M, Santos JA and Alvarez‐Ordonez A, 2018. The present and future of whole genome sequencing (WGS) and whole metagenome sequencing (WMS) for surveillance of antimicrobial resistant microorganisms and antimicrobial resistance genes across the food chain. Genes (Basel), 9, 10.3390/genes9050268 [DOI] [PMC free article] [PubMed] [Google Scholar]
- Ottesen A, Ramachandran P, Reed E, White JR, Hasan N, Subramanian P, Ryan G, Jarvis K, Grim C, Daquiqan N, Hanes D, Allard M, Colwell R, Brown E and Chen Y, 2016. Enrichment dynamics of Listeria monocytogenes and the associated microbiome from naturally contaminated ice cream linked to a listeriosis outbreak. BMC Microbiology, 16, 275 10.1186/s12866-016-0894-1 [DOI] [PMC free article] [PubMed] [Google Scholar]
- Oulas A, Pavloudi C, Polymenakou P, Pavlopoulos GA, Papanikolaou N, Kotoulas G, Arvanitidis C and Iliopoulos I, 2015. Metagenomics: tools and insights for analyzing next‐generation sequencing data derived from biodiversity studies. Bioinformatics and Biology Insights, 9, 75–88. 10.4137/bbi.S12462 [DOI] [PMC free article] [PubMed] [Google Scholar]
- Palma F, Manfreda G, Silva M, Parisi A, Barker DOR, Taboada EN, Pasquali F and Rossi M, 2018. Genome‐wide identification of geographical segregated genetic markers in Salmonella enterica serovar Typhimurium variant 4,[5],12:i. Scientific Reports, 8, 15251 10.1038/s41598-018-33266-5 [DOI] [PMC free article] [PubMed] [Google Scholar]
- Pärnänen KMM, Narciso‐da‐Rocha C, Kneis D, Berendonk TU, Cacace D, Do TT, Elpers C, Fatta‐Kassinos D, Henriques I, Jaeger T, Karkman A, Martinez JL, Michael SG, Michael‐Kordatou I, O'Sullivan K, Rodriguez‐Mozaz S, Schwartz T, Sheng H, Sorum H, Stedtfeld RD, Tiedje JM, Giustina SVD, Walsh F, Vaz‐Moreira I, Virta M and Manaia CM, 2019. Antibiotic resistance in European wastewater treatment plants mirrors the pattern of clinical antibiotic resistance prevalence. Science Advances, 5, eaau9124 10.1126/sciadv.aau9124 [DOI] [PMC free article] [PubMed] [Google Scholar]
- Partridge SR, Kwong SM, Firth N and Jensen SO, 2018. Mobile genetic elements associated with antimicrobial resistance. Clinical Microbiology Reviews, 31, 10.1128/cmr.00088-17 [DOI] [PMC free article] [PubMed] [Google Scholar]
- Pasolli E, Asnicar F, Manara S, Zolfo M, Karcher N, Armanini F, Beghini F, Manghi P, Tett A, Ghensi P, Collado MC, Rice BL, DuLong C, Morgan XC, Golden CD, Quince C, Huttenhower C and Segata N, 2019. Extensive unexplored human microbiome diversity revealed by over 150,000 genomes from metagenomes spanning age, geography, and lifestyle. Cell, 176, 649–662. 10.1016/j.cell.2019.01.001 [DOI] [PMC free article] [PubMed] [Google Scholar]
- Pearce ME, Alikhan NF, Dallman TJ, Zhou Z, Grant K and Maiden MCJ, 2018. Comparative analysis of core genome MLST and SNP typing within a European Salmonella serovar Enteritidis outbreak. International Journal of Food Microbiology, 274, 1–11. 10.1016/j.ijfoodmicro.2018.02.023 [DOI] [PMC free article] [PubMed] [Google Scholar]
- van Pelt W, van de Giessen A, van Leeuwen W, Wannet W, Henken A and Evers EG, 1999. Oorsprong, omvang en kosten van humane salmonellose. Deel 1. Oorsprongvan humane salmonellose met betrekking tot varken, rund, kip, ei en overigebronnen. Infectieziekten Bulletin, 10, 240–243. [Google Scholar]
- Persson S, Olsen KEP, Ethelberg S and Scheutz F, 2007. Subtyping method for Escherichia coli Shiga toxin (Verocytotoxin) 2 variants and correlations to clinical manifestations. Journal of Clinical Microbiology, 45, 2020 10.1128/JCM.02591-06 [DOI] [PMC free article] [PubMed] [Google Scholar]
- Petersen E, Mills E and Miller SI, 2019. Cyclic‐di‐GMP regulation promotes survival of a slow‐replicating subpopulation of intracellular Salmonella Typhimurium. Proceedings of the National Academy of Sciences, 116, 6335 10.1073/pnas.1901051116 [DOI] [PMC free article] [PubMed] [Google Scholar]
- Pettengill EA, Pettengill JB and Binet R, 2016. Phylogenetic analyses of Shigella and Enteroinvasive Escherichia coli for the identification of molecular epidemiological markers: whole‐genome comparative analysis does not support distinct genera designation. Frontiers in Microbiology, 6, 1573 10.3389/fmicb.2015.01573 [DOI] [PMC free article] [PubMed] [Google Scholar]
- Pielaat A, Boer MP, Wijnands LM, van Hoek AH, Bouw E, Barker GC, Teunis PF, Aarts HJ and Franz E, 2015. First step in using molecular data for microbial food safety risk assessment; hazard identification of Escherichia coli O157:H7 by coupling genomic data with in vitro adherence to human epithelial cells. International Journal of Food Microbiology, 213, 130–138. 10.1016/j.ijfoodmicro.2015.04.009 [DOI] [PMC free article] [PubMed] [Google Scholar]
- Pielaat A, Kuijpers A, Asch ED‐v, van Pelt W and Wijnands L, 2016. Phenotypic behavior of 35 Salmonella enterica serovars compared to epidemiological and genomic data. Procedia Food Science, 7, 53–58. 10.1016/j.profoo.2016.02.085 [DOI] [Google Scholar]
- Pires SM, Evers EG, van Pelt W, Ayers T, Scallan E, Angulo FJ, Havelaar A and Hald T, 2009. Attributing the human disease burden of foodborne infections to specific sources. Foodborne Pathogenic Diseases, 6, 417–424. 10.1089/fpd.2008.0208 [DOI] [PubMed] [Google Scholar]
- Pires SM, Duarte AS and Hald T, 2018. Source attribution and risk assessment of antimicrobial resistance. Microbiology Spectrum, 6, 10.1128/microbiolspec.ARBA-0027-2017 [DOI] [PMC free article] [PubMed] [Google Scholar]
- Pitta DW, Dou Z, Kumar S, Indugu N, Toth JD, Vecchiarelli B and Bhukya B, 2016. Metagenomic evidence of the prevalence and distribution patterns of antimicrobial resistance genes in dairy agroecosystems. Foodborne Pathogenic Diseases, 13, 296–302. 10.1089/fpd.2015.2092 [DOI] [PubMed] [Google Scholar]
- Poirel L, Jayol A, Bontron S, Villegas MV, Ozdamar M, Turkoglu S and Nordmann P, 2015. The mgrB gene as a key target for acquired resistance to colistin in Klebsiella pneumoniae . Journal of Antimicrobial Chemotherapy, 70, 75–80. 10.1093/jac/dku323 [DOI] [PubMed] [Google Scholar]
- Pritchard JK, Stephens M and Donnelly P, 2000. Inference of population structure using multilocus genotype data. Genetics, 155, 945–959. [DOI] [PMC free article] [PubMed] [Google Scholar]
- Qin X, He S, Zhou X, Cheng X, Huang X, Wang Y, Wang S, Cui Y, Shi C and Shi X, 2019. Quantitative proteomics reveals the crucial role of YbgC for Salmonella enterica serovar Enteritidis survival in egg white. International Journal of Food Microbiology, 289, 115–126. 10.1016/j.ijfoodmicro.2018.08.010 [DOI] [PubMed] [Google Scholar]
- Quince C, Walker AW, Simpson JT, Loman NJ and Segata N, 2017. Shotgun metagenomics, from sampling to analysis. Nature Biotechnology, 35, 833–844. 10.1038/nbt.3935 [DOI] [PubMed] [Google Scholar]
- Ragon M, Wirth T, Hollandt F, Lavenir R, Lecuit M, Le Monnier A and Brisse S, 2008. A new perspective on Listeria monocytogenes evolution. PLoS Pathogens, 4, e1000146 10.1371/journal.ppat.1000146 [DOI] [PMC free article] [PubMed] [Google Scholar]
- Raj A, Stephens M and Pritchard JK, 2014. fastSTRUCTURE: variational inference of population structure in large SNP data sets. Genetics, 197, 573–589. 10.1534/genetics.114.164350 [DOI] [PMC free article] [PubMed] [Google Scholar]
- Rantsiou K, Kathariou S, Winkler A, Skandamis P, Saint‐Cyr MJ, Rouzeau‐Szynalski K and Amézquita A, 2018. Next generation microbiological risk assessment: opportunities of whole genome sequencing (WGS) for foodborne pathogen surveillance, source tracking and risk assessment. International Journal of Food Microbiology, 287, 3–9. 10.1016/j.ijfoodmicro.2017.11.007 [DOI] [PubMed] [Google Scholar]
- Ratiner YA, Sihvonen LM, Liu Y, Wang L and Siitonen A, 2010. Alteration of flagellar phenotype of Escherichia coli strain P12b, the standard type strain for flagellar antigen H17, possessing a new non‐fliC flagellin gene flnA, and possible loss of original flagellar phenotype and genotype in the course of subculturing through semisolid media. Archives of Microbiology, 192, 267–278. 10.1007/s00203-010-0556-x [DOI] [PubMed] [Google Scholar]
- Ravi A, Estensmo ELF, Abee‐Lund TML, Foley SL, Allgaier B, Martin CR, Claud EC and Rudi K, 2017. Association of the gut microbiota mobilome with hospital location and birth weight in preterm infants. Pediatric Research, 82, 829–838. 10.1038/pr.2017.146 [DOI] [PubMed] [Google Scholar]
- Rebelo AR, Bortolaia V, Kjeldgaard JS, Pedersen SK, Leekitcharoenphon P, Hansen IM, Guerra B, Malorny B, Borowiak M, Hammerl JA, Battisti A, Franco A, Alba P, Perrin‐Guyomard A, Granier SA, De Frutos Escobar C, Malhotra‐Kumar S, Villa L, Carattoli A and Hendriksen RS, 2018. Multiplex PCR for detection of plasmid‐mediated colistin resistance determinants, mcr‐1, mcr‐2, mcr‐3, mcr‐4 and mcr‐5 for surveillance purposes. EuroSurveillance, 23, 17–00672. 10.2807/1560-7917.ES.2018.23.6.17-00672 [DOI] [PMC free article] [PubMed] [Google Scholar]
- Reimer A, Weedmark K, Petkau A, Peterson CL, Walker M, Knox N, Kent H, Mabon P, Berry C, Tyler S, Tschetter L, Jerome M, Allen V, Hoang L, Bekal S, Clark C, Nadon C, Van Domselaar G, Pagotto F, Graham M, Farber J and Gilmour M, 2019. Shared genome analyses of notable listeriosis outbreaks, highlighting the critical importance of epidemiological evidence, input datasets and interpretation criteria. Microbial Genomics, 5, 10.1099/mgen.0.000237 [DOI] [PMC free article] [PubMed] [Google Scholar]
- Revez J, Llarena AK, Schott T, Kuusi M, Hakkinen M, Kivistö R, Hänninen ML and Rossi M, 2014a. Genome analysis of Campylobacter jejuni strains isolated from a waterborne outbreak. BMC Genomics, 15, 768 10.1186/1471-2164-15-768 [DOI] [PMC free article] [PubMed] [Google Scholar]
- Revez J, Zhang J, Schott T, Kivisto R, Rossi M and Hanninen ML, 2014b. Genomic variation between Campylobacter jejuni isolates associated with milk‐borne‐disease outbreaks. Journal of Clinical Microbiology, 52, 2782–2786. 10.1128/jcm.00931-14 [DOI] [PMC free article] [PubMed] [Google Scholar]
- Ribeiro CDS, van Roode MY, Haringhuizen GB, Koopmans MP, Claassen E and van de Burgwal LHM, 2018. How ownership rights over microorganisms affect infectious disease control and innovation: a root‐cause analysis of barriers to data sharing as experienced by key stakeholders. PLoS ONE, 13, e0195885 10.1371/journal.pone.0195885 [DOI] [PMC free article] [PubMed] [Google Scholar]
- Ribot EM and Hise KB, 2016. Future challenges for tracking food‐borne diseases: PulseNet, a 20‐year‐old US surveillance system for foodborne diseases, is expanding both globally and technologically. EMBO Reports, 17, 1499–1505. 10.15252/embr.201643128 [DOI] [PMC free article] [PubMed] [Google Scholar]
- Robertson J and Nash JHE, 2018. MOB‐suite: software tools for clustering, reconstruction and typing of plasmids from draft assemblies. Microbial Genomics, 4, e000206 10.1099/mgen.0.000206 [DOI] [PMC free article] [PubMed] [Google Scholar]
- Robertson J, Yoshida C, Kruczkiewicz P, Nadon C, Nichani A, Taboada EN and Nash JHE, 2018. Comprehensive assessment of the quality of Salmonella whole genome sequence data available in public sequence databases using the Salmonella in silico Typing Resource (SISTR). Microbial Genomoics, 4, 10.1099/mgen.0.000151 [DOI] [PMC free article] [PubMed] [Google Scholar]
- Ronholm J, Nasheri N, Petronella N and Pagotto F, 2016. Navigating microbiological food safety in the era of whole‐genome sequencing. Clinical Microbiology Reviews, 29, 837–857. 10.1128/cmr.00056-16 [DOI] [PMC free article] [PubMed] [Google Scholar]
- Rozwandowicz M, Brouwer MSM, Fischer J, Wagenaar JA, Gonzalez‐Zorn B, Guerra B, Mevius DJ and Hordijk J, 2018. Plasmids carrying antimicrobial resistance genes in Enterobacteriaceae. Journal of Antimicrobial Chemotherapy, 73, 1121–1137. 10.1093/jac/dkx488 [DOI] [PubMed] [Google Scholar]
- Rusconi B, Sanjar F, Koenig SS, Mammel MK, Tarr PI and Eppinger M, 2016. Whole genome sequencing for genomics‐guided investigations of Escherichia coli O157:H7 outbreaks. Frontiers in microbiology, 7, 985 10.3389/fmicb.2016.00985 [DOI] [PMC free article] [PubMed] [Google Scholar]
- Salaheen S, Kim SW, Karns JS, Hovingh E, Haley BJ and Van Kessel JAS, 2019. Metagenomic analysis of the fecal microbiomes from Escherichia coli O157:H7‐shedding and non‐shedding cows on a single dairy farm. Food Control, 102, 76–80. 10.1016/j.foodcont.2019.03.022 [DOI] [Google Scholar]
- Salter SJ, Cox MJ, Turek EM, Calus ST, Cookson WO, Moffatt MF, Turner P, Parkhill J, Loman NJ and Walker AW, 2014. Reagent and laboratory contamination can critically impact sequence‐based microbiome analyses. BMC Biology, 12, 87 10.1186/s12915-014-0087-z [DOI] [PMC free article] [PubMed] [Google Scholar]
- Schürch AC and van Schaik W, 2017. Challenges and opportunities for whole‐genome sequencing‐based surveillance of antibiotic resistance. Annals of the New York Academy of Sciences, 1388, 108–120. 10.1111/nyas.13310 [DOI] [PubMed] [Google Scholar]
- Schürch AC, Arredondo‐Alonso S, Willems RJL and Goering RV, 2018. Whole genome sequencing options for bacterial strain typing and epidemiologic analysis based on single nucleotide polymorphism versus gene‐by‐gene‐based approaches. Clinical Microbiology & Infection, 24, 350–354. 10.1016/j.cmi.2017.12.016 [DOI] [PubMed] [Google Scholar]
- Sévellec Y, Vignaud ML, Granier SA, Lailler R, Feurer C, Le Hello S, Mistou MY and Cadel‐Six S, 2018. Polyphyletic nature of Salmonella enterica serotype Derby and lineage‐specific host‐association revealed by genome‐wide analysis. Frontiers in Microbiology, 9, 891 10.3389/fmicb.2018.00891 [DOI] [PMC free article] [PubMed] [Google Scholar]
- Sheppard SK, Didelot X, Meric G, Torralbo A, Jolley KA, Kelly DJ, Bentley SD, Maiden MC, Parkhill J and Falush D, 2013. Genome‐wide association study identifies vitamin B5 biosynthesis as a host specificity factor in Campylobacter . Proceedings of the National Academy of Science, 110, 11923–11927. 10.1073/pnas.1305559110 [DOI] [PMC free article] [PubMed] [Google Scholar]
- Sheppard SK, Guttman DS and Fitzgerald JR, 2018. Population genomics of bacterial host adaptation. Nature Reviews Genetics, 19, 549–565. 10.1038/s41576-018-0032-z [DOI] [PubMed] [Google Scholar]
- Siira L, Naseer U, Alfsnes K, Hermansen NO, Lange H and Brandal LT, 2019. Whole genome sequencing of Salmonella Chester reveals geographically distinct clusters, Norway, 2000 to 2016. Eurosurveillance Weekly, 24, 10.2807/1560-7917.Es.2019.24.4.1800186 [DOI] [PMC free article] [PubMed] [Google Scholar]
- Simon S, Trost E, Bender J, Fuchs S, Malorny B, Rabsch W, Prager R, Tietze E and Flieger A, 2018. Evaluation of WGS based approaches for investigating a food‐borne outbreak caused by Salmonella enterica serovar Derby in Germany. Food Microbiology, 71, 46–54. 10.1016/j.fm.2017.08.017 [DOI] [PubMed] [Google Scholar]
- Simpson EH, 1949. Measurement of diversity. Nature, 163, 688. [Google Scholar]
- Sinclair C, Jenkins C, Warburton F, Adak GK and Harris JP, 2017. Investigation of a national outbreak of STEC Escherichia coli O157 using online consumer panel control methods: great Britain, October 2014. Epidemiology and Infection, 145, 864–871. 10.1017/s0950268816003009 [DOI] [PMC free article] [PubMed] [Google Scholar]
- Singh KM, Jakhesara SJ, Koringa PG, Rank DN and Joshi CG, 2012. Metagenomic analysis of virulence‐associated and antibiotic resistance genes of microbes in rumen of Indian buffalo (Bubalus bubalis). Gene, 507, 146–151. 10.1016/j.gene.2012.07.037 [DOI] [PubMed] [Google Scholar]
- Stevens EL, Timme R, Brown EW, Allard MW, Strain E, Bunning K and Musser S, 2017. The public health impact of a publically available, environmental database of microbial genomes. Frontiers in Microbiology, 8, 10.3389/fmicb.2017.00808 [DOI] [PMC free article] [PubMed] [Google Scholar]
- Stewart RD, Auffret MD, Warr A, Wiser AH, Press MO, Langford KW, Liachko I, Snelling TJ, Dewhurst RJ, Walker AW, Roehe R and Watson M, 2018. Assembly of 913 microbial genomes from metagenomic sequencing of the cow rumen. Nature Communications, 9, 870 10.1038/s41467-018-03317-6 [DOI] [PMC free article] [PubMed] [Google Scholar]
- Su M, Satola SW and Read TD, 2019. Genome‐based prediction of bacterial antibiotic resistance. Journal of Clinical Microbiology, 57, e01405–e01418. 10.1128/JCM.01405-18 [DOI] [PMC free article] [PubMed] [Google Scholar]
- Sun J, Zhang H, Liu YH and Feng Y, 2018. Towards understanding MCR‐like colistin resistance. Trends in Microbiology, 26, 794–808. 10.1016/j.tim.2018.02.006 [DOI] [PubMed] [Google Scholar]
- Sunde M, Simonsen GS, Slettemeas JS, Bockerman I and Norstrom M, 2015. Integron, plasmid and host strain characteristics of Escherichia coli from humans and food included in the Norwegian antimicrobial resistance monitoring programs. PLoS ONE, 10, e0128797 10.1371/journal.pone.0128797 [DOI] [PMC free article] [PubMed] [Google Scholar]
- Taboada EN, Ross SL, Mutschall SK, Mackinnon JM, Roberts MJ, Buchanan CJ, Kruczkiewicz P, Jokinen CC, Thomas JE, Nash JH, Gannon VP, Marshall B, Pollari F and Clark CG, 2012. Development and validation of a comparative genomic fingerprinting method for high‐resolution genotyping of Campylobacter jejuni. Journal of Clinical Microbiology, 50, 788–797. 10.1128/jcm.00669-11 [DOI] [PMC free article] [PubMed] [Google Scholar]
- Taboada EN, Graham MR, Carriço JA and Van Domselaar G, 2017. Food safety in the age of next generation sequencing, bioinformatics, and open data access. 8, 909. 10.3389/fmicb.2017.00909 [DOI] [PMC free article] [PubMed] [Google Scholar]
- Takahashi H, Kasuga R, Miya S, Miyamura N, Kuda T and Kimura B, 2018. Efficacy of propidium monoazide on quantitative real‐time PCR‐based enumeration of Staphylococcus aureus live cells treated with various sanitizers. Journal of Food Protection, 81, 1815–1820. 10.4315/0362-028x.Jfp-18-059 [DOI] [PubMed] [Google Scholar]
- Technical University of Denmark ‐National Food Institute , 2018. Comparative genomics of quinolone‐resistantand susceptible Campylobacter jejuni of poultry origin from major poultry producing European countries(GENCAMP). EFSA supporting publication 2018:EN‐1398, 35 pp. 10.2903/sp.efsa.2017.EN-1398 [DOI]
- Tewolde R, Dallman T, Schaefer U, Sheppard CL, Ashton P, Pichon B, Ellington M, Swift C, Green J and Underwood A, 2016. MOST: a modified MLST typing tool based on short read sequencing. PeerJ, 4, e2308 10.7717/peerj.2308 [DOI] [PMC free article] [PubMed] [Google Scholar]
- Thépault A, Meric G, Rivoal K, Pascoe B, Mageiros L, Touzain F, Rose V, Beven V, Chemaly M and Sheppard SK, 2017. Genome‐wide identification of host‐segregating epidemiological markers for source attribution in Campylobacter jejuni . Applied and Environment Microbiology, 83, 10.1128/aem.03085-16 [DOI] [PMC free article] [PubMed] [Google Scholar]
- Thépault A, Rose V, Quesne S, Poezevara T, Beven V, Hirchaud E, Touzain F, Lucas P, Meric G, Mageiros L, Sheppard SK, Chemaly M and Rivoal K, 2018. Ruminant and chicken: important sources of campylobacteriosis in France despite a variation of source attribution in 2009 and 2015. Scientific Reports, 8, 9305 10.1038/s41598-018-27558-z [DOI] [PMC free article] [PubMed] [Google Scholar]
- Tominaga A, 2004. Characterization of six flagellin genes in the H3, H53 and H54 standard strains of Escherichia coli . Genes & Genetics Systems, 79, 1–8. [DOI] [PubMed] [Google Scholar]
- Tominaga A and Kutsukake K, 2007. Expressed and cryptic flagellin genes in the H44 and H55 type strains of Escherichia coli . Genes & Genetic Systems, 82, 1–8. [DOI] [PubMed] [Google Scholar]
- Tonkin‐Hill G, Lees JA, Bentley SD, Frost SDW and Corander J, 2019. Fast hierarchical Bayesian analysis of population structure. Nucleic Acids Research, 47, 5539–5549. 10.1093/nar/gkz361 [DOI] [PMC free article] [PubMed] [Google Scholar]
- Tyson GW, Chapman J, Hugenholtz P, Allen EE, Ram RJ, Richardson PM, Solovyev VV, Rubin EM, Rokhsar DS and Banfield JF, 2004. Community structure and metabolism through reconstruction of microbial genomes from the environment. Nature, 428, 37–43. 10.1038/nature02340 [DOI] [PubMed] [Google Scholar]
- UNEP (United Nations Environmental Programme), 2011. Nagoya protocol on access to genetic resources and the fair and equitable sharing of benefits arising from their utilization to the convention on biological diversity. Available online: https://www.cbd.int/abs/doc/protocol/nagoya-protocol-en.pdf
- Ung A, Baidjoe AY, Van Cauteren D, Fawal N, Fabre L, Guerrisi C, Danis K, Morand A, Donguy MP, Lucas E, Rossignol L, Lefevre S, Vignaud ML, Cadel‐Six S, Lailler R, Jourdan‐Da Silva N and Le Hello S, 2019. Disentangling a complex nationwide Salmonella Dublin outbreak associated with raw‐milk cheese consumption, France, 2015 to 2016. Eurosurveillance Weekly, 24, 10.2807/1560-7917.Es.2019.24.3.1700703 [DOI] [PMC free article] [PubMed] [Google Scholar]
- Uzzau S, Brown DJ, Wallis T, Rubino S, Leori G, Bernard S, Casadesús J, Platt DJ and Olsen JE, 2000. Host adapted serotypes of Salmonella enterica . Epidemiology and Infection, 125, 229–255. [DOI] [PMC free article] [PubMed] [Google Scholar]
- Vernacchio L, Vezina RM, Mitchell AA, Lesko SM, Plaut AG and Acheson DW, 2006. Diarrhea in American infants and young children in the community setting: incidence, clinical presentation and microbiology. Pediatric Infectious Disease Journal, 25, 2–7. [DOI] [PubMed] [Google Scholar]
- Waldram A, Dolan G, Ashton PM, Jenkins C and Dallman TJ, 2018. Epidemiological analysis of Salmonella clusters identified by whole genome sequencing, England and Wales 2014. Food Microbiology, 71, 39–45. 10.1016/j.fm.2017.02.012 [DOI] [PubMed] [Google Scholar]
- Walsh AM, Crispie F, Daari K, Sullivan O, Martin JC, Arthur CT, Claesson MJ, Scott KP and Cotter PD, 2017. Strain‐level metagenomic analysis of the fermented dairy beverage nunu highlights potential food safety risks. Applied and Environment Microbiology, 83, e01144–e01117. 10.1128/AEM.01144-17 [DOI] [PMC free article] [PubMed] [Google Scholar]
- Wang L, Rothemund D, Curd H and Reeves PR, 2003. Species‐wide variation in the Escherichia coli flagellin (H‐antigen) gene. Journal of Bacteriology, 185, 2936–2943. 10.1128/jb.185.9.2936-2943.2003 [DOI] [PMC free article] [PubMed] [Google Scholar]
- Wattam AR, Davis JJ, Assaf R, Boisvert S, Brettin T, Bun C, Conrad N, Dietrich EM, Disz T, Gabbard JL, Gerdes S, Henry CS, Kenyon RW, Machi D, Mao C, Nordberg EK, Olsen GJ, Murphy‐Olson DE, Olson R, Overbeek R, Parrello B, Pusch GD, Shukla M, Vonstein V, Warren A, Xia F, Yoo H and Stevens RL, 2016. Improvements to PATRIC, the all‐bacterial bioinformatics database and analysis resource center. Nucleic Acids Research, 45, D535–D542. 10.1093/nar/gkw1017 [DOI] [PMC free article] [PubMed] [Google Scholar]
- Weinroth MD, Scott HM, Norby B, Loneragan GH, Noyes NR, Rovira P, Doster E, Yang X, Woerner DR, Morley PS and Belk KE, 2018. Effects of ceftiofur and chlortetracycline on the resistomes of feedlot cattle. Applied and Environment Microbiology, 84, 10.1128/aem.00610-18 [DOI] [PMC free article] [PubMed] [Google Scholar]
- Whitehouse CA, Young S, Li C, Hsu CH, Martin G and Zhao S, 2018. Use of whole‐genome sequencing for Campylobacter surveillance from NARMS retail poultry in the United States in 2015. Food Microbiology, 73, 122–128. 10.1016/j.fm.2018.01.018 [DOI] [PubMed] [Google Scholar]
- WHO (World Health Organization), 2017. Comments by the World Health Organization on the draft fact finding and scoping study ‘The emergence and growth of digital sequence information in research and development: implications for the conservation and sustainable use of biodiversity, and fair and equitable benefit sharing’. Available online: https://www.who.int/influenza/whocommentscbddsi.pdf
- WHO (World Health Organization), 2018. Whole genome sequencing for foodborne disease surveillance: landscape paper. Geneva: World Health Organization; 2018. Licence: CC BY‐NC‐SA 3.0 IGO.
- Wilson DJ, Gabriel E, Leatherbarrow AJ, Cheesbrough J, Gee S, Bolton E, Fox A, Fearnhead P, Hart CA and Diggle PJ, 2008. Tracing the source of campylobacteriosis. PLoS Genetics, 4, e1000203 10.1371/journal.pgen.1000203 [DOI] [PMC free article] [PubMed] [Google Scholar]
- Wilson D, Dolan G, Aird H, Sorrell S, Dallman TJ, Jenkins C, Robertson L and Gorton R, 2018. Farm‐to‐fork investigation of an outbreak of Shiga toxin‐producing Escherichia coli O157. Microbial Genomoics, 4, 10.1099/mgen.0.000160 [DOI] [PMC free article] [PubMed] [Google Scholar]
- Wright A, Ginn A and Luo Z, 2016. Molecular tools for monitoring and source‐tracking Salmonella in wildlife and the environment In: Jay‐Russell M. and Doyle MP. (eds.). Food Safety Risks from Wildlife: Challenges in Agriculture, Conservation, and Public Health. Springer International Publishing, Cham: pp. 131–150. [Google Scholar]
- Yachison CA, Yoshida C, Robertson J, Nash JHE, Kruczkiewicz P, Taboada EN, Walker M, Reimer A, Christianson S, Nichani A and Nadon C, 2017. The validation and implications of using whole genome sequencing as a replacement for traditional serotyping for a national Salmonella reference laboratory. Frontiers in Microbiology, 8, 1044 10.3389/fmicb.2017.01044 [DOI] [PMC free article] [PubMed] [Google Scholar]
- Yang X, Noyes NR, Doster E, Martin JN, Linke LM, Magnuson RJ, Yang H, Geornaras I, Woerner DR, Jones KL, Ruiz J, Boucher C, Morley PS and Belk KE, 2016. Use of metagenomic shotgun sequencing technology to detect foodborne pathogens within the microbiome of the beef production chain. Applied and Environment Microbiology, 82, 2433–2443. 10.1128/aem.00078-16 [DOI] [PMC free article] [PubMed] [Google Scholar]
- Yoshida CE, Kruczkiewicz P, Laing CR, Lingohr EJ, Gannon VP, Nash JH and Taboada EN, 2016. The Salmonella in silico typing resource (SISTR): an open web‐accessible tool for rapidly typing and subtyping draft Salmonella genome assemblies. PLoS ONE, 11, e0147101 10.1371/journal.pone.0147101 [DOI] [PMC free article] [PubMed] [Google Scholar]
- Zankari E, Hasman H, Kaas RS, Seyfarth AM, Agerso Y, Lund O, Larsen MV and Aarestrup FM, 2013. Genotyping using whole‐genome sequencing is a realistic alternative to surveillance based on phenotypic antimicrobial susceptibility testing. Journal of Antimicrobial Chemotherapy, 68, 771–777. 10.1093/jac/dks496 [DOI] [PubMed] [Google Scholar]
- Zankari E, Allesoe R, Joensen KG, Cavaco LM, Lund O and Aarestrup FM, 2017. PointFinder: a novel web tool for WGS‐based detection of antimicrobial resistance associated with chromosomal point mutations in bacterial pathogens. Journal of Antimicrobial Chemotherapy, 72, 2764–2768. 10.1093/jac/dkx217 [DOI] [PMC free article] [PubMed] [Google Scholar]
- Zhang J, Halkilahti J, Hanninen ML and Rossi M, 2015. Refinement of whole‐genome multilocus sequence typing analysis by addressing gene paralogy. Journal of Clinical Microbiology, 53, 1765–1767. 10.1128/jcm.00051-15 [DOI] [PMC free article] [PubMed] [Google Scholar]
- Zhang S, Li S, Gu W, den Bakker H, Boxrud D, Taylor A, Roe C, Driebe E, Engelthaler DM, Allard M, Brown E, McDermott P, Zhao S, Bruce BB, Trees E, Fields PI and Deng X, 2019. Zoonotic source attribution of Salmonella enterica serotype Typhimurium using genomic surveillance data, United States. Emerging Infectious Diseases, 25, 82–91. 10.3201/eid2501.180835 [DOI] [PMC free article] [PubMed] [Google Scholar]
- Zhao S, Tyson GH, Chen Y, Li C, Mukherjee S, Young S, Lam C, Folster JP, Whichard JM and McDermott PF, 2016. Whole‐genome sequencing analysis accurately predicts antimicrobial resistance phenotypes in Campylobacter spp. Applied and Environment Microbiology, 82, 459–466. 10.1128/AEM.02873-15 [DOI] [PMC free article] [PubMed] [Google Scholar]
- Zhou B, Wang C, Zhao Q, Wang Y, Huo M, Wang J and Wang S, 2016. Prevalence and dissemination of antibiotic resistance genes and coselection of heavy metals in Chinese dairy farms. Journal of Hazardous Materials, 320, 10–17. 10.1016/j.jhazmat.2016.08.007 [DOI] [PubMed] [Google Scholar]