Abstract
Ultrasound imaging using a matrix array allows real-time multi-planar volumetric imaging. To enhance image quality, the matrix array should provide fast volumetric ultrasound imaging with spatially consistent focusing in the lateral and elevational directions. However, because of the significantly increased data size, dealing with massive and continuous data acquisition is a significant challenge. We have designed an imaging acquisition sequence that handles volumetric data efficiently using a single 256-channel Verasonics ultrasound research platform multiplexed with a 1024 element matrix array. The developed sequence has been applied for building an ultrasonic pupilometer. Our results demonstrate the capability of the developed approach for structural visualization of an ex vivo porcine eye and the temporal response of the modeled eye pupil with moving iris at the volume rate of 30 Hz. Our study provides a fundamental ground for researchers to establish their own volumetric ultrasound imaging platform and could stimulate the development of new volumetric ultrasound approaches and applications.
Index Terms—: Data acquisition, Fully-sampled matrix array, Ultrasonic imaging, Volumetric imaging, Ultrasound pupilometer
I. INTRODUCTION
VOLUMETRIC ultrasound, a promising biomedical diagnostic imaging tool, enables acquisition of three-dimensional, multi-planar visualization of tissue for more accurate and objective diagnosis, improved guidance of surgical intervention, and therapy monitoring [1]–[3]. Modern volumetric ultrasound images can be acquired in two methods: mechanical and electrical scanning. Mechanical scanning with a bulky motorized 1-D array transducer is not fast enough in scanning speed to avoid potential motion artifacts [2]–[4]. Furthermore, mechanical scanning cannot produce C-plane (coronal plane, i.e., images of the plane orthogonal to the ultrasound beam direction) images in real-time because full volumetric information is accessible only upon completion of an entire scanning session. In contrast, electronic scanning using a fully-sampled matrix array can acquire full volume information without mechanical sweeping, enabling high frame rate multi-planar imaging [2]–[4]. Ultrafast volumetric imaging using a 1024-element matrix array has been recently introduced to implement 3-D shear wave elasticity imaging and 3-D Doppler imaging techniques [5].
Open platform ultrasound systems with high-channel-count (e.g., 512, 1024 channels) are at the forefront of state-of-the art volumetric imaging techniques using high-element-count array transducers [6]–[9]. For example, SARUS is an in-house open-platform 1024-channel system with wide data-transfer bandwidth capable of real-time volumetric imaging with any user-specified transmission scheme [6], [7]. Beyond custom-made research platforms, open platform ultrasound systems for researchers are commercially available [6]. The Vantage 256 system (Verasonics, Inc., Kirkland, WA, USA) is one of the successfully-commercialized open-platform systems, with great flexibility in system configuration including the capability of interfacing with high-element-count transducers via multi-system synchronization, and direct accessibility of raw RF samples to evaluate custom processing algorithms [10], [11]. The such high-channel-count ultrasound systems are, unfortunately, not cost effective, spurring exploration of sparse array techniques that use only a subset of elements of the matrix array (e.g., 256 out of 1024-element) [12]–[16]. Consequently, methods to optimize 2-D sparse array patterns on the matrix array through numerical simulation have been investigated. These include optimal 2-D sparse array methods based on a simulated annealing technique, and evaluated in vitro using a 1024-channel ultrasound imaging system consisting of four synchronized 256-channel ultrasound imaging systems [14]–[16]. These methods showed comparable image quality compared to the fully-sampled array, though the optimization procedure for the sparse array can be time consuming, parameter dependent, and difficult to generalize. In an effort to reduce the number of active channels needed for connection between matrix array elements at the transducer design domain, row-column addressing of the 2-D array has been investigated [17]–[20]. A row-column addressing approach turns the matrix array into two orthogonal large 1-D linear arrays [17]–[20]. Combination of two orthogonal arrays used for each transmit and receive event allows focusing in a volume, resulting in imaging quality comparable with that of the fully-sampled array. This approach uses 2N connections for a 2-D array composed of N × N elements, while a fully-sampled array requires N2 connections [17]–[20]. Furthermore, recent studies considered the apodization embedded in the row-column addressing transducer to suppress the edge effect inherent to the approach [17]–[20]. However, the fully-sampled array is still preferred as a foundation for volumetric ultrasound imaging research, due to its great flexibility in controlling beam formation.
In this study, an ultrasonic pupilometer was implemented based on a multi-planar 3-D ultrasound imaging system using a single 256-channel ultrasound scanner multiplexed with a 1024-element fully-sampled matrix array. Evaluation of pupillary light reflex is neurologically significant in many clinical applications, which may aid understanding of a mortal risk factor [21]–[24]. Ocular ultrasound imaging can be an effective, safe way to assess pupillary light reflex, as direct, visual evaluation can be time consuming, prone to intra- and inter-observer variability, and challenging to access in cases of severe skin damage on the eyelid or a hyphema [21]. With 2-D ultrasound imaging, visualizing the coronal plane of the eye is difficult because the eye gazes in the direction of the ultrasound beam, resulting in inaccurate and inconsistent measurements, depending on the incident angle of the ultrasound beam and eye axis. Volumetric ultrasound with a matrix array can provide C-plane and whole volumetric information without incident angle dependency of ultrasound beams, with potential for reliable, quantitative, and real-time evaluation of pupillary light reflex. Outside of pupillary applications, emerging 3-D imaging techniques including 3-D shear-wave elastography and 3-D super-resolution ultrasound imaging also require fast and massive data acquisition [25]–[27].
This study is aimed at providing an effective strategy and a reference programming structure for fast and continuous volumetric data acquisition using a single Vantage 256-channel ultrasound imaging system interfaced with a 1024-element matrix array. Our approach seeks to efficiently utilize limited hardware resources (e.g., finite memory/storage size and data transfer rate) and optimize a trade-off between imaging parameters such as pulse-repetition interval (PRI), volume acquisition rate, and observation time based on the requirement of the clinical application. Our volumetric imaging sequence was designed to show the feasibility of an ultrasonic pupilometer verified using a static porcine eye and a moving modeled pupil. We envision that our approach may assist researchers to rapidly establish their own preliminary flexible research platform for studying further volumetric ultrasound applications.
II. Methods and materials
A. System configuration for volume data acquisition
In this study, a 1024-element matrix array (Vermon Inc., Tours, France) was connected to a single fully-programmable 256-channel ultrasound research platform (Vantage 256, Verasonics Inc., Kirkland, WA, USA) through a software-controlled 4-to-1 high voltage multiplexer (UTA 1024-MUX, Verasonics Inc., Kirkland, WA, USA). A multiplexer is an electrical switch that selectively connects the desired signal path from multiple choices, thus, enabling full control of the fully-sampled 1024-element (32×32) matrix transducer using a 256-channel ultrasound imaging system. The overall system configuration with the control and RF data paths is illustrated in Fig. 1(a) and the element map of the matrix array is illustrated in Fig. 1(b). The 2-D matrix array is composed of 1024 elements in an arrangement of a 32×32 grid. Each element has an identical size (275 μm) and pitch (300 μm), in both the lateral and elevational directions. The manufacture’s exemplary bank design was utilized for this study. The elements in the array are grouped into 4 banks of 32×8 elements with a 600 μm blank row between each bank for electrical wire connections of the probe, resulting in an aperture dimension of 9.3 mm ×10.2 mm (Fig. 1 (b)). If the default bank is designed such that the elements are configured 16×16 in a grid for each bank, there are vertical and horizontal blank rows in the center of the transducer.
Fig. 1.
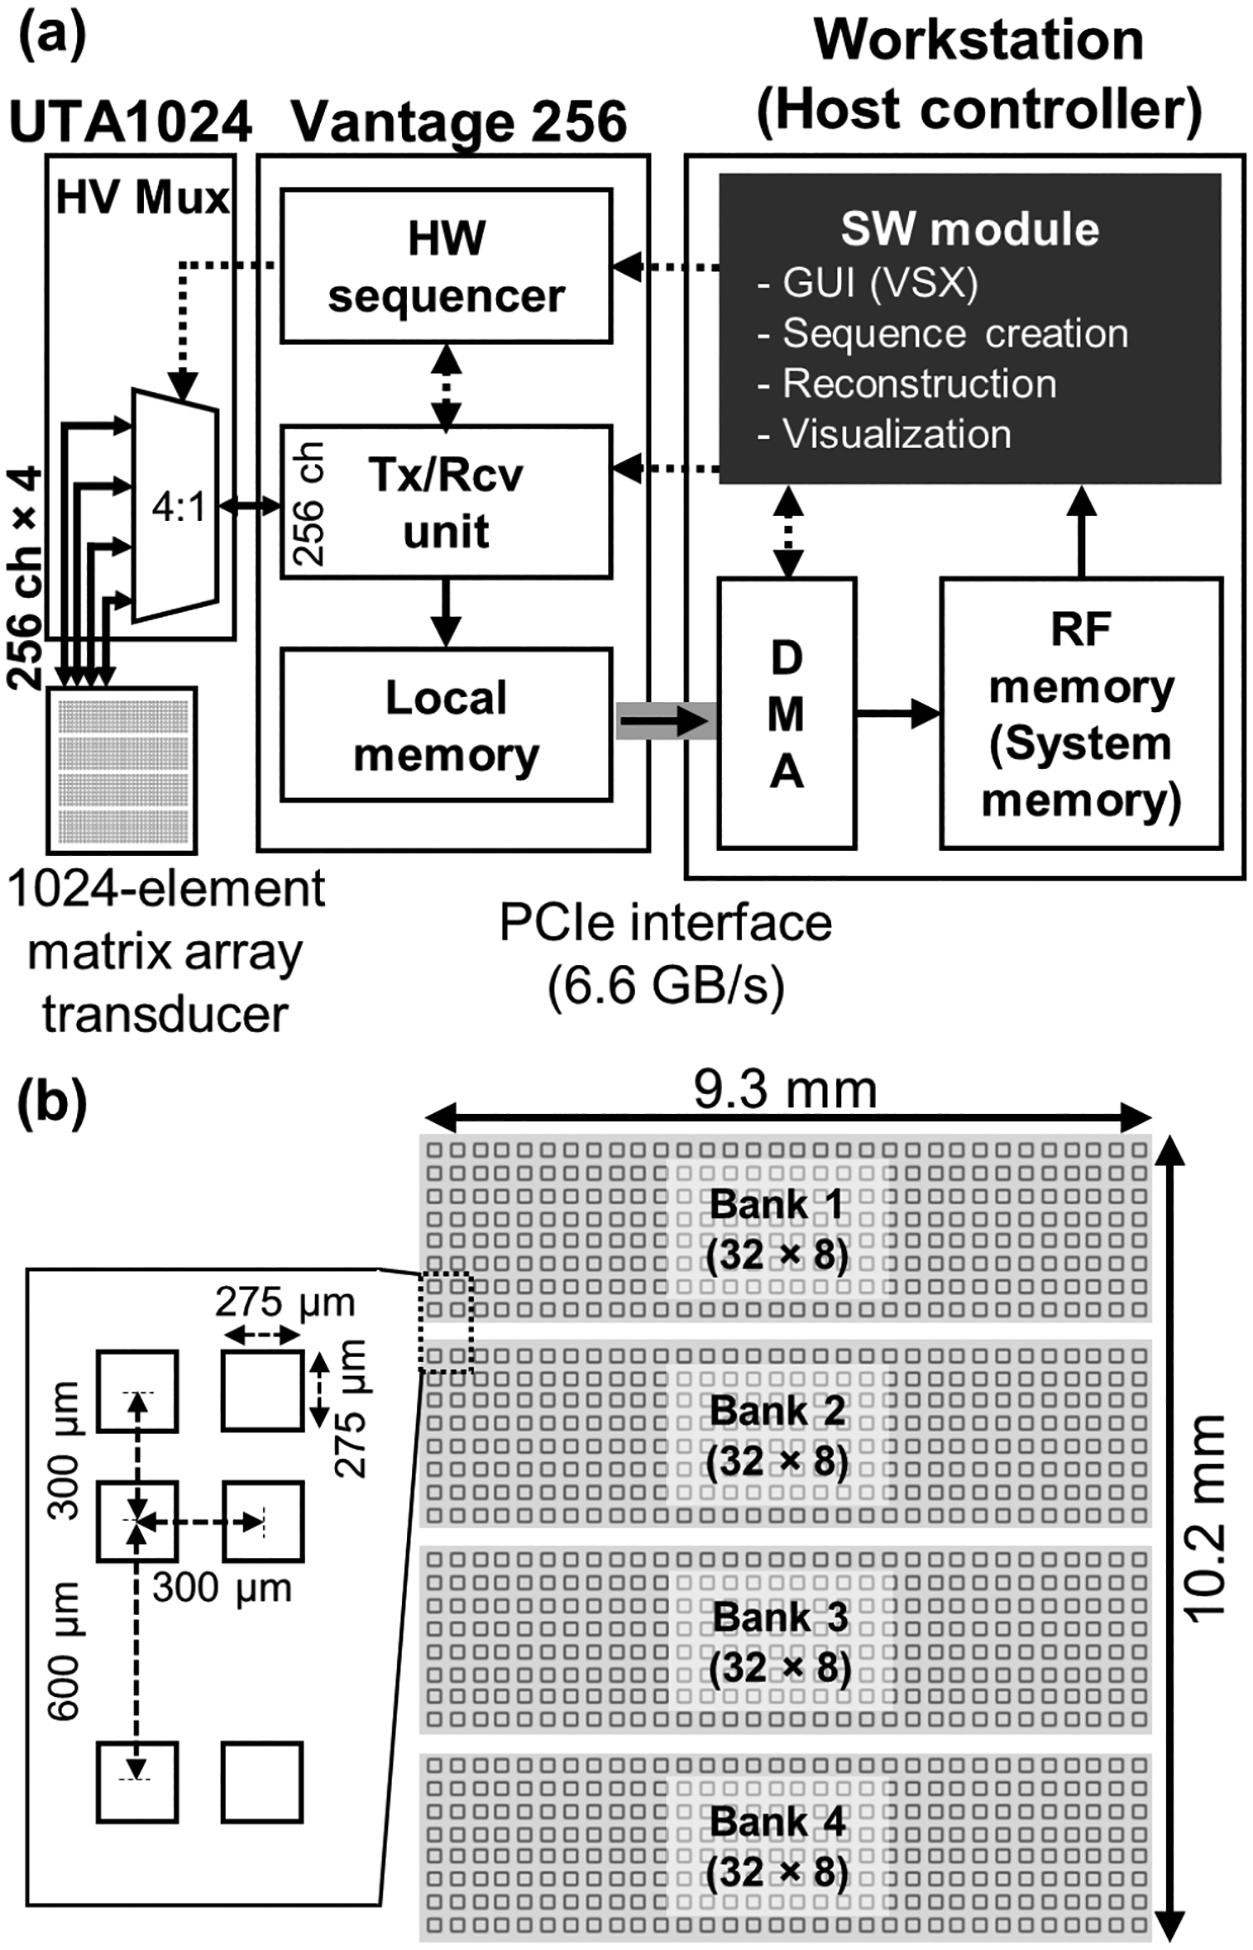
(a) Schematic of system configuration with RF data and control path. Solid arrows: RF data path, Dashed arrows: Control path; GUI: Graphical User Interface, VSX: Verasonics Sequence eXecution software - sequence loader program, DMA: Direct Memory Access, RF: Radio Frequency, HW: Hardware, Tx/Rcv: Transmit/Receive, UTA: Universal Transducer Adapter, HV-Mux: High-Voltage Multiplexer. (b) The map of the elements in a matrix array. Each element size is 275 μm × 275 μm and the element pitch in both lateral and elevational directions is 300 μm. Each bank is a group of 32×8 elements (256 elements) and a blank row for electrical wire connection is located between each bank. The aperture size of the matrix array is 9.3 mm × 10.2 mm.
Each bank (or sub-aperture) driving 256 channels needs to run four times for transmission of the 1024-element fully-sampled matrix array (4 Tx). In addition, each transmission requires four receptions by switching four banks to cover 1024 channels (4 Rcv). Therefore, a total of 16 transmit/receive (4 Tx × 4 Rcv) events are required to interrogate an entire volume. The acquired data may be synthesized to form a single volume to decrease the data size by a data accumulator embedded in the Verasonics data acquisition system, which allows for direct stacking and summing of RF data stored in the local channel memories of the acquisition system prior to data transfer using direct memory access (DMA). The switching event generates disturbance when the high-voltage bipolar DC power changes. The corresponding multiplexing noise may be introduced in the near-field image that takes about 5 μs to be electrically stabilized as shown in Fig. 2.
Fig. 2.
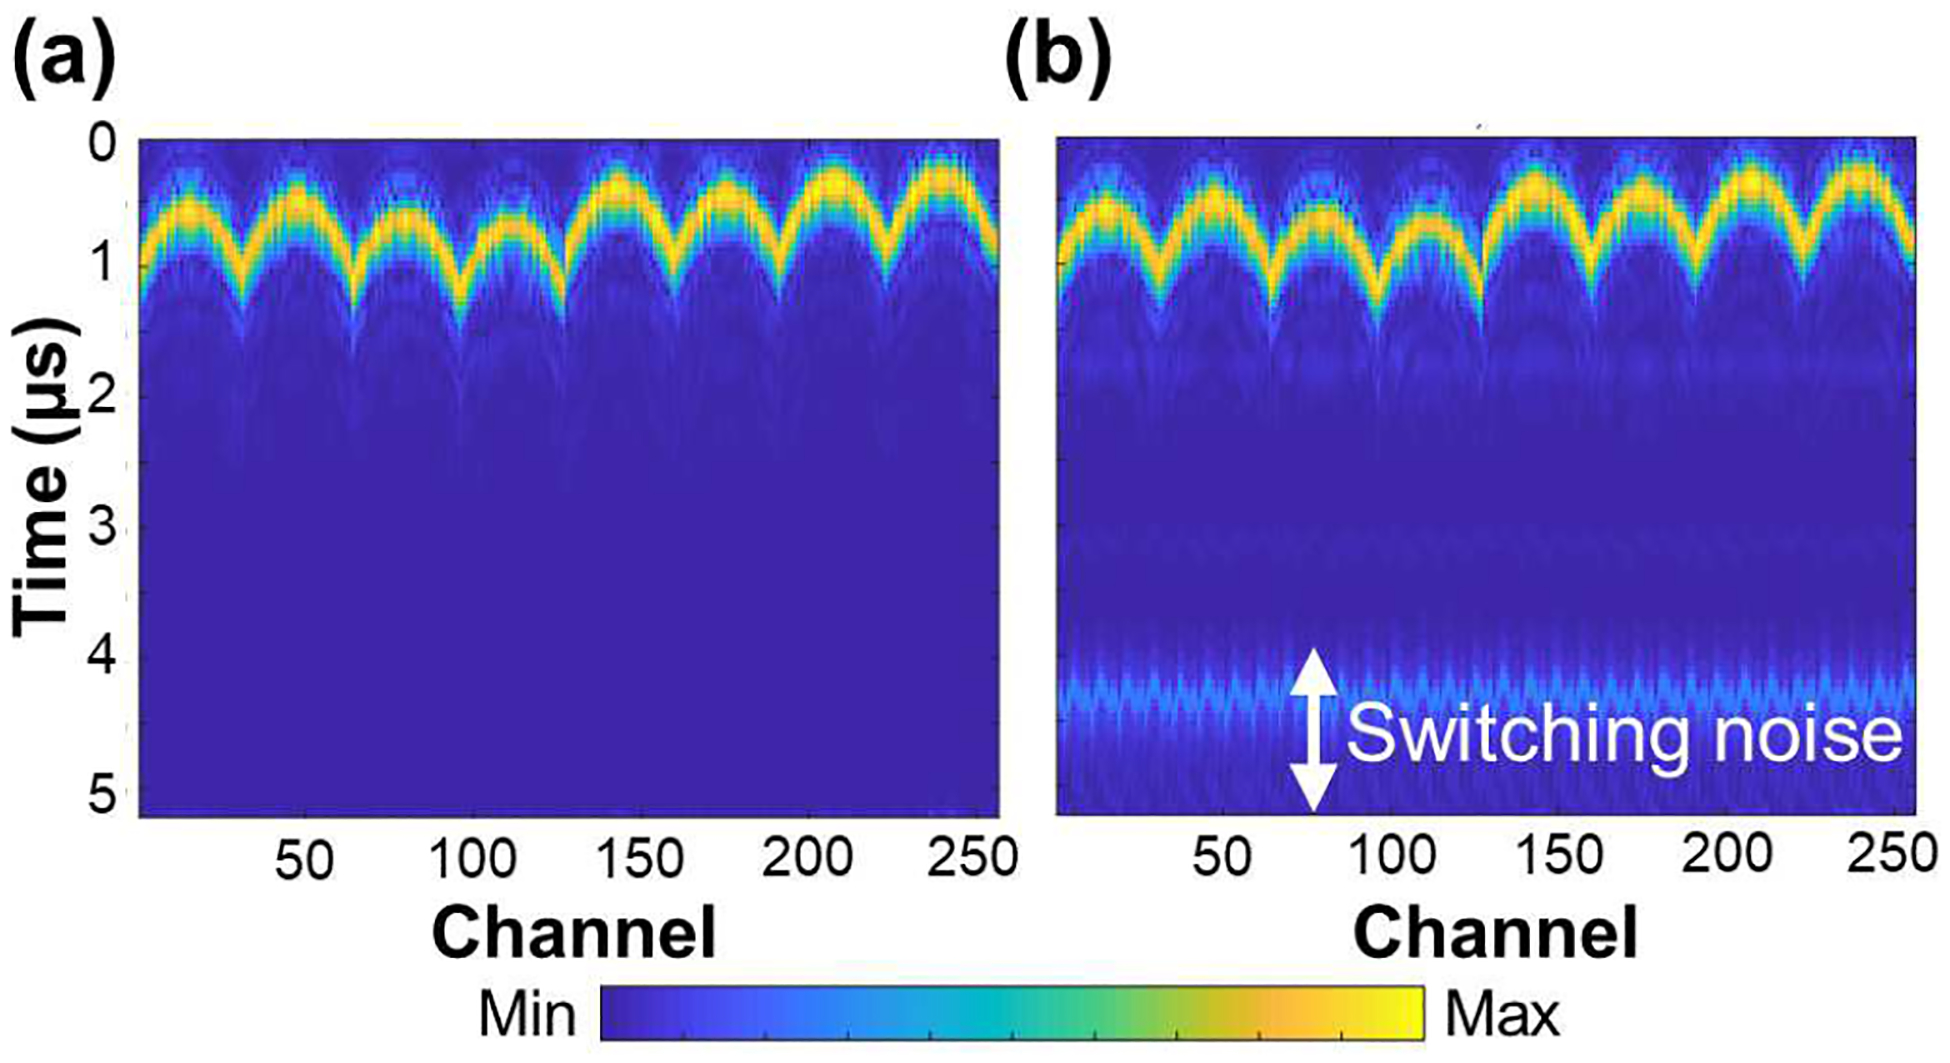
The received raw radio-frequency data of (a) non-switching case (the same bank is used for transmitting and receiving) and (b) switching case (the different banks are used for transmitting and receiving). Switching noise can be observed in the panel (b) between 4 and 5 μs. Signal within the first 1 μs in both panels is transmitted wave.
Acquired raw RF samples were temporally stored in the local channel memory of the Vantage 256 system and then transferred to the system memory of the host computer using DMA channels. A data transfer rate of a PCI-express interface by DMA is up to 6.6 GB/s, which would be fast enough for most imaging applications. Therefore, the volume rate is not limited by the data transfer rate, but rather by physical and practical limitations, such as the pulse-repetition interval (PRI) determined by the round-trip travel time of acoustic wave based on imaging depth. PRI is typically set to be long enough to avoid reverberation artifacts resulting from the prior transmission.
Every hardware and software module of the Vantage 256, including transmitter and receiver modules, filters, and reconstruction algorithms, can be customized. The sequencing program provides an environment to support the imaging and reconstruction parameters (global system objects) and a sequence of events (a sequence object). The generated objects are loaded to the hardware and software sequencers by calling a loader program, called ‘VSX’ and then imaging is executed. The loader program also provides a graphical user interface (GUI), controls, and displays after processing.
B. Diverging waves and beam characterization
Using the matrix array, the ultrasound beam can be focused in both lateral and elevation directions, leading to high quality 2-D and 3-D ultrasound imaging. However, transmit and receive focusing at every point in the entire volume would be inefficient, significantly decreasing the frame rate. Thus, to satisfy the frame rate required in our application, an acquisition method based on focused transmit beams were excluded. Furthermore, to provide a large field of view to include an entire eye, a diverging unfocused beam was used. Specifically, we utilized unfocused diverging waves with a coherent compounding technique that can rapidly acquire the volumetric data while preserving the lateral and elevational resolution and the signal-to-noise ratio [5], [16], [28]–[30]. Diverging waves originated from virtual sources distributed on a spherical contour in the virtual space (the opposite direction to the wave propagation) as shown in Fig. 3(a) [31]. The focal point of the collection of virtual sources can be determined by
| (1) |
where the negative sign represents virtual sources located in the virtual space opposite to the imaging space. A diverging angle of 30° was chosen, leading to the corresponding focal point of −19 mm. The designed diverging waves allowed for an approximately 18.2 mm × 18.2 mm of field-of-view at an imaging depth of 15 mm that is enough to capture the entire cross section of the pupil. Note that the typical horizontal and vertical corneal diameters of pigs 6 to 8 months old were14.3±0.3 mm and 12.0±0 mm, respectively [32]. The number of virtual sources is limited to be a square of the odd numbers including a virtual source at the beyond the origin of (0, 0, Š19 mm), such as 12, 32, 52, 72, 92, and 112. The virtual sources were evenly distributed over the spherical surface in this study. Single cycle excitation centered at 5 MHz was used for the diverging beam. As an example, Fig. 3(a) illustrates the locations of 25 (= 5×5) virtual sources with a diverging angle of 30°. The corresponding beam profiles in lateral and elevational directions are plotted in Fig. 3(b). Each beam profile was taken from a thin carbon wire with a diameter of 60 μm submerged in a water tank at a depth of 10 mm. The diameter of the carbon wire, smaller than the wavelength of the transmitted beam (≈300 μm @ 5.2 MHz), ensured that a response from the target could be considered a point spread function.
Fig. 3.
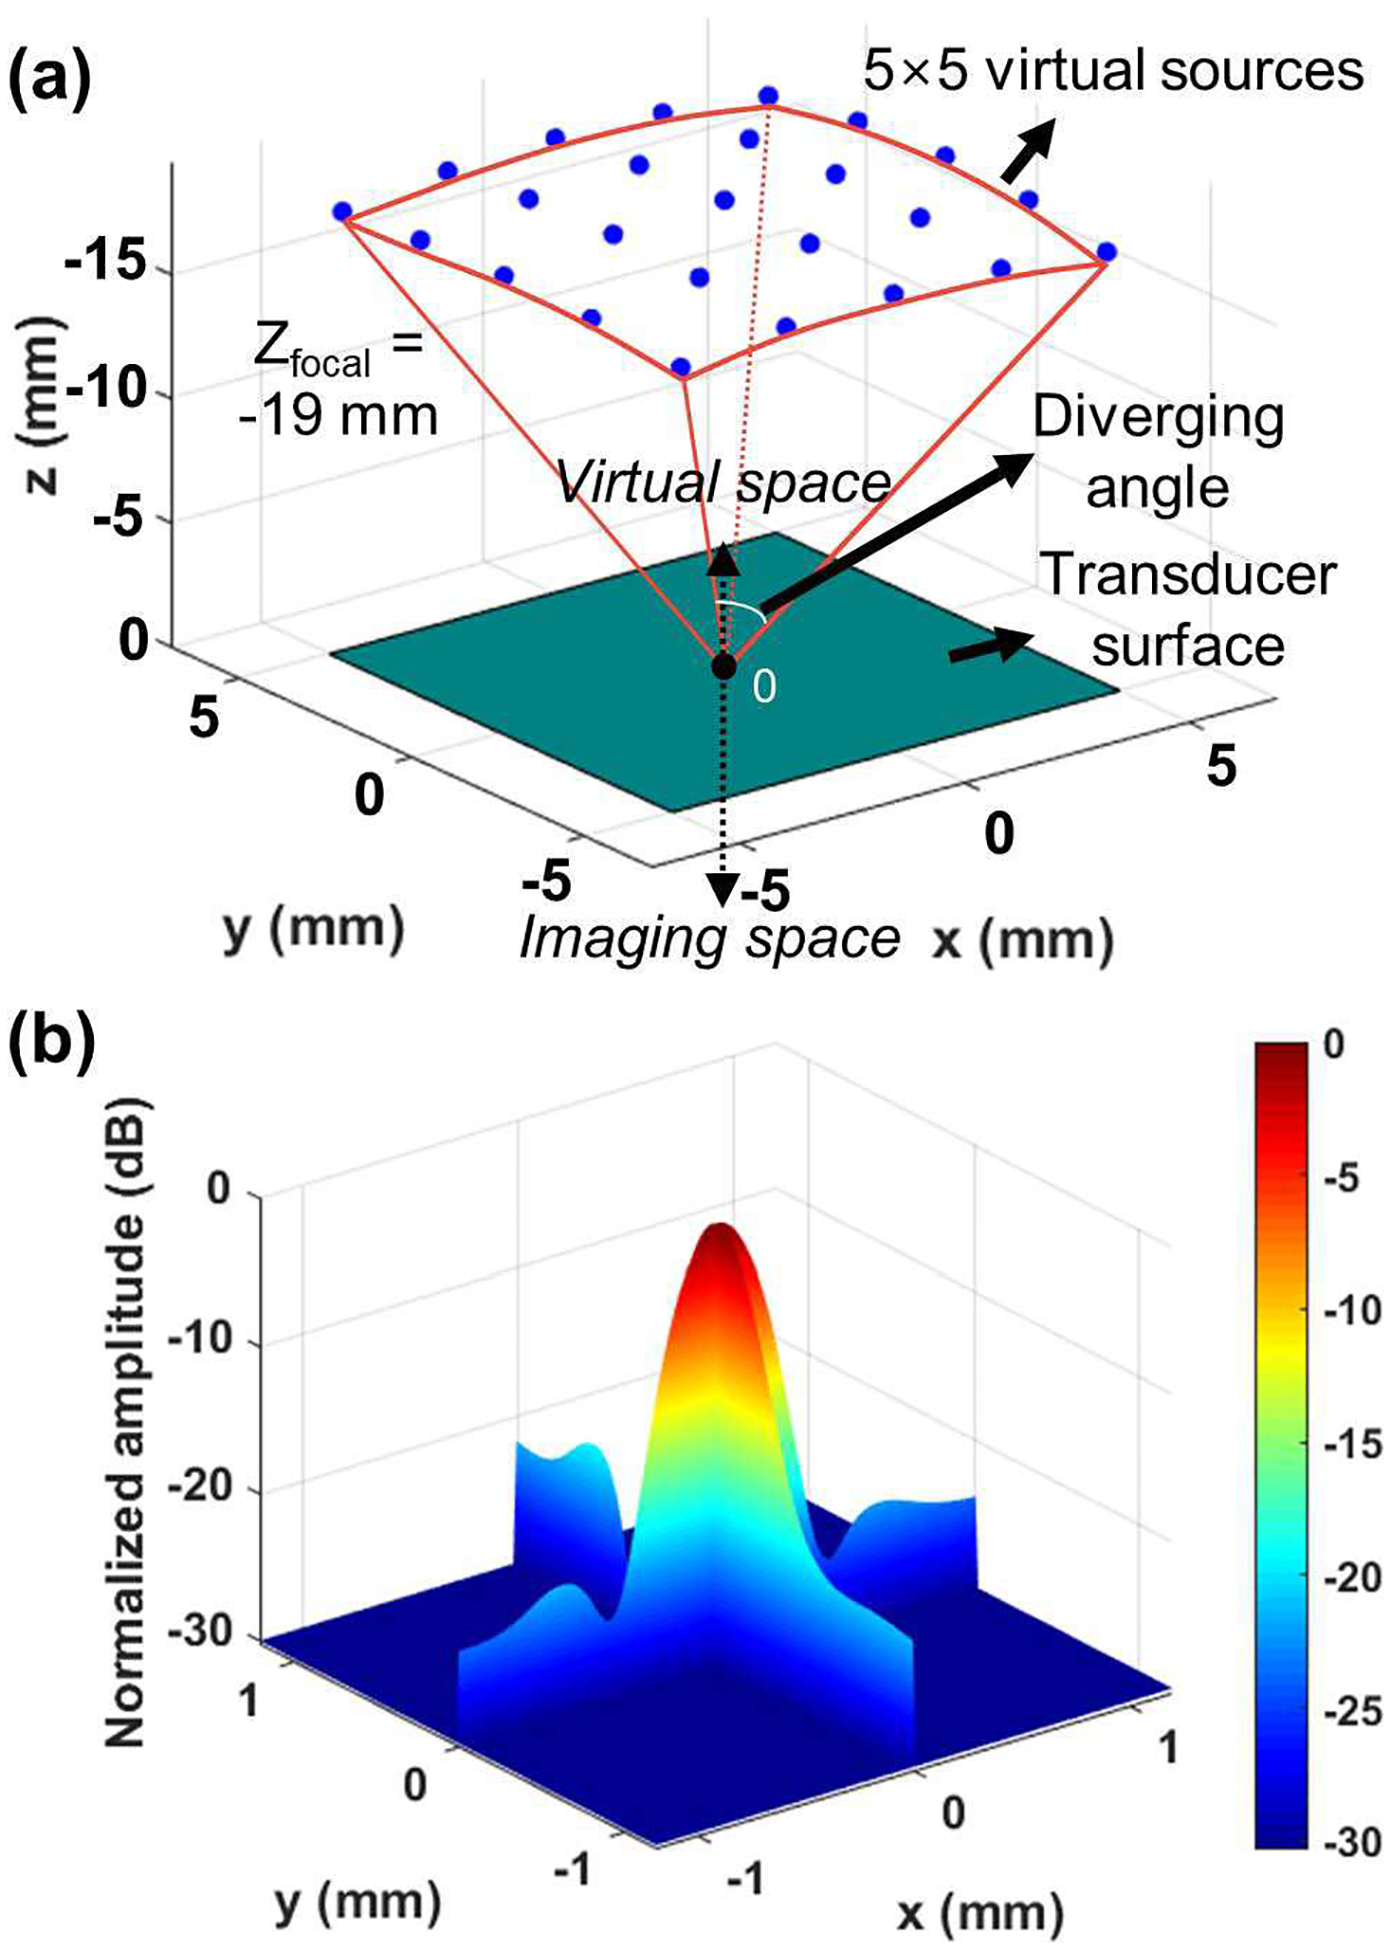
(a) Location of the 25 virtual sources for diverging waves with a diverging angle of 30°. The origin ‘0’ is located at the center of the matrix array surface and the virtual sources are uniformly distributed in a 5×5 grid over the spherical surface with a radius of 19 mm from the origin. The negative sign on the z-axis represents the virtual space above the transducer surface. (b) The corresponding measured lateral resolution (X-axis) and elevation resolution (Y-axis) is 447 μm and 418 μm, respectively.
As seen in Fig. 3(b), focusing was successfully performed in both lateral and elevational directions. The lateral, elevational, and axial resolutions of the compounded volume measured at the full width at half maximum (FWHM) were 450 μm, 420 μm, and 330 μm, respectively. Note that the beam profile obtained from the point target may not be ideally symmetric because the orientation of the string may not be perfectly parallel to the transducer surface, and because the string has a finite thickness of 60 μm, and thus is not an ideal point target. The elevational resolution is slightly better than the lateral resolution, as the elevational aperture size of the matrix array is longer than its lateral dimension because of blank rows between each bank, thereby decreasing the effective F-number. Note that the effective F-number can be controlled by adjusting the diverging angle. For example, the lateral resolution is improved from 460 μm to 390 μm, as the diverging angle is increased from 10° to 50°. However, given the same number of virtual sources, increasing the diverging angle increases the angle interval between virtual sources, resulting in a grating lobe artifact. To suppress the grating lobe, the tapered apodization technique or the non-uniform distributed virtual sources technique could be considered [28],[29], [33], [34].
C. Imaging parameters for quantifying pupil activities
To measure the pupil constriction time (~700 ms) and latency between light stimulation and pupil constriction (~200 ms), a volume rate of 10 Hz is required [35]–[38]. For reference, a conventional commercial infra-red optical pupilometer runs at 30 Hz [35]–[37]. Therefore, our sequence design aimed at achieving a volume rate of 30 Hz. To observe the temporal behaviors of the pupillary light reflex, a total of 100 compounded volumes were acquired. The volume acquisition interval is determined by the product of PRI and the number of virtual sources. Therefore, for a given volume rate, the PRI and the number of virtual sources are inversely proportional (Fig. 4) – a greater number of virtual sources requires a shorter PRI and vice versa. If the number of virtual sources is given, the maximum allowable PRI along the curved line in Fig. 4 can be defined as
| (2) |
where the volume rate is defined by the requirement of the application, and the number of the synthetic transmits is defined by the system configuration. Therefore, the first term in the right-hand side of Eq. 2 is assumed as a constant.
Fig. 4.
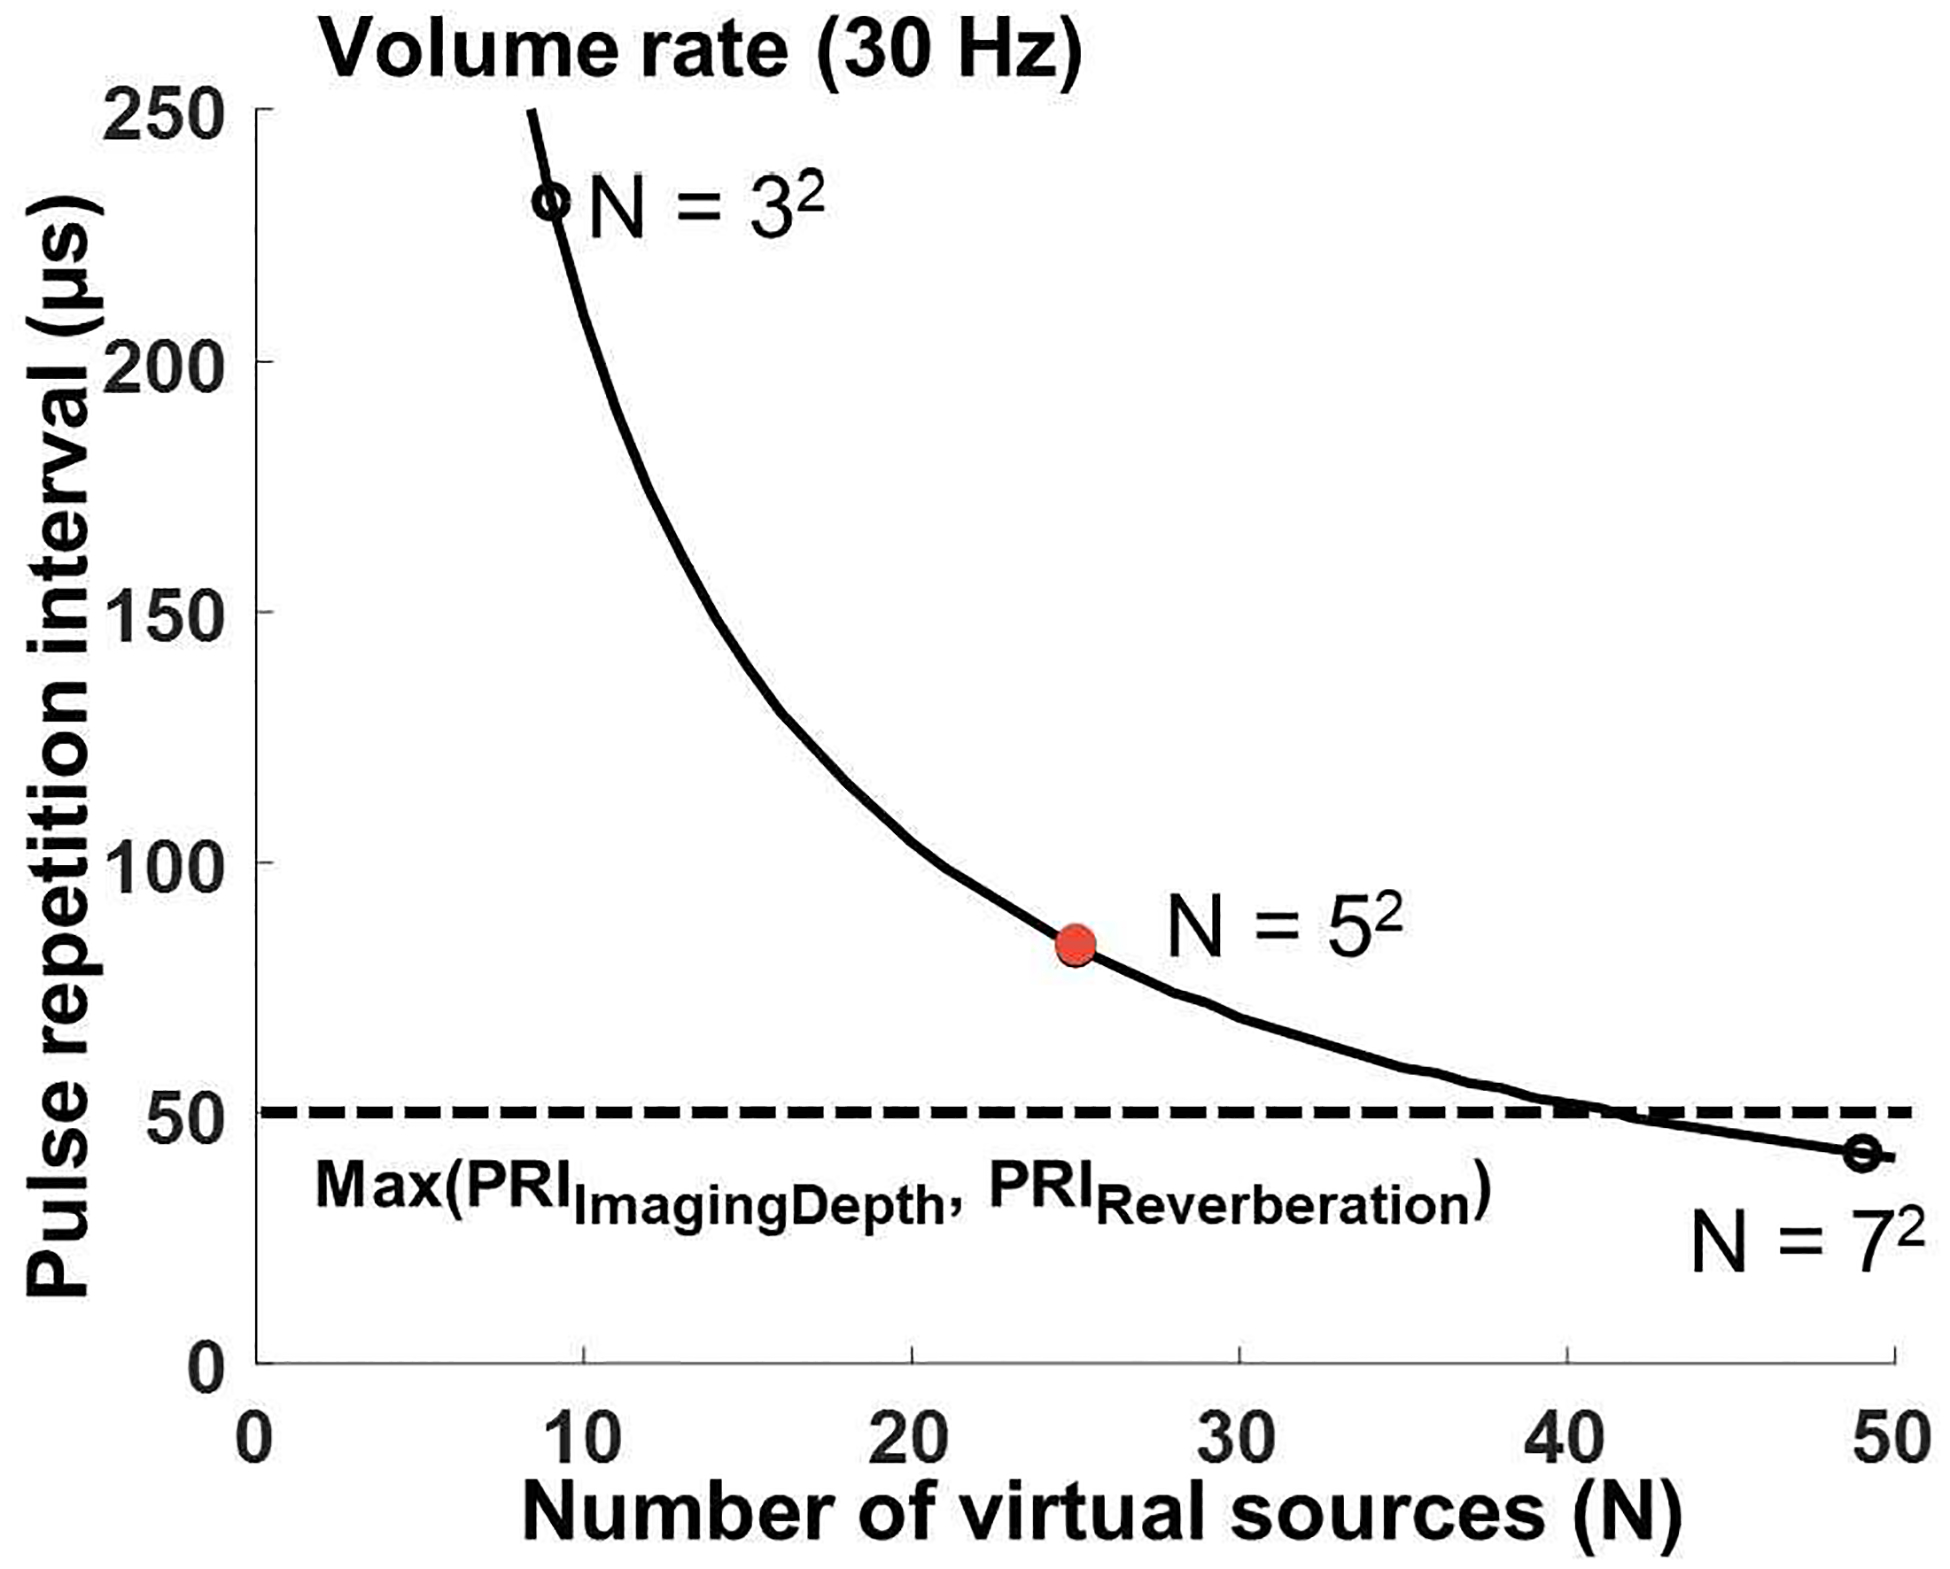
The relationship between pulse repetition interval (PRI), and the number of virtual sources (N) for a given volume rate (30 Hz). Black open dots at N=32, N=5, and N=72 represent the available number of virtual sources and a red dot represents the parameters (N=52, PRI=83.25 μs) selected for this study. More than 12.2 GB of system memory was required to store raw RF samples for our study (N = 52, imaging depth of 2 cm, the total number of acquired compounded volumes is 100).
For the analysis below, several basic assumptions were made: 16 synthetic transmit/receive events per virtual source, an imaging depth of 66 wavelengths (corresponding to around 2 cm at 5.2 MHz), excluding initial 16 wavelengths containing MUX switching artifacts (thus, not acquiring an initial depth of 0.5 cm), a single cycle transmission wave at a center frequency of 5.2 MHz, and a sampling frequency of 20.8 MHz. Applied voltage for transmission was 20 V and the TGC gain was set to the maximum for all depths for experimental consistency.
The minimum PRI (≈50 μs) can be defined by the larger of the travel time of acoustic wave for the imaging depth (26 μs to travel a total trip distance of 4 cm) and the practical shortest time to avoid reverberation artifacts. Here, we chose a PRI of 83.25 μs to avoid the reverberation artifact between adjacent transmits. The number of virtual sources should be a square of an odd number – we chose it to be 25 (= 52). These parameters are indicated by a red dot in Fig. 4. The size of the system memory for acquisition of the 100 volumes then has to be more than 12.2 GB (= 100 compounded volumes × 25 virtual sources × 5 MB/compounded volume / 1024 MB/GB) while the size of a single uncompounded volume per virtual source is 5 MB (= 16 synthetic transmit/receive events × 256 channels × 640 samples/channel × 2 Bytes / 10242 Bytes/MB). Here, 640 samples per each channel of the array was determined from the wavelength and imaging depth. The round-trip imaging depth, measured in wavelength λ, would be 132λ, and each wavelength was recorded in 4 samples, resulting in 528 samples. Additional samples were added to consider wave propagating at oblique angle, making 640 samples. Thus, for dynamic delay-and-sum receive beamforming, our imaging parameters satisfy the practical resources of our system. The overall imaging parameters are listed in Table I.
TABLE I.
Imaging Parameters for Volumetric Data Acquisition
| Type | Parameters | Value |
|---|---|---|
| Application-specific requirements | Volume rate | 30 Hz |
| Volume data acquisition rate | 750 Hz | |
| Total no. of acquired volumes | 100 | |
| Design parameters | No. of synthetic transmit/receive events | 16 |
| No. of virtual sources | 25 (5×5) | |
| Transmit diverging angle | 30° | |
| Angle interval between virtual sources | 7.5° | |
| Focal distance of a central virtual source | −19 mm | |
| Pulse-repetition interval | 83.25 μs | |
| Transmit parameters | Center frequency | 5.2 MHz |
| No. of cycles of Tx | 1 cycle | |
| Applied voltage | 20 V | |
| System Resource | Required system memory | > 12.2 GB |
D. Design of an imaging sequence
The typical 2-D imaging sequence of Verasonics system simultaneously performs RF data transfer and reconstruction in real-time. However, volume reconstruction in 3-D imaging is computationally more complex than the image reconstruction in 2-D imaging. Furthermore, because the size of channel memory in the Verasonics data acquisition system is finite, the system has to transfer the RF data to allow the memory to clear before it fills. This data transfer process also has to be carefully designed to achieve a desirable volume imaging rate.
To address these challenges, this study implemented an efficient method of continuous acquisition of volume data with the Verasonics system as outlined in Fig. 5. The imaging sequence consists of two different modes: real-time imaging mode and data acquisition mode. The real-time imaging mode provides three orthogonal 2-D images on x-z, x-y, and y-z planes in real-time, instead of an entire rendered volume. The low number of virtual sources (between 1 and 4 depending on volume size) is used to reduce processing time for volume reconstruction. The real-time imaging mode is designed for an operator to rapidly find a region-of-interest with real-time feedback using low-quality images.
Fig. 5.
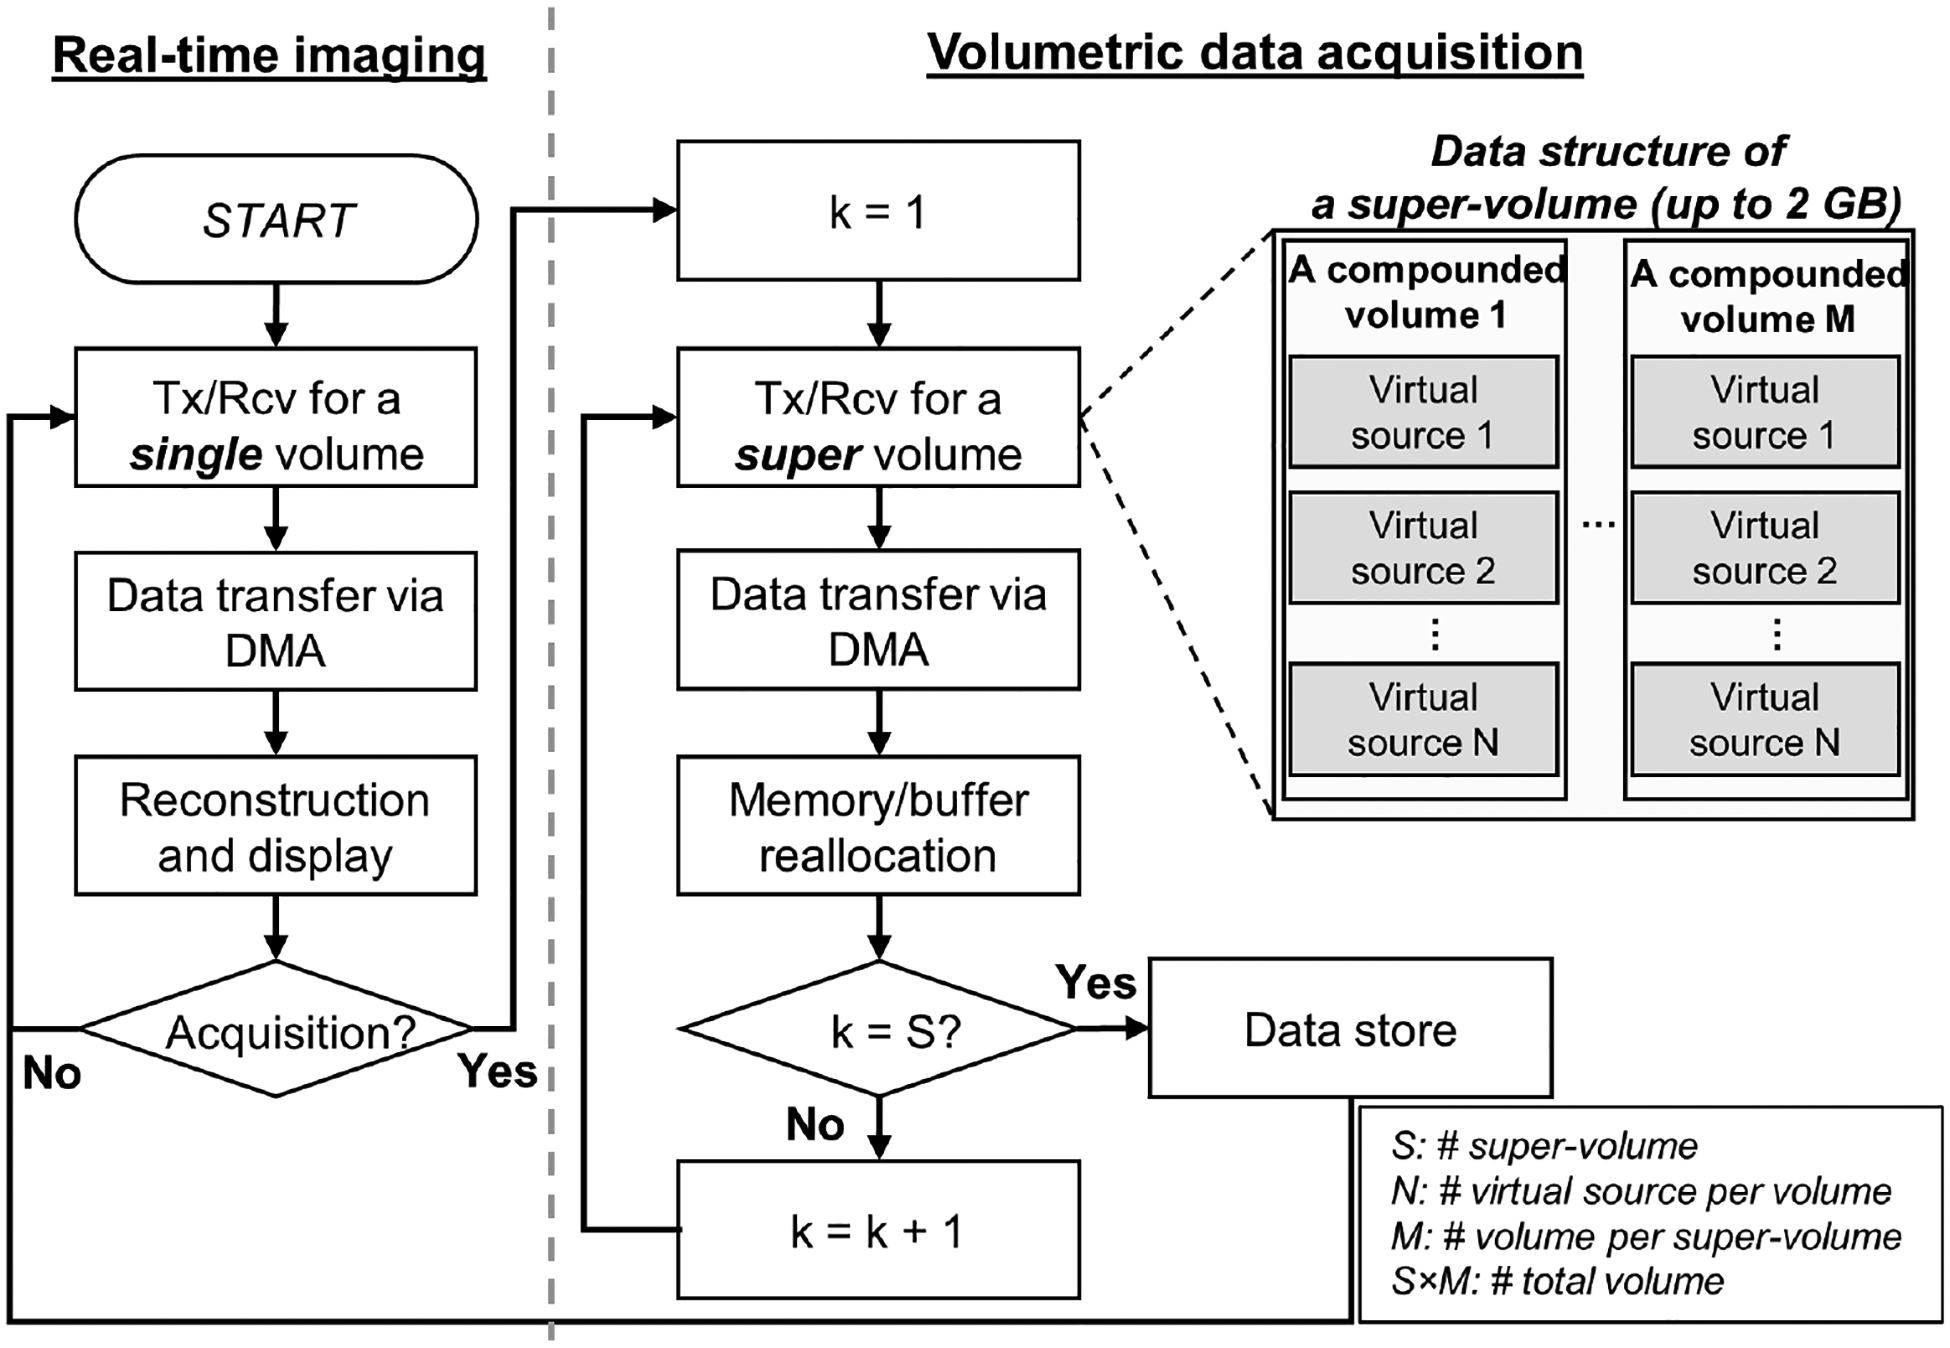
The flow chart for the developed sequence for volumetric data acquisition. Two imaging modes are provided. Live image reconstruction & visualization is omitted in the data acquisition mode. Tx: Transmit, Rcv: Receive, S: the number of super-volumes, N: the number of virtual sources per volumes, M: the number of volumes in a super-volume. S×M: the number of total volumes, S×M×N: the number of total Tx/Rcv acquisition events.
The data acquisition mode can be initiated by clicking the acquisition button on the GUI during the real-time imaging mode. In the data acquisition mode, the system only acquires and transfers the RF data samples, without reconstruction. A key design point of the data acquisition mode is the completion of data transfer before the end of the next data acquisition. In the case of the typical 2-D imaging sequence, the single data transfer size is small enough to complete the data transfer between every frame acquisition. However, in the 3-D imaging sequence, the packet size for single data transfer is substantially larger than the case of the 2-D imaging sequence, and thus, the timing between data acquisition events and data transfer should be carefully adjusted. On the other hand, too frequent use of DMA transfer may cause unexpected timing mismatch between acquisitions. This is because each data transfer requires a certain duration of the overhead of DMA initiation and termination. Therefore, we define “super volume” as a unit of DMA transfer containing multiple compounded volumes to reduce the overhead of DMA transfer. The maximum data packet size of each DMA transfer is 2 GB. In this study, 10 compounded volumes acquired through 4,000 transmit-receive events (= 16 synthetic transmit/receive events × 25 virtual sources × 10 compounded volumes) are packed into a super-volume packet. The estimated data size of each super-volume packet is 1.2 GB. The corresponding estimated data transfer time is 214 ms, shorter than the 333 ms interval between acquisitions of super-volumes. Fig. 6 illustrates the timing diagram of the data acquisition mode with the parameters listed in Table 1.
Fig. 6.
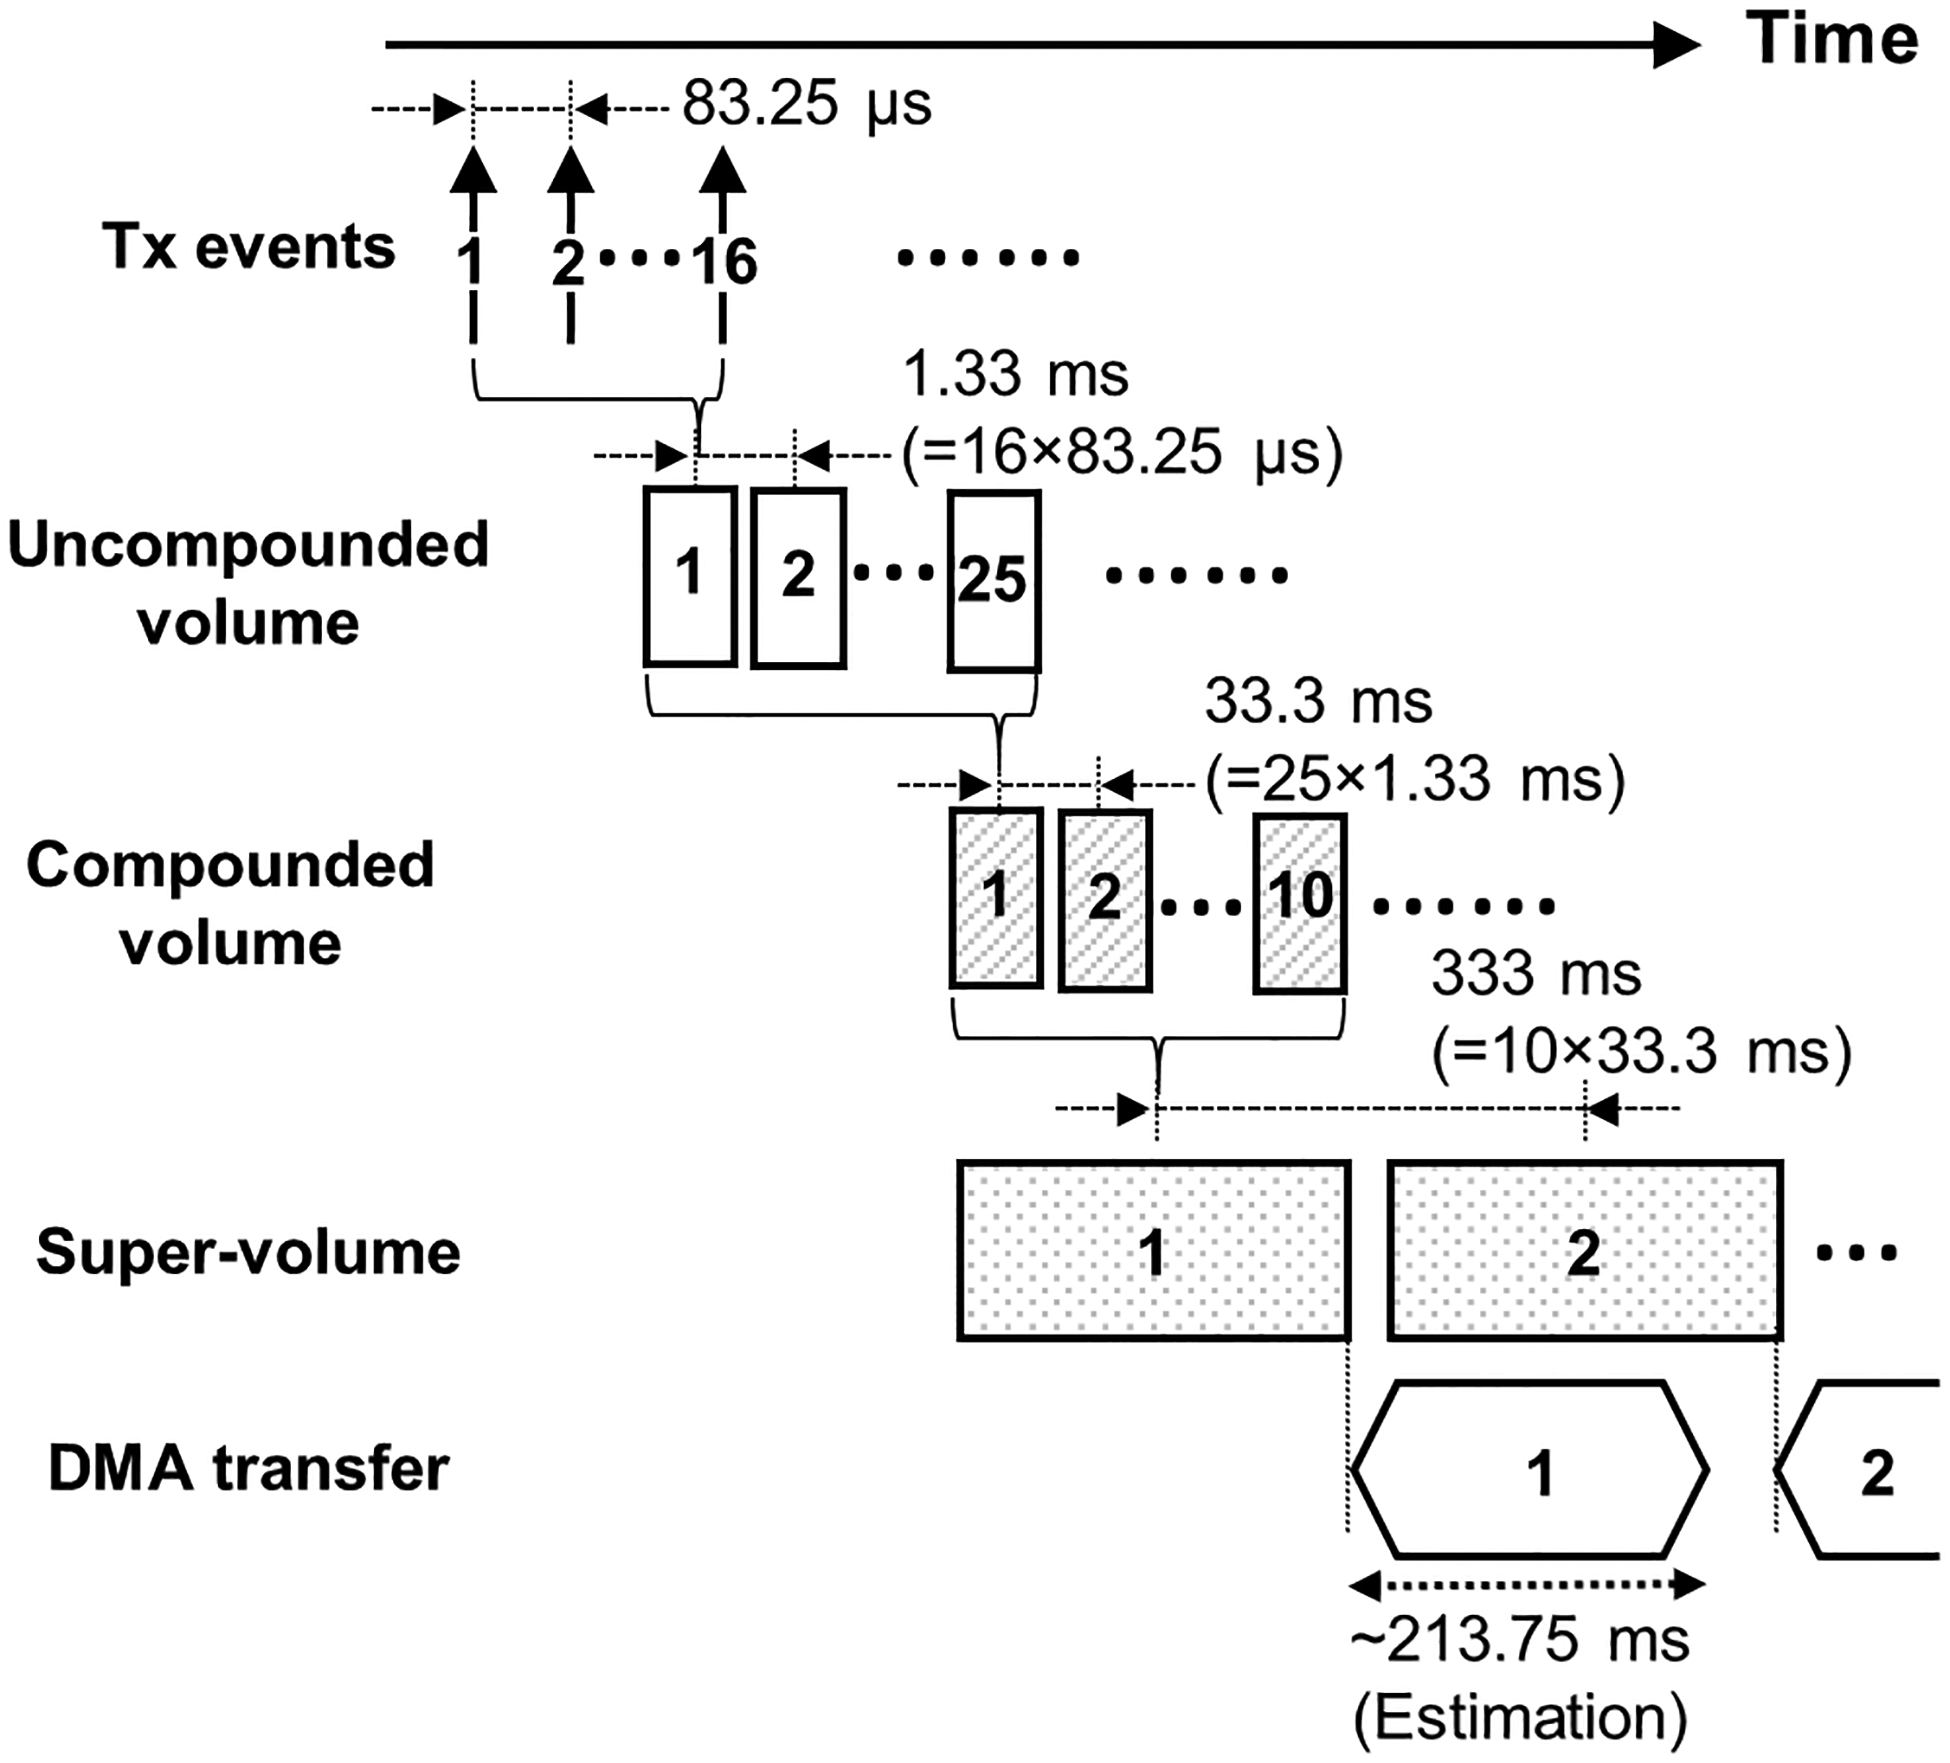
The event timing diagram in the acquisition mode with parameters listed in Table 1. Tx: Transmit, DMA: Direct Memory Access
The system cannot execute the infinite number of acquisition events due to the limited event memory capacity. Therefore, the super-volume acquisition events are iterated by using a ‘loop jump’ operation to reuse the system resources for acquisition of longer volume dataset than the system event memory allowance. In every iteration, RF data is transferred to the host computer memory, and an external function is called to re-allocate memory structure. The transferred RF data is stored on the hard disk at the end of sequence.
For reference, our imaging sequence and reconstruction scripts used in this study are available in the Verasonics Community portal website (http://verasonicscommunity.com/). Reconstruction script utilized the system built-in software. Further instructions of these scripts are documented in our software distribution package. All sequences were written based on Vantage software version 4.0.0–1812011200.
E. Experiment setup
A fresh porcine eye acquired from a slaughterhouse (Holifield Farms, Covington, GA, USA) was used for demonstration of anatomical imaging capability of the developed volumetric imaging sequence. The dissected eye was sterilized by soaking in Betadine solution (Purdue Pharma, New York, NY, USA) for 5 minutes and then fixed in formalin solution. The extracted porcine eyeball was placed in a tissue-mimicking gelatin phantom. The concentration of the gelatin powder (Sigma-Aldrich, St. Louis, MO, USA) was 7% weight/volume, and silica particles (Sigma-Aldrich, St. Louis, MO, USA) of 0.1% weight/volume were supplemented as acoustic scatterers.
An iris diaphragm with stainless steel leaves (D50S, Thor-labs, Inc., Newton, NJ, USA), mimicking in vivo pupil dynamics, was imaged at a compounded volume rate of 30 Hz to assess temporal imaging capability of pupil reaction. The iris was submerged in a tank filled with distilled water. Iris aperture size was manually adjusted from the maximum size to the minimum size over 0.9 seconds because the elapsed time of normal pupil constriction to light input is 0.7 – 1.0 second [38].
The aforementioned imaging sequence with the parameters listed in Table 1 was implemented on a single 256-channel Verasonics ultrasound platform. The acquired volumetric RF data from the ex vivo eye and the iris phantom were processed off-line. After beamforming and demodulation, in-phase and quadrature data (i.e., IQ data) acquired from multiple virtual sources were coherently compounded. Logarithmic compression with a dynamic range of 25 dB was applied to the envelope of the compounded data. For visualization of C-plane (x-y plane) images, the maximum intensity projection along the z-axis was applied. All images were processed offline using the MATLAB software (Mathworks, Natick, MA, USA). ImageJ software (National Institutes of Health, Bethesda, MD, USA) was utilized to measure the pupil size on the 2-D image and generate a 3-D volume image [39].
III. Results
The feasibility of the developed imaging sequence as an ultrasonic pupilometer was demonstrated in two different perspectives: the capability of multi-planar structural visualization using a static target, an ex vivo porcine eyeball, and the capability of temporal visualization using a dynamic target, an in vitro stainless-steel iris diaphragm.
A. Multi-planar imaging of an ex vivo porcine eyeball
Fig. 7 shows multi-planar 2-D images on the long axis at an azimuthal angle of 0° (sagittal plane, x-z plane), 45°, and 90° (transverse plane, y-z plane), as well as the short axis on the coronal plane, and a 3-D image of the porcine eyeball. All images were cropped to contain only the anterior part of the porcine eye, while the coronal imaging is reconstructed by the maximum intensity projection. As a pupil is an open window located in the center of the iris, the diameter change of the exposed lens through the pupil can be measured as an indirect indicator of the pupil’s activity. Long axis images (Fig. 7(a), (b) and (c)) show the structure of cornea and lens. The coronal plane (Fig. 7(d, e)) would be an appropriate imaging plane for pupil monitoring. As seen in Fig. 7(d), unwanted signals from the cornea or the posterior part of the lens may be included, and the maximum intensity projection may impede identification of the region of interest. However, due to the depth-resolved ability of multi-planar imaging, anatomical features obtained at different depths can be color-coded and superimposed on the coronal image (Fig. 7(e)), enabling physicians to distinguish the geometrical origin of signals. In Fig. 7, each region in the image can be classified according to imaging depth. For example, the signal from the cornea (8 mm), the anterior part (10 mm) and the posterior part of the lens (15 mm) are highlighted with red, orange, and navy colors, respectively.
Fig. 7.
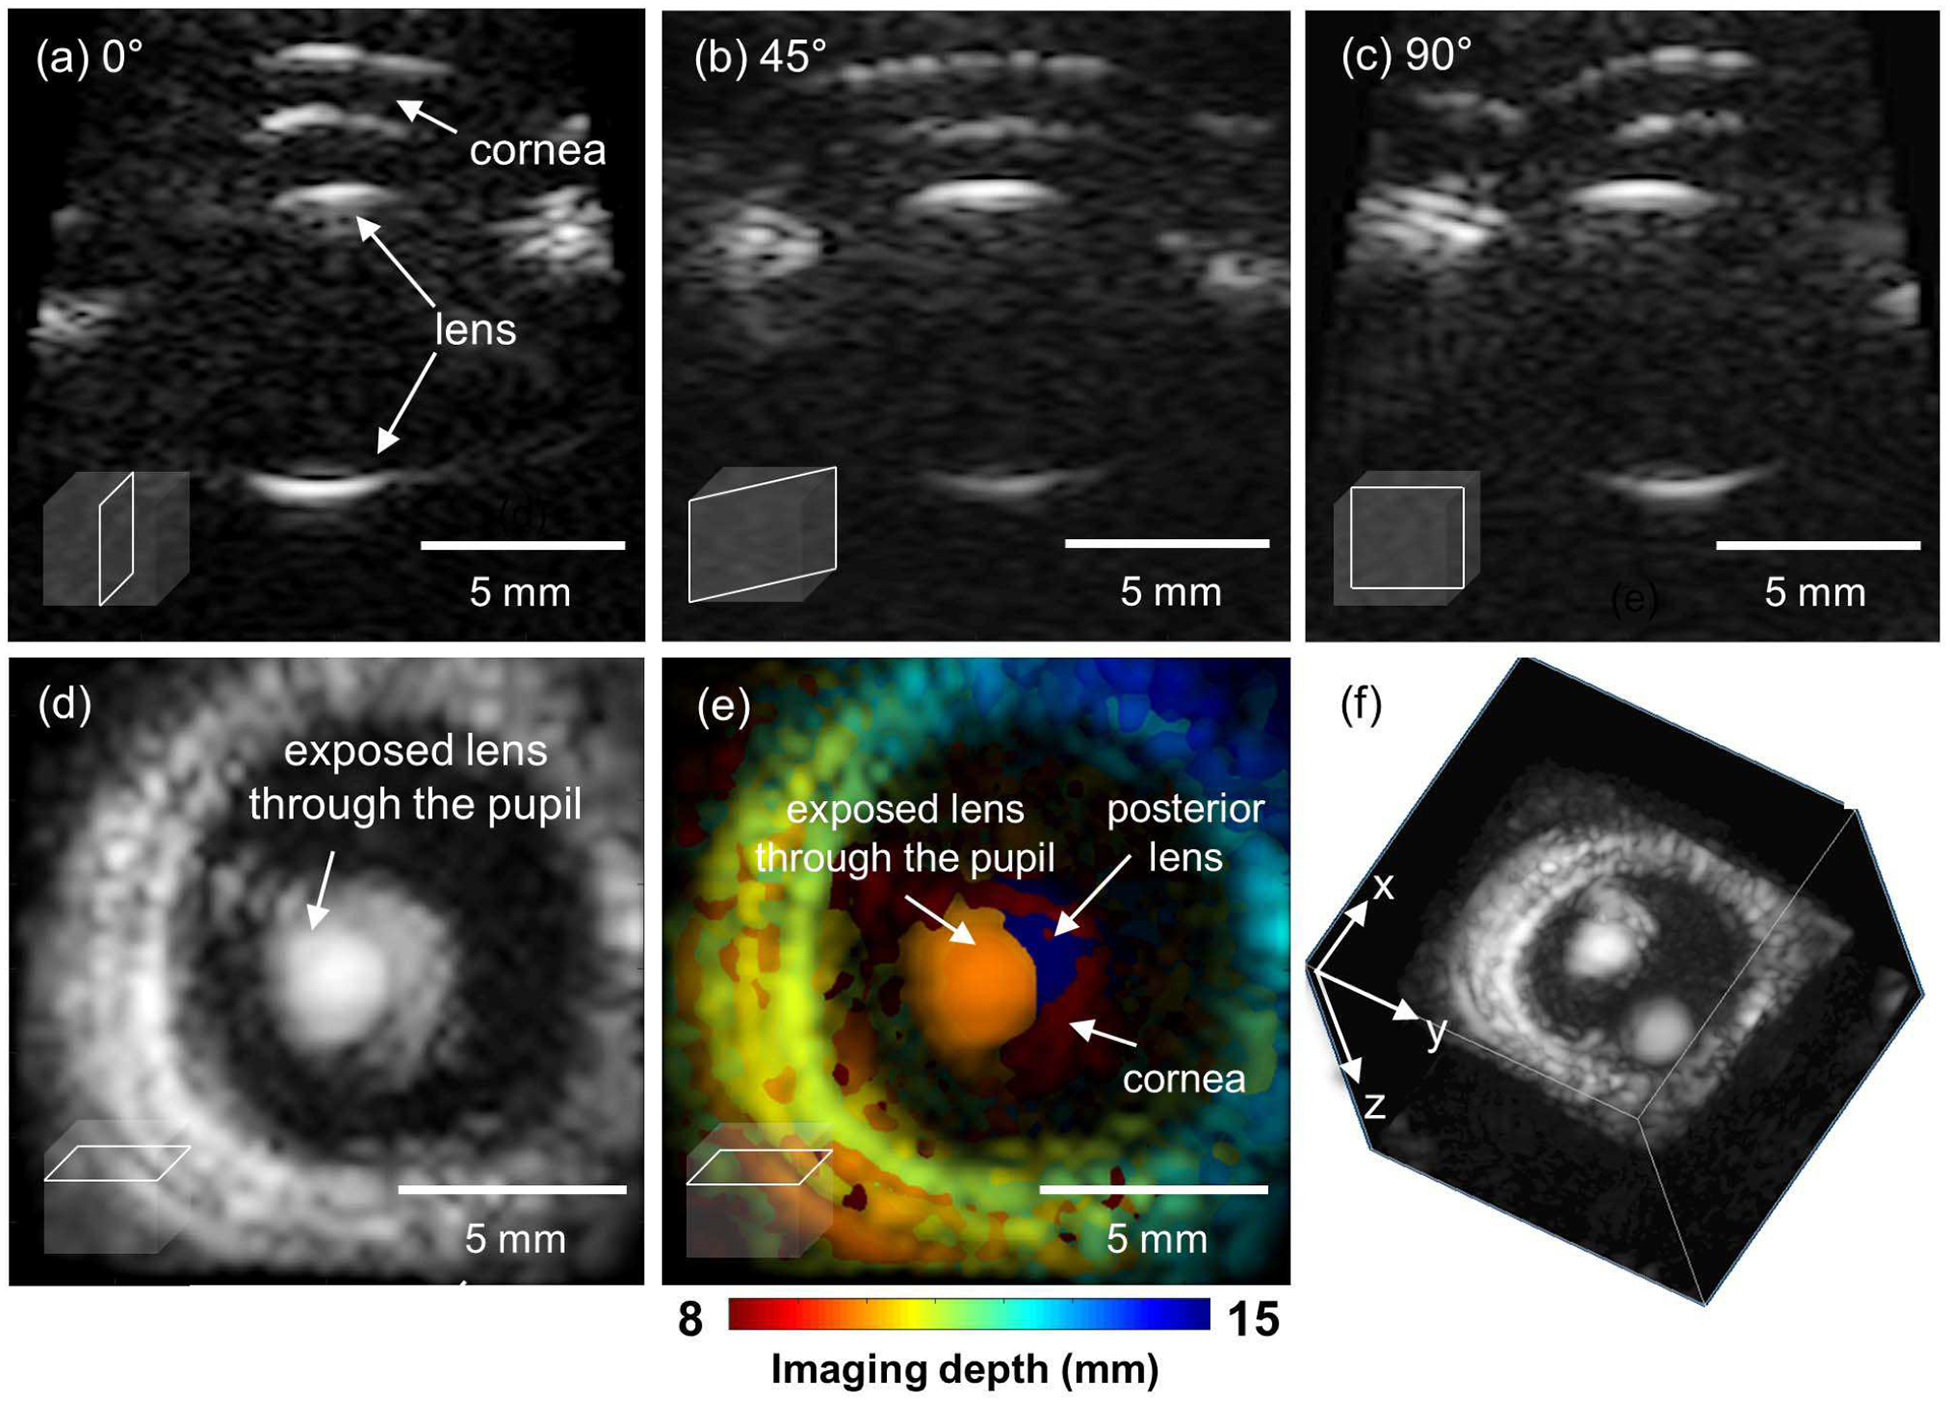
Multi-planar imaging of an ex vivo porcine eyeball. (a) The long axis image at azimuthal angle of 0°, (b) 45°, (c) 90°, (d) The image on the coronal plane reconstructed by using the maximum intensity projection. (e) The color-coded depth information superimposed to the coronal image (d). and (f) The 3D volume visualization.
B. Fast volumetric imaging of an in vitro stainless-steel iris diaphragm
The central hole, surrounded by the dynamically moving metal flap, of an artificial stainless-steel iris modeled the pupil of an eye. The manual constriction of the stainless-steel iris over 0.9 seconds was imaged at the frame rate of 30 Hz. Three maximum intensity projection images in Fig. 8(a), (b), and (c) were obtained from the coronal plane at three time points 0, 0.67, and 0.90 seconds, respectively. The captured video is available in Supplementary video 1. Corresponding 3-D rendered images are presented in Fig. 8(d), (e) and (f). The modeled pupil diameter was measured changing from 10 mm to 2 mm over 0.9 seconds. The spatial resolution shown in this study is sufficient to monitor the pupil constriction of the swine model, where the pupil diameter change ranges from 7.2 mm to 5.8 mm on average [40].
Fig. 8.
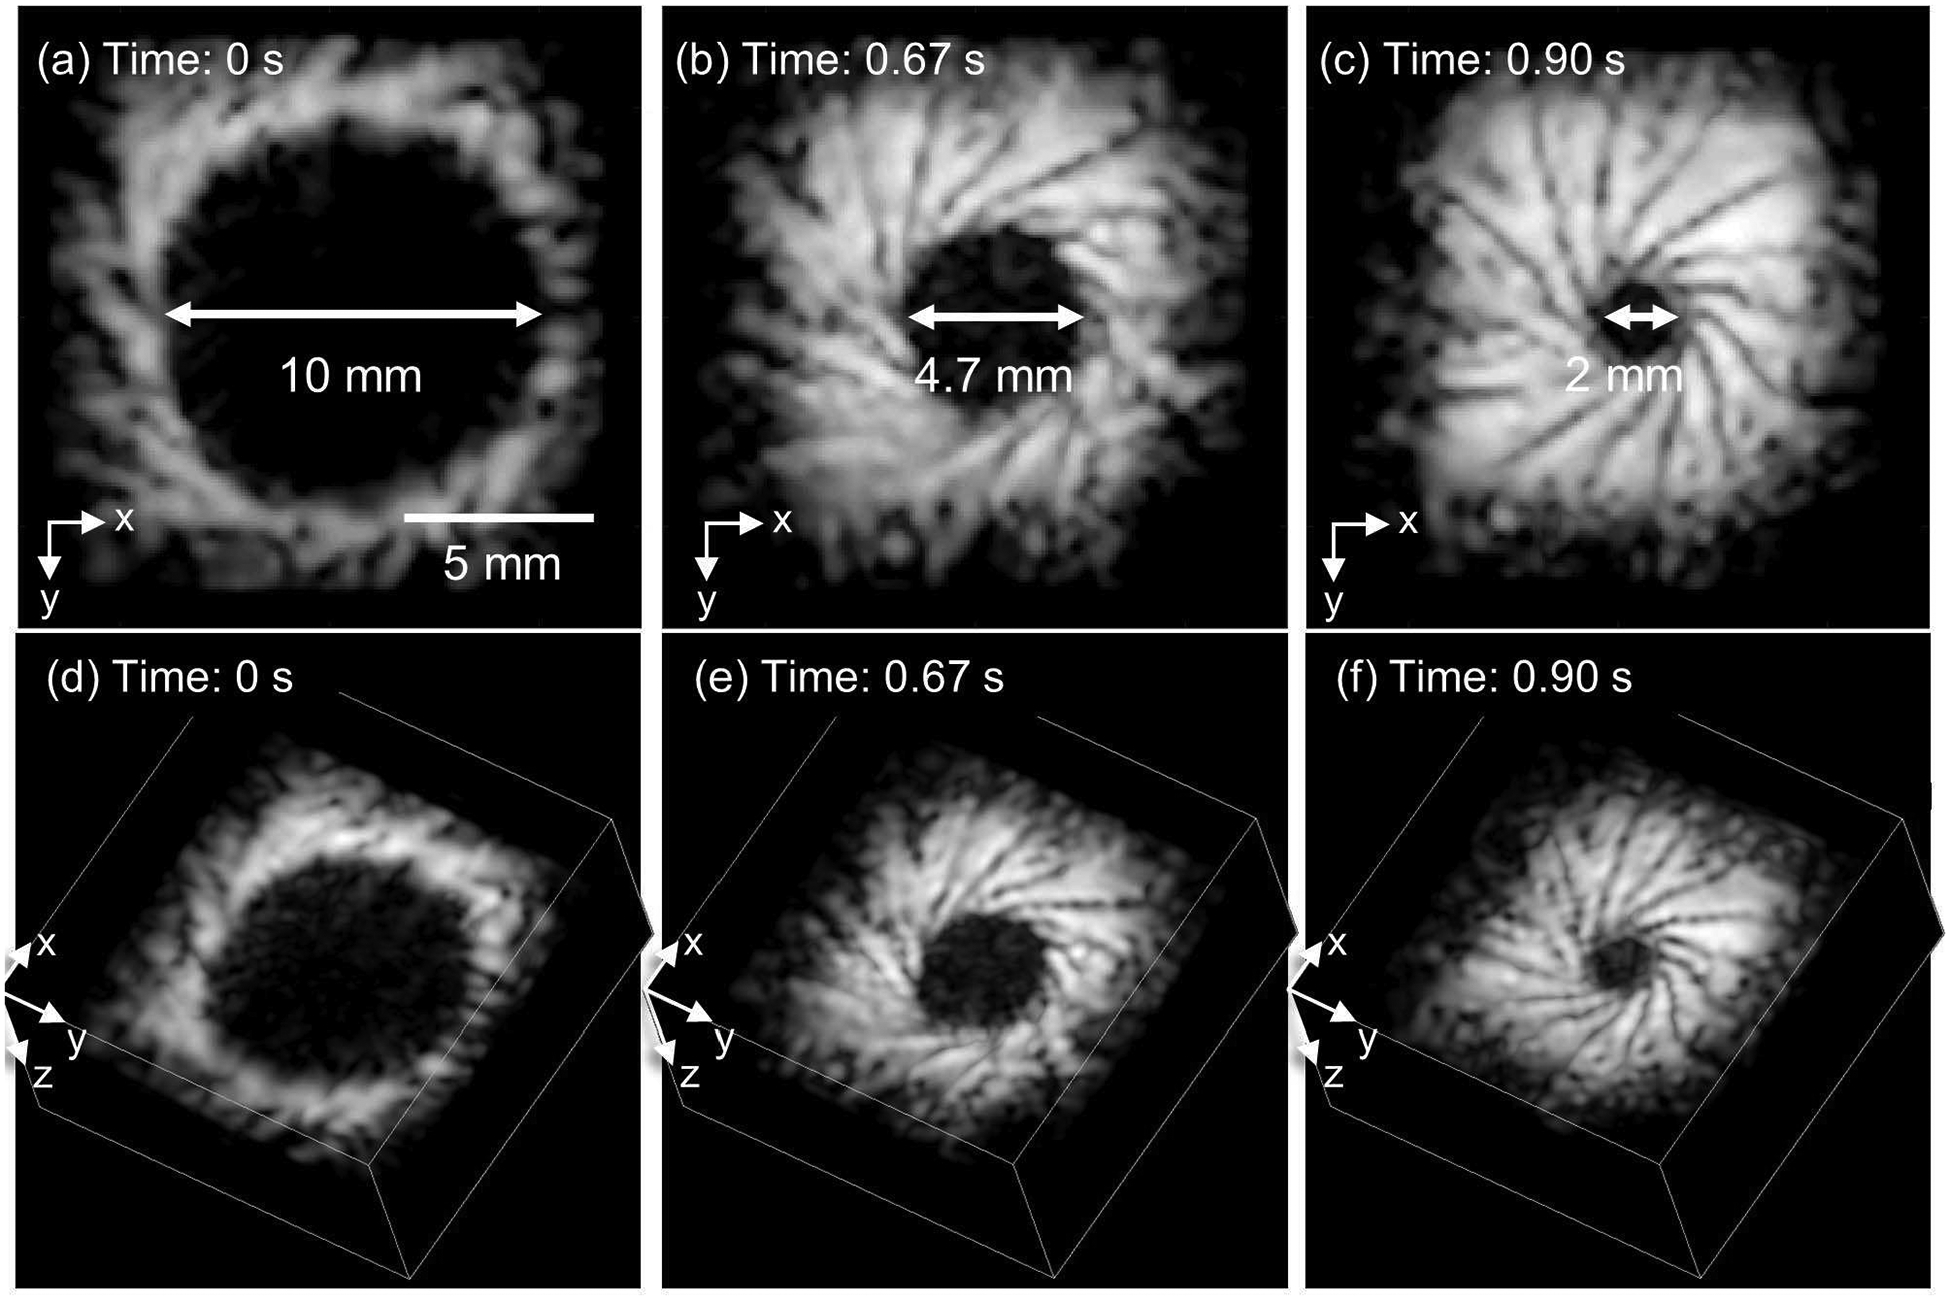
The fast volumetric ultrasound imaging using in vitro stainless steel iris diaphragm. Top panels represent the maximum intensity projection of C-plane images and bottom panels represent the 3-D visualization at the same time point. All images are taken at the frame rate of 30 Hz and also available in the supplementary video 1.
The size of the total acquired RF data is around 12.2 GB and the required data transfer bandwidth is 3.7 GB/s when a super-volume contains 10 compounded volumes. Theoretically, the maximum recordable duration of volumetric imaging with our imaging parameters is around 20 seconds when 80 GB of installed memory is ideally utilized, but the acquisition time may be likely reduced due to the DMA overhead and the delay of the external function call.
Thus, the results have demonstrated the recording capability of our developed imaging sequence for longitudinal volumetric imaging at a frame rate of 30 Hz with sufficient temporal and spatial resolution for ultrasonic pupil tracking.
C. Limitations
This study has focused on developing a volume data acquisition sequence, maximizing system resource utilization to handle massive volume data using the Verasonics system with a matrix array. However, there still remain hurdles. One is real-time reconstruction. The current CPU-based reconstruction software is not capable of visualizing the acquired data in real time because of its lack of computing power. Exploiting a graphics processing unit (GPU) that enables enormous data-level parallelism in the delay-and-sum beamforming technique may be considered [41].
A low signal-to-noise ratio (SNR) of images can also be a concern when using the matrix array compared to the conventional 2-D imaging because of several reasons, including electrical impedance mismatch and small element size [42]. The low SNR issue may be resolved by utilizing the greater number of elements to increase power. However, the complication in electrical interconnection may limit the practical number of elements in the matrix array transducer, resulting in the limited footprint or aperture size. Even though several techniques such as sparse array, coherent compounding, and virtual sources have been suggested to overcome these physical limitations, most of these techniques confer other penalties, such as lower signal-to-noise ratio or slow volume rate [13], [14], [16], [31]. Therefore, further study is needed to find optimal parameters balancing the trade-off between image quality and volume rate for specific clinical applications.
Finally, this study performed two independent experiments, ex vivo porcine eye imaging and moving stainless steel imaging, to show its feasibility for in vivo eye imaging for pupillary light reflex assessment. The results have shown that our imaging approach is capable of identifying the anatomic structure of the eye and tracking a moving target at the desired frame rate. However, our stainless-steel iris diaphragm can result in impractically-strong acoustic reflection, while the static ex vivo eye lacks physiological motion. Thus, we will pursue an investigation of the developed imaging approach using in vivo animal model, as well as further optimization of the transmit and receive scheme for improved in vivo quantification of pupil dynamics.
IV. Conclusions
This study has investigated an efficient strategy for structuring an imaging sequence of volumetric data acquisition for a single 256-channel ultrasound scanner operating a 1024-element fully-sampled matrix array using a 4-to-1 high-voltage multiplexer. We have demonstrated a sequence programming for volumetric ocular ultrasound imaging with selected imaging parameters, including the PRI and the number of virtual sources, under the application requirements and limited system resources. The feasibility of the developed ultrasonic pupilometer has been evaluated by using an ex vivo porcine eyeball, and an in vitro moving stainless-steel iris. As demonstrated, the developed system can be potentially utilized to measure the light reflex pupillary constriction for assessing brain stem function. We expect that this study may provide a foundation for the rapid establishment of volumetric ultrasound imaging platforms, stimulating further related work in the near future.
Supplementary Material
Acknowledgment
This work was supported by the U.S. National Institute of Health under grants CA149740, R01EB008101 and CA158598, and by the Breast Cancer Research Foundation under a grant BCRF-18-043. Authors thank Don Vanderlaan and David Qin for great help and discussions in the revision of the manuscript.
Biographies
Jaesok Yu, Ph.D., received B.S. and M.S. degrees in electronic engineering from the Sogang University, Seoul, South Korea in 2009 and 2011, respectively. After receiving M.S. degree, he was a researcher in the Medical solution institute, Sogang University for two years, mainly developing a novel ultrasound imaging platform and Doppler and nonlinear imaging technologies. He obtained his Ph.D. degree in bioengineering at University of Pittsburgh, Pittsburgh, PA, USA at the Multi-modality Biomedical Ultrasound Imaging Lab operated within the Center for Ultrasound Molecular Imaging and Therapeutics, University of Pittsburgh Medical Center, under supervision of Dr. Kang Kim. He is currently with electrical and computer engineering of the Georgia Institute of Technology, Atlanta, GA, USA as a post-doctoral fellow in the Ultrasound Imaging and Therapeutics Laboratory directed by Dr. Stnaislav Emelianov. His recent research interests include ultrasound and photoacoustic based multi-modal biomedical imaging and therapeutic technologies combined with bionanotechnology and its clinical translations.

Heechul Yoon, Ph.D., received B.S. and M.S. degrees in electrical engineering from the Sogang University, Seoul, South Korea in 2008 and 2010, respectively. He completed his Ph.D degree in elctrical and computer engineering from the Georgia Institute of Technology, Atlanta, GA, USA in 2018. From 2010 to 2014, he worked in Samsung Electronics, Suwon, South Korea as a researcher on ultrasound signal and image processing. In 2014, he began his Ph.D. studies at the University of Texas at Austin where he conducted studies in the Ultrasound Imaging and Therapeutics Laboratory. In 2015, the laboratory moved to the Georgia Institute of Technology where he obtained Ph.D in Electrical and Computer Engineering. He conducted his research at Georgia Tech and Emory University School of Medicine. He is currently with Siemens Healthineers, Issaquah, WA, USA as a staff engineer. His research interests include development and clinical translation of medical imaging technologies including shear wave elasticity imaging and ultrasound-guided photoacoustic imaging.

Yousuf M. Khalifa, MD, serves as chief of service of ophthalmology at Grady Memorial Hospital and in the cornea service at Emory Eye Center and associate professor of ophthalmology, Emory University School of Medicine, Section of Cornea, External Disease and Refractive Surgery. Dr. Khalifa previously served at the University of Rochester, where he was cornea and external disease specialist and residency program director. He earned his medical degree at the Medical College of Georgia, where he also completed an internship and ophthalmology residency. He then went to the University of California San Francisco’s Proctor Fellowship as a Heed Fellow, followed by a fellowship in cornea and refractive surgery at the University of Utah’s Moran Eye Center.

Stanislav Emelianov, Ph.D is a Joseph M. Pettit Endowed Chair, Georgia Research Alliance Eminent Scholar, and Professor of Electrical & Computer Engineering and Biomedical Engineering at the Georgia Institute of Technology. He is also appointed at Emory University School of Medicine where he is affiliated with Winship Cancer Institute, Department of Radiology, and other clinical units. Furthermore, Dr. Emelianov is Director of the Ultrasound Imaging and Therapeutics Research Laboratory at the Georgia Institute of Technology focused on the translation of diagnostic imaging & therapeutic instrumentation, and nanobiotechnology for clinical applications.
Throughout his career, Dr. Emelianov has been devoted to the development of advanced imaging methods capable of detecting and diagnosing cancer and other pathologies, assisting treatment planning, and enhancing image-guided therapy and monitoring of the treatment outcome. He is specifically interested in intelligent biomedical imaging and sensing ranging from molecular imaging to small animal imaging to clinical applications. Furthermore, Dr. Emelianov develops approaches for image-guided molecular therapy and therapeutic applications of ultrasound and electromagnetic energy. Finally, nanobiotechnology plays a critical role in his research. In the course of his work, Dr. Emelianov has pioneered several ultrasound-based imaging techniques including shear wave elasticity imaging and molecular photoacoustic imaging.

Contributor Information
Jaesok Yu, School of Electrical and Computer Engineering, Georgia Institute of Technology, Atlanta, GA 30332 USA, and with Wallace H. Coulter Department of Biomedical Engineering, Georgia Institute of Technology and Emory University School of Medicine, Atlanta, GA 30332 USA.
Heechul Yoon, School of Electrical and Computer Engineering, Georgia Institute of Technology, Atlanta, GA 30332 USA, and with Wallace H. Coulter Department of Biomedical Engineering, Georgia Institute of Technology and Emory University School of Medicine, Atlanta, GA 30332 USA. He is currently with Siemens Healthineers, Issaquah, WA 98029 USA..
Yousuf M. Khalifa, Department of Ophthalmology, Emory University School of Medicine, Atlanta, GA 30307, USA, and Department of Ophthalmology, Grady Memorial Hospital, Atlanta, GA 30303, USA.
Stanislav Y. Emelianov, School of Electrical and Computer Engineering, Georgia Institute of Technology, Atlanta, GA 30332 USA, and with Wallace H. Coulter Department of Biomedical Engineering, Georgia Institute of Technology and Emory University School of Medicine, Atlanta, GA 30332 USA.
References
- [1].Wilson SR, Gupta C, Eliasziw M, and Andrew A, “Volume imaging in the abdomen with ultrasound: How we do it,” Am. J. Roentgenol, vol. 193, no. 1, pp. 79–85, Jul. 2009. [DOI] [PubMed] [Google Scholar]
- [2].Mozaffari MH and Lee W-S, “Freehand 3-D Ultrasound Imaging: A Systematic Review.,” Ultrasound Med. Biol, vol. 43, no. 10, pp. 2099–2124, Oct. 2017. [DOI] [PubMed] [Google Scholar]
- [3].Fenster A, Parraga G, and Bax J, “Three-dimensional ultrasound scanning.,” Interface Focus, vol. 1, no. 4, pp. 503–19, Aug. 2011. [DOI] [PMC free article] [PubMed] [Google Scholar]
- [4].Mercier L, Langø T, Lindseth F, and Collins DL, “A review of calibration techniques for freehand 3-D ultrasound systems,” Ultrasound Med. Biol, vol. 31, no. 4, pp. 449–471, Apr. 2005. [DOI] [PubMed] [Google Scholar]
- [5].Provost J et al. , “3D ultrafast ultrasound imaging in vivo,” Phys. Med. Biol, vol. 59, no. 19, pp. L1–L13, Oct. 2014. [DOI] [PMC free article] [PubMed] [Google Scholar]
- [6].Boni E, Yu ACH, Freear S, Jensen JA, and Tortoli P, “Ultrasound Open Platforms for Next-Generation Imaging Technique Development,” IEEE Trans. Ultrason. Ferroelectr. Freq. Control, vol. 65, no. 7, pp. 1078–1092, Jul. 2018. [DOI] [PMC free article] [PubMed] [Google Scholar]
- [7].Jensen JA et al. , “SARUS: A synthetic aperture real-time ultrasound system,” IEEE Trans. Ultrason. Ferroelectr. Freq. Control, vol. 60, no. 9, pp. 1838–1852, Sep. 2013. [DOI] [PubMed] [Google Scholar]
- [8].Tortoli P, Bassi L, Boni E, Dallai A, Guidi F, and Ricci S, “ULAOP: an advanced open platform for ultrasound research,” IEEE Trans. Ultrason. Ferroelectr. Freq. Control, vol. 56, no. 10, pp. 2207–2216, Oct. 2009. [DOI] [PubMed] [Google Scholar]
- [9].Smith PR, Cowell DMJ, Raiton B, Ky CV, and Freear S, “Ultrasound array transmitter architecture with high timing resolution using embedded phase-locked loops,” IEEE Trans. Ultrason. Ferroelectr. Freq. Control, vol. 59, no. 1, pp. 40–49, Jan. 2012. [DOI] [PubMed] [Google Scholar]
- [10].Deng Y, Rouze NC, Palmeri ML, and Nightingale KR, “Ultrasonic shear wave elasticity imaging sequencing and data processing using a verasonics research scanner,” IEEE Trans. Ultrason. Ferroelectr. Freq. Control, vol. 64, no. 1, pp. 164–176, 2017. [DOI] [PMC free article] [PubMed] [Google Scholar]
- [11].Yoon H, Zhu YI, Yarmoska SK, and Emelianov SY, “Design and Demonstration of a Configurable Imaging Platform for Combined Laser, Ultrasound, and Elasticity Imaging,” IEEE Trans. Med. Imaging, vol. 38, no. 7, pp. 1622–1632, 2019. [DOI] [PMC free article] [PubMed] [Google Scholar]
- [12].Light ED, Davidsen RE, Fiering JO, Hruschka TA, and Smith SW, “Progress in two-dimensional arrays for real-time volumetric imaging,” Ultrason. Imaging, vol. 20, no. 1, pp. 1–15, Jan. 1998. [DOI] [PubMed] [Google Scholar]
- [13].Choe JW, Oralkan O, and Khuri-Yakub PT, “Design Optimization for a 2-D Sparse Transducer Array for 3-D Ultrasound Imaging.,” Proceedings. IEEE Ultrason. Symp, vol. 2010, pp. 1928–1931, Oct. 2010. [DOI] [PMC free article] [PubMed] [Google Scholar]
- [14].Diarra B, Liebgott H, Tortoli P, and Cachard C, “Sparse array techniques for 2D array ultrasound imaging,” in Acoustics 2012, 2012. [Google Scholar]
- [15].Diarra B, Robini M, Tortoli P, Cachard C, and Liebgott H, “Design of optimal 2-d nongrid sparse arrays for medical ultrasound,” IEEE Trans. Biomed. Eng, vol. 60, no. 11, pp. 3093–3102, Nov. 2013. [DOI] [PubMed] [Google Scholar]
- [16].Roux E, Varray F, Petrusca L, Cachard C, Tortoli P, and Liebgott H, “Experimental 3-D Ultrasound Imaging with 2-D Sparse Arrays using Focused and Diverging Waves,” Sci. Rep, vol. 8, no. 1, p. 9108, Dec. 2018. [DOI] [PMC free article] [PubMed] [Google Scholar]
- [17].Christiansen TL, Jensen JA, and Thomsen EV, “Acoustical crosstalk in row–column addressed 2-D transducer arrays for ultrasound imaging,” Ultrasonics, vol. 63, pp. 174–178, Dec. 2015. [DOI] [PubMed] [Google Scholar]
- [18].Christiansen TL, Rasmussen MF, Bagge JP, Moesner LN, Jensen JA, and Thomsen EV, “3-D imaging using row–column-addressed arrays with integrated apodization— part ii: transducer fabrication and experimental results,” IEEE Trans. Ultrason. Ferroelectr. Freq. Control, vol. 62, no. 5, pp. 959–971, May 2015. [DOI] [PubMed] [Google Scholar]
- [19].Rasmussen MF, Christiansen TL, Thomsen EV, and Jensen JA, “3-D imaging using row-column-addressed arrays with integrated apodization - part i: apodization design and line element beamforming,” IEEE Trans. Ultrason. Ferroelectr. Freq. Control, vol. 62, no. 5, pp. 947–958, May 2015. [DOI] [PubMed] [Google Scholar]
- [20].Bouzari H, Engholm M, Nikolov SI, Stuart MB, Thomsen EV, and Jensen JA, “Imaging Performance for Two Row–Column Arrays,” IEEE Trans. Ultrason. Ferroelectr. Freq. Control, vol. 66, no. 7, pp. 1209–1221, Jul. 2019. [DOI] [PubMed] [Google Scholar]
- [21].Sargsyan AE, Hamilton DR, Melton SL, Amponsah D, Marshall NE, and Dulchavsky SA, “Ultrasonic evaluation of pupillary light reflex,” Crit. Ultrasound J, vol. 1, no. 2, pp. 53–57, Dec. 2009. [Google Scholar]
- [22].Fisher YL, “The current status of ophthalmic B-scan ultrasonography,”J. Clin. Ultrasound, vol. 3, no. 3, pp. 219–223, Sep. 1975. [DOI] [PubMed] [Google Scholar]
- [23].Kardon R, “Pupillary light reflex.,” Curr. Opin. Ophthalmol, vol. 6, no. 6, pp. 20–6, Dec. 1995. [DOI] [PubMed] [Google Scholar]
- [24].Schreiber MA, Aoki N, Scott BG, and Beck JR, “Determinants of mortality in patients with severe blunt head injury.,” Arch. Surg, vol. 137, no. 3, pp. 285–90, Mar. 2002. [DOI] [PubMed] [Google Scholar]
- [25].Wang M, Byram B, Palmeri M, Rouze N, and Nightingale K, “Imaging Transverse Isotropic Properties of Muscle by Monitoring Acoustic Radiation Force Induced Shear Waves Using a 2-D Matrix Ultrasound Array,” IEEE Trans. Med. Imaging, vol. 32, no. 9, pp. 1671–1684, Sep. 2013. [DOI] [PMC free article] [PubMed] [Google Scholar]
- [26].Gennisson J et al. , “4-D ultrafast shear-wave imaging,” IEEE Trans. Ultrason. Ferroelectr. Freq. Control, vol. 62, no. 6, pp. 1059–1065, Jun. 2015. [DOI] [PubMed] [Google Scholar]
- [27].Desailly Y, Couture O, Fink M, and Tanter M, “Sono-activated ultrasound localization microscopy,” Appl. Phys. Lett, vol. 103, no. 17, 2013. [Google Scholar]
- [28].Montaldo G, Tanter M, Bercoff J, Benech N, and Fink M, “Coherent plane-wave compounding for very high frame rate ultrasonography and transient elastography,” IEEE Trans. Ultrason. Ferroelectr. Freq. Control, vol. 56, no. 3, pp. 489–506, Mar. 2009. [DOI] [PubMed] [Google Scholar]
- [29].Bae S and Song T-K, “Methods for Grating Lobe Suppression in Ultrasound Plane Wave Imaging,” Appl. Sci, vol. 8, no. 10, p. 1881, Oct. 2018. [Google Scholar]
- [30].Zhao J, Wang Y, Zeng X, Yu J, Yiu BYS, and Yu ACH, “Plane wave compounding based on a joint transmitting-receiving adaptive beamformer,” IEEE Trans. Ultrason. Ferroelectr. Freq. Control, vol. 62, no. 8, pp. 1440–1452, Aug. 2015. [DOI] [PubMed] [Google Scholar]
- [31].Lockwood GR, Talman JR, and Brunke SS, “Real-time 3-D ultrasound imaging using sparse synthetic aperture beamforming,” IEEE Trans. Ultrason. Ferroelectr. Freq. Control, vol. 45, no. 4, pp. 980–988, Jul. 1998. [DOI] [PubMed] [Google Scholar]
- [32].Sanchez I, Martin R, Ussa F, and Fernandez-Bueno I, “The parameters of the porcine eyeball,” Graefe’s Arch. Clin. Exp. Ophthalmol, vol. 249, no. 4, pp. 475–482, Apr. 2011. [DOI] [PubMed] [Google Scholar]
- [33].Guo W, Wang Y, Yu J, Guo W, Wang Y, and Yu J, “A Sibelobe Suppressing Beamformer for Coherent Plane Wave Compounding,” Appl. Sci, vol. 6, no. 11, p. 359, Nov. 2016. [Google Scholar]
- [34].Hasegawa H and Kanai H, “High-frame-rate echocardiography using diverging transmit beams and parallel receive beamforming,” J. Med. Ultrason, vol. 38, no. 3, pp. 129–140, Jul. 2011. [DOI] [PubMed] [Google Scholar]
- [35].Ellis CJ, “The pupillary light reflex in normal subjects.,” Br. J. Ophthalmol, vol. 65, no. 11, pp. 754–9, Nov. 1981. [DOI] [PMC free article] [PubMed] [Google Scholar]
- [36].Peinkhofer C et al. , “Influence of Strategic Cortical Infarctions on Pupillary Function,” Front. Neurol, vol. 9, p. 916, Oct. 2018. [DOI] [PMC free article] [PubMed] [Google Scholar]
- [37].Satou T, Goseki T, Asakawa K, Ishikawa H, and Shimizu K, “Effects of Age and Sex on Values Obtained by RAPDx®Pupillometer, and Determined the Standard Values for Detecting Relative Afferent Pupillary Defect.,” Transl. Vis. Sci. Technol, vol. 5, no. 2, p. 18, Apr. 2016. [DOI] [PMC free article] [PubMed] [Google Scholar]
- [38].Gradle H and Ackerman W, “The reaction time of the normal pupil,”J. Am. Med. Assoc, vol. 99, no. 16, p. 1334, Oct. 1932. [Google Scholar]
- [39].Schneider CA, Rasband WS, and Eliceiri KW, “NIH Image to ImageJ: 25 years of image analysis,” Nat. Methods, vol. 9, no. 7, pp. 671–675, Jun. 2012. [DOI] [PMC free article] [PubMed] [Google Scholar]
- [40].Zhao D, Weil MH, Tang W, Klouche K, and Wann SR, “Pupil diameter and light reaction during cardiac arrest and resuscitation,” Crit. Care Med, vol. 29, no. 4, pp. 825–828, Apr. 2001. [DOI] [PubMed] [Google Scholar]
- [41].Jung Woo Choe JW, Nikoozadeh A, Oralkan O, and Khuri-Yakub BT, “GPU-Based Real-Time Volumetric Ultrasound Image Reconstruction for a Ring Array,” IEEE Trans. Med. Imaging, vol. 32, no. 7, pp. 1258–1264, Jul. 2013. [DOI] [PMC free article] [PubMed] [Google Scholar]
- [42].Shung KK, “The principle of multidimensional arrays.,” Eur. J. Echocardiogr, vol. 3, no. 2, pp. 149–53, Jun. 2002. [DOI] [PubMed] [Google Scholar]
Associated Data
This section collects any data citations, data availability statements, or supplementary materials included in this article.


